The most challenging part of the race analysis process is writing the blog that accompanies my graphs. A few months of practice has refined the charting process so even when I have new data points to add it’s a matter of minutes to output a completed graph, but describing a race on the basis of a handful of histograms is another matter. It is easier when, as with Ironman Australia, I have raced there before, even then there is an element of guess work as to conditions. On paper, more precisely on Weather Underground, Port Macquarie looks to have had good weather for a race and this seems to be reflected in a set of results that are broadly comparable to previous years.
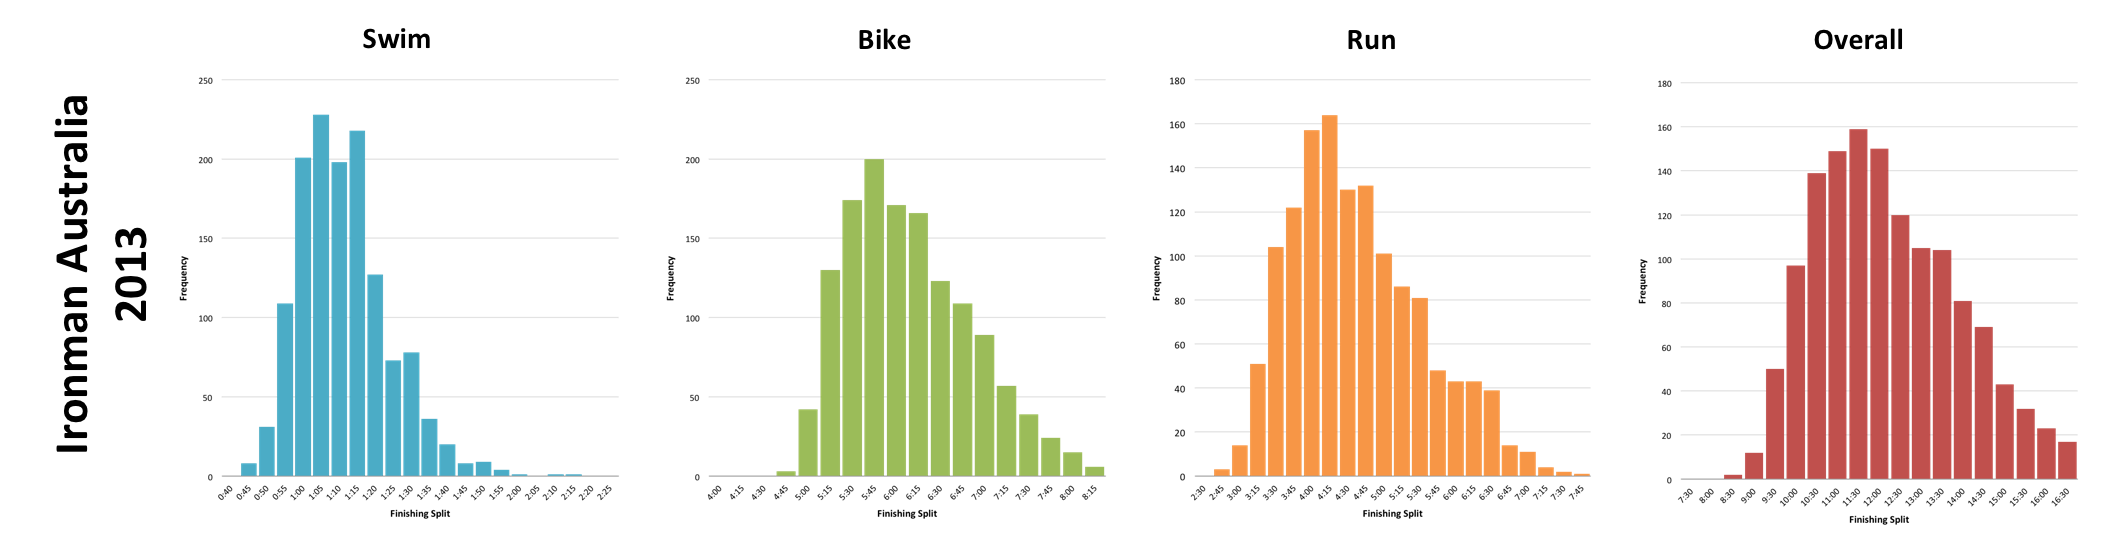
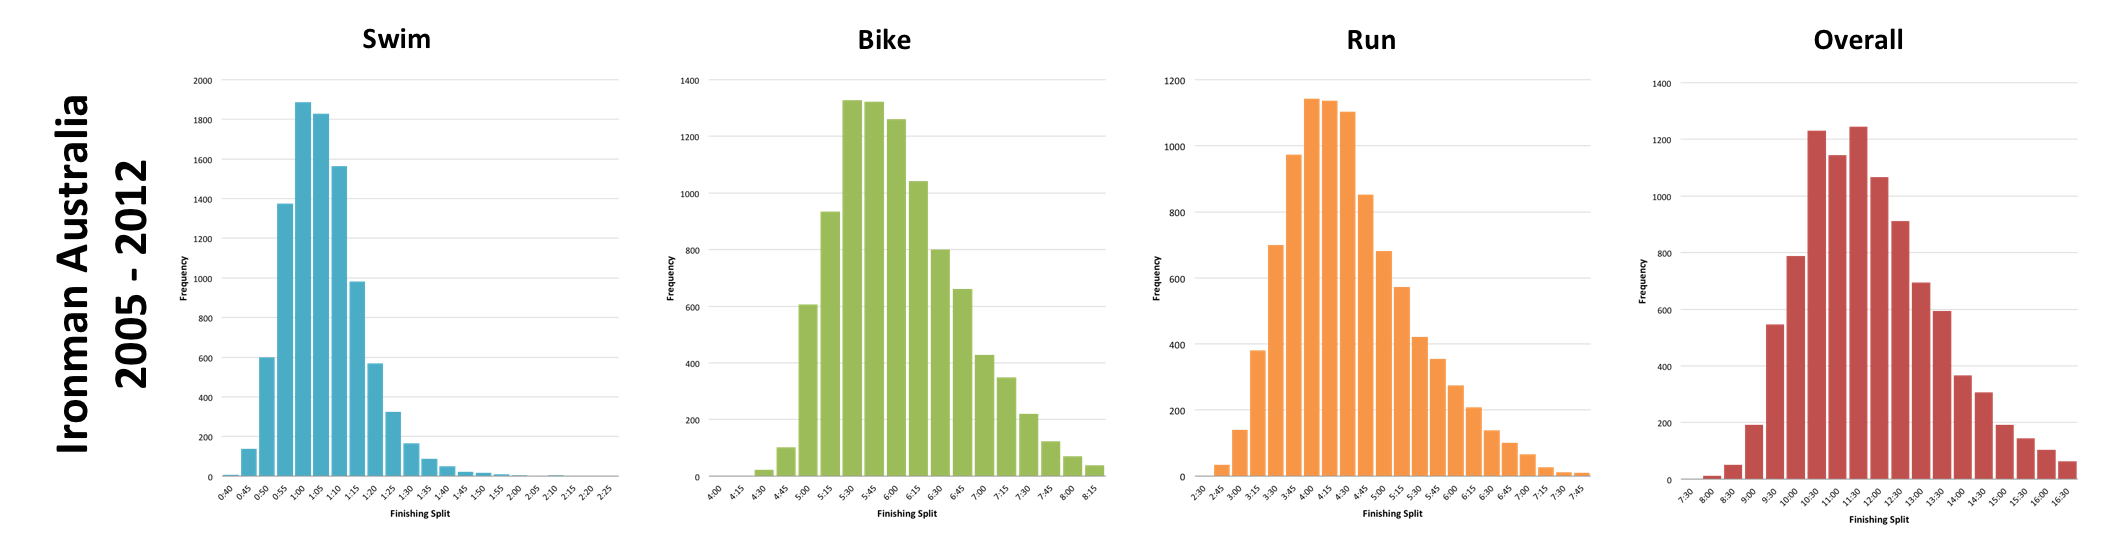
The distribution of splits certainly supports this view. Perhaps there is a slight bulge to the right hand side of the graph and a few more athletes in the slower. Naturally there are variances between years, but none that appear so significant as to question events at this year’s race. Of course splits are determined both by course conditions and the athletes present on the day, we can take a closer look at the athletes by considering the average splits in each age division below.
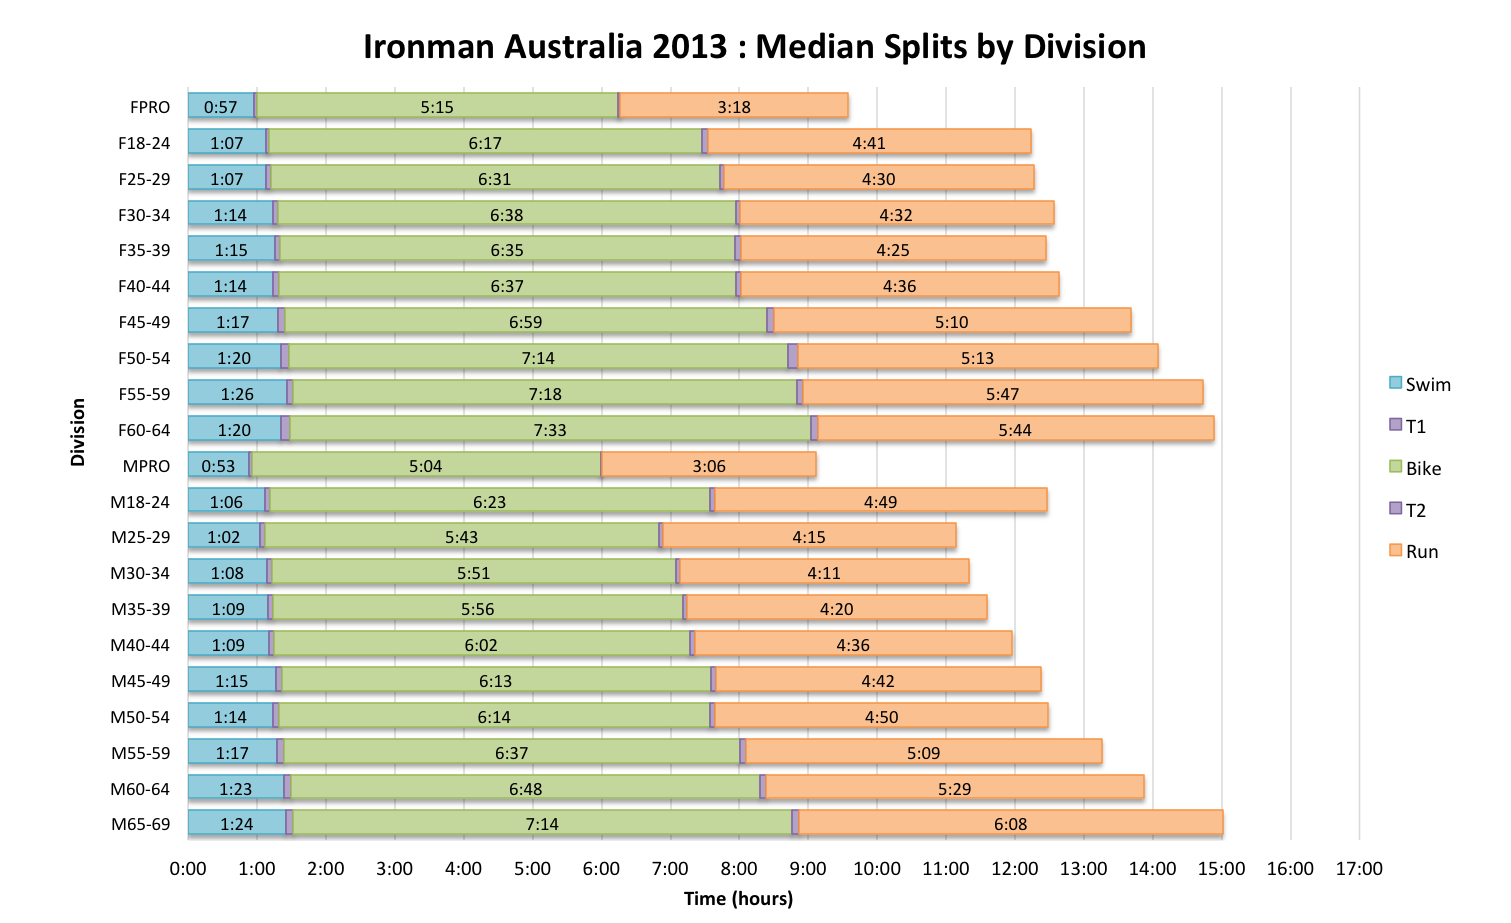
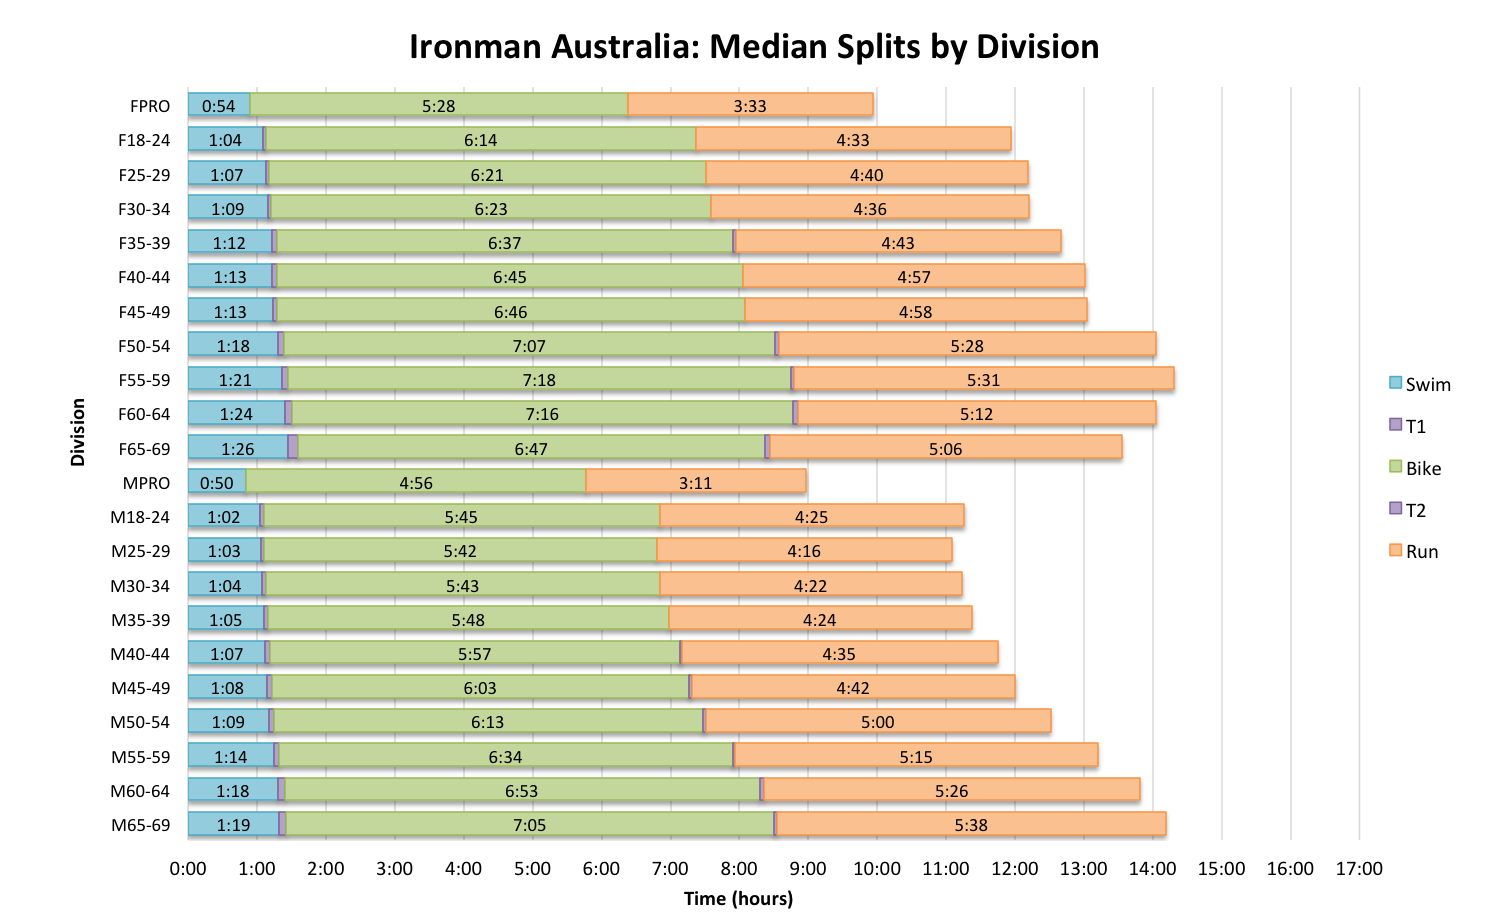
Again we have variances, I can never eliminate the influence of conditions and each year brings a different mix of athletes to the start line. Perhaps there are splits that hint at marginally slower bike times, but the pattern is weak and indistinct. My conclusion would be that this was a very typical race day in Port Macquarie.
Usually I can only speculate on Kona qualifiers by estimating slot distributions, the WTC makes little noise about those who qualify for their headline race. Not so in Port Macquarie, Ironman Australia provides a list of all those who accepted a slot enabling me to examine both slot allocation and roll down.
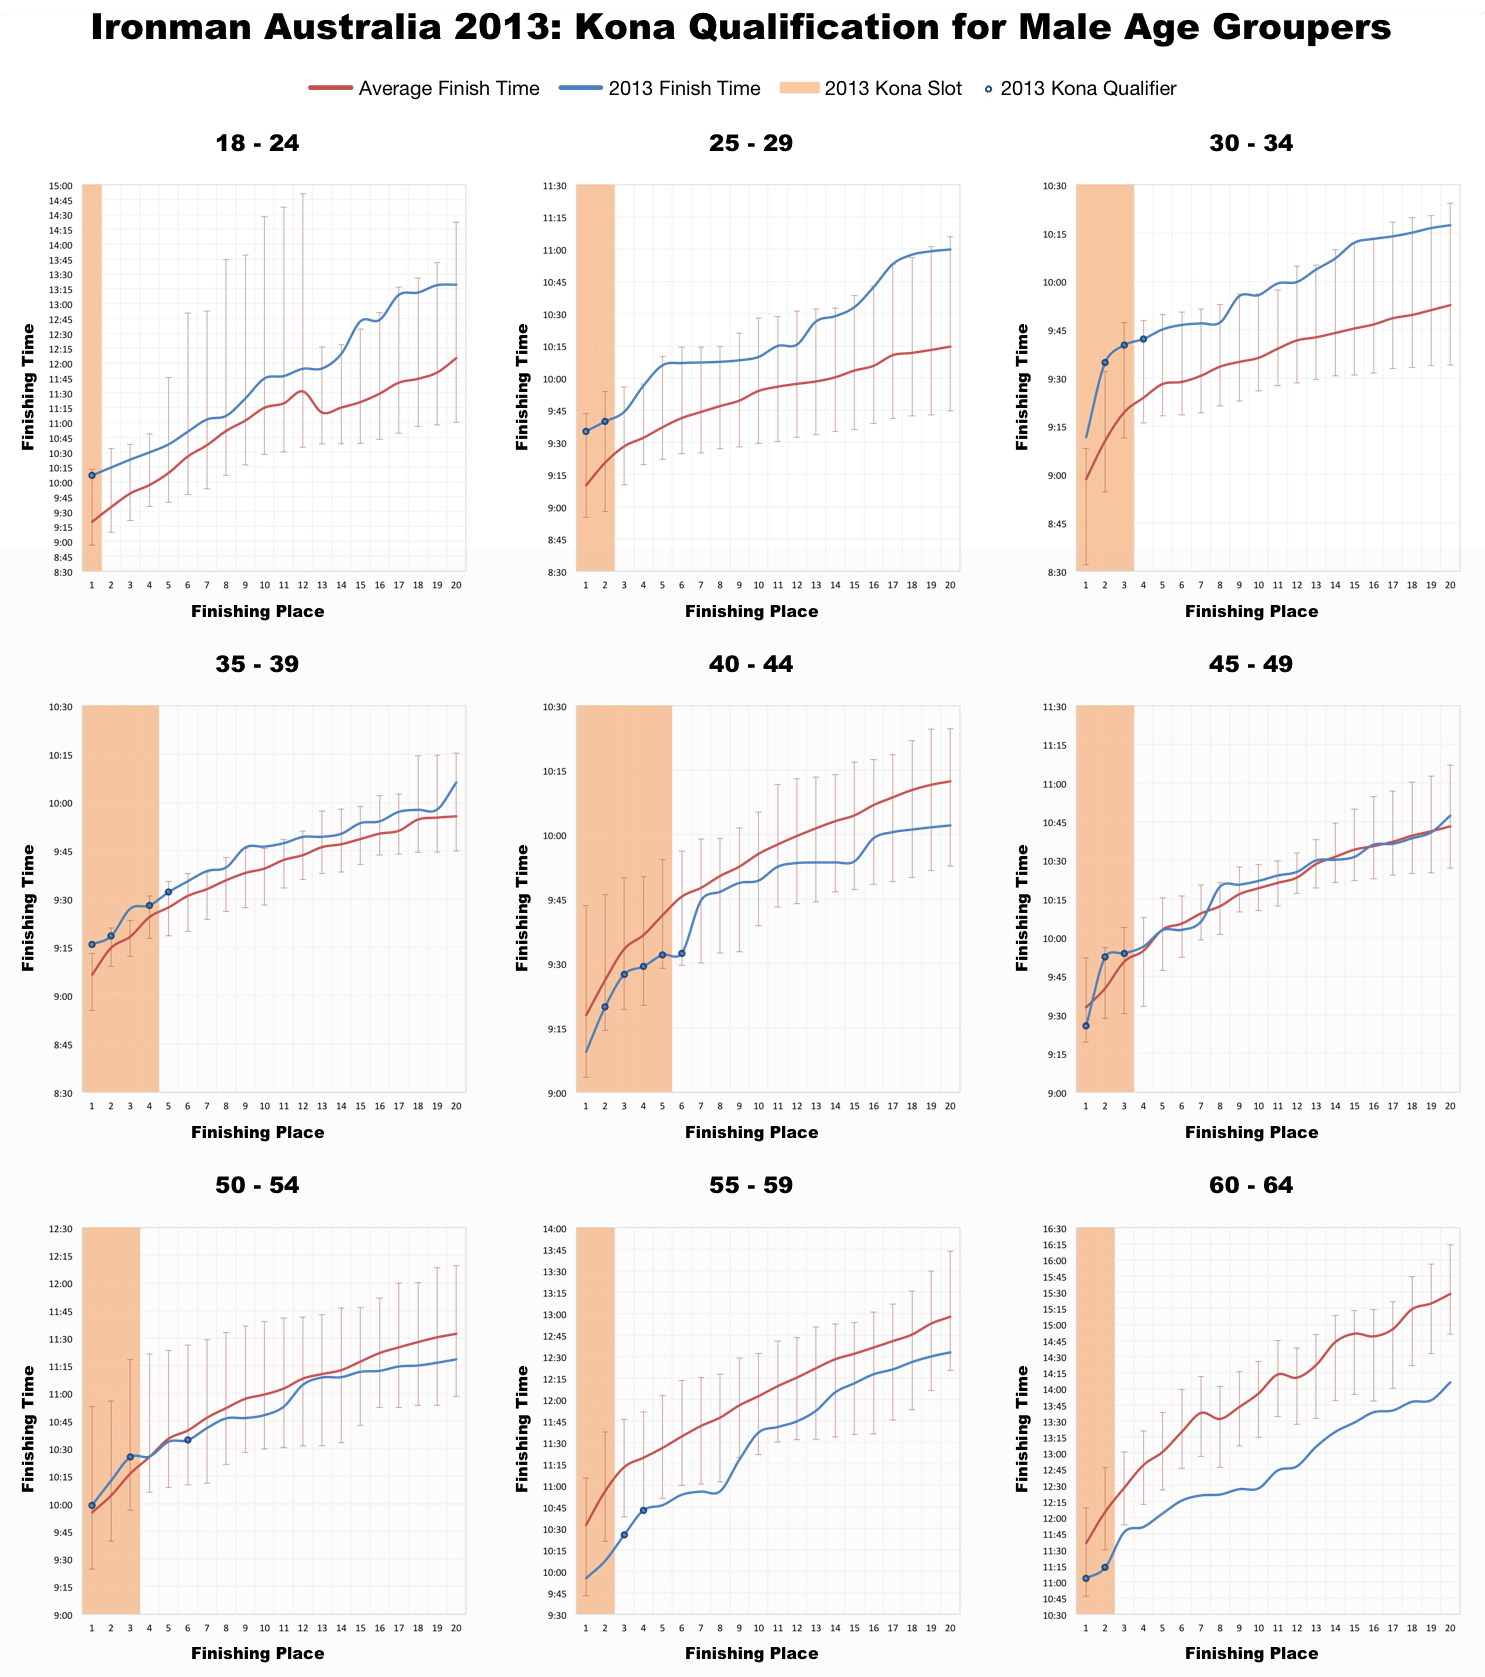
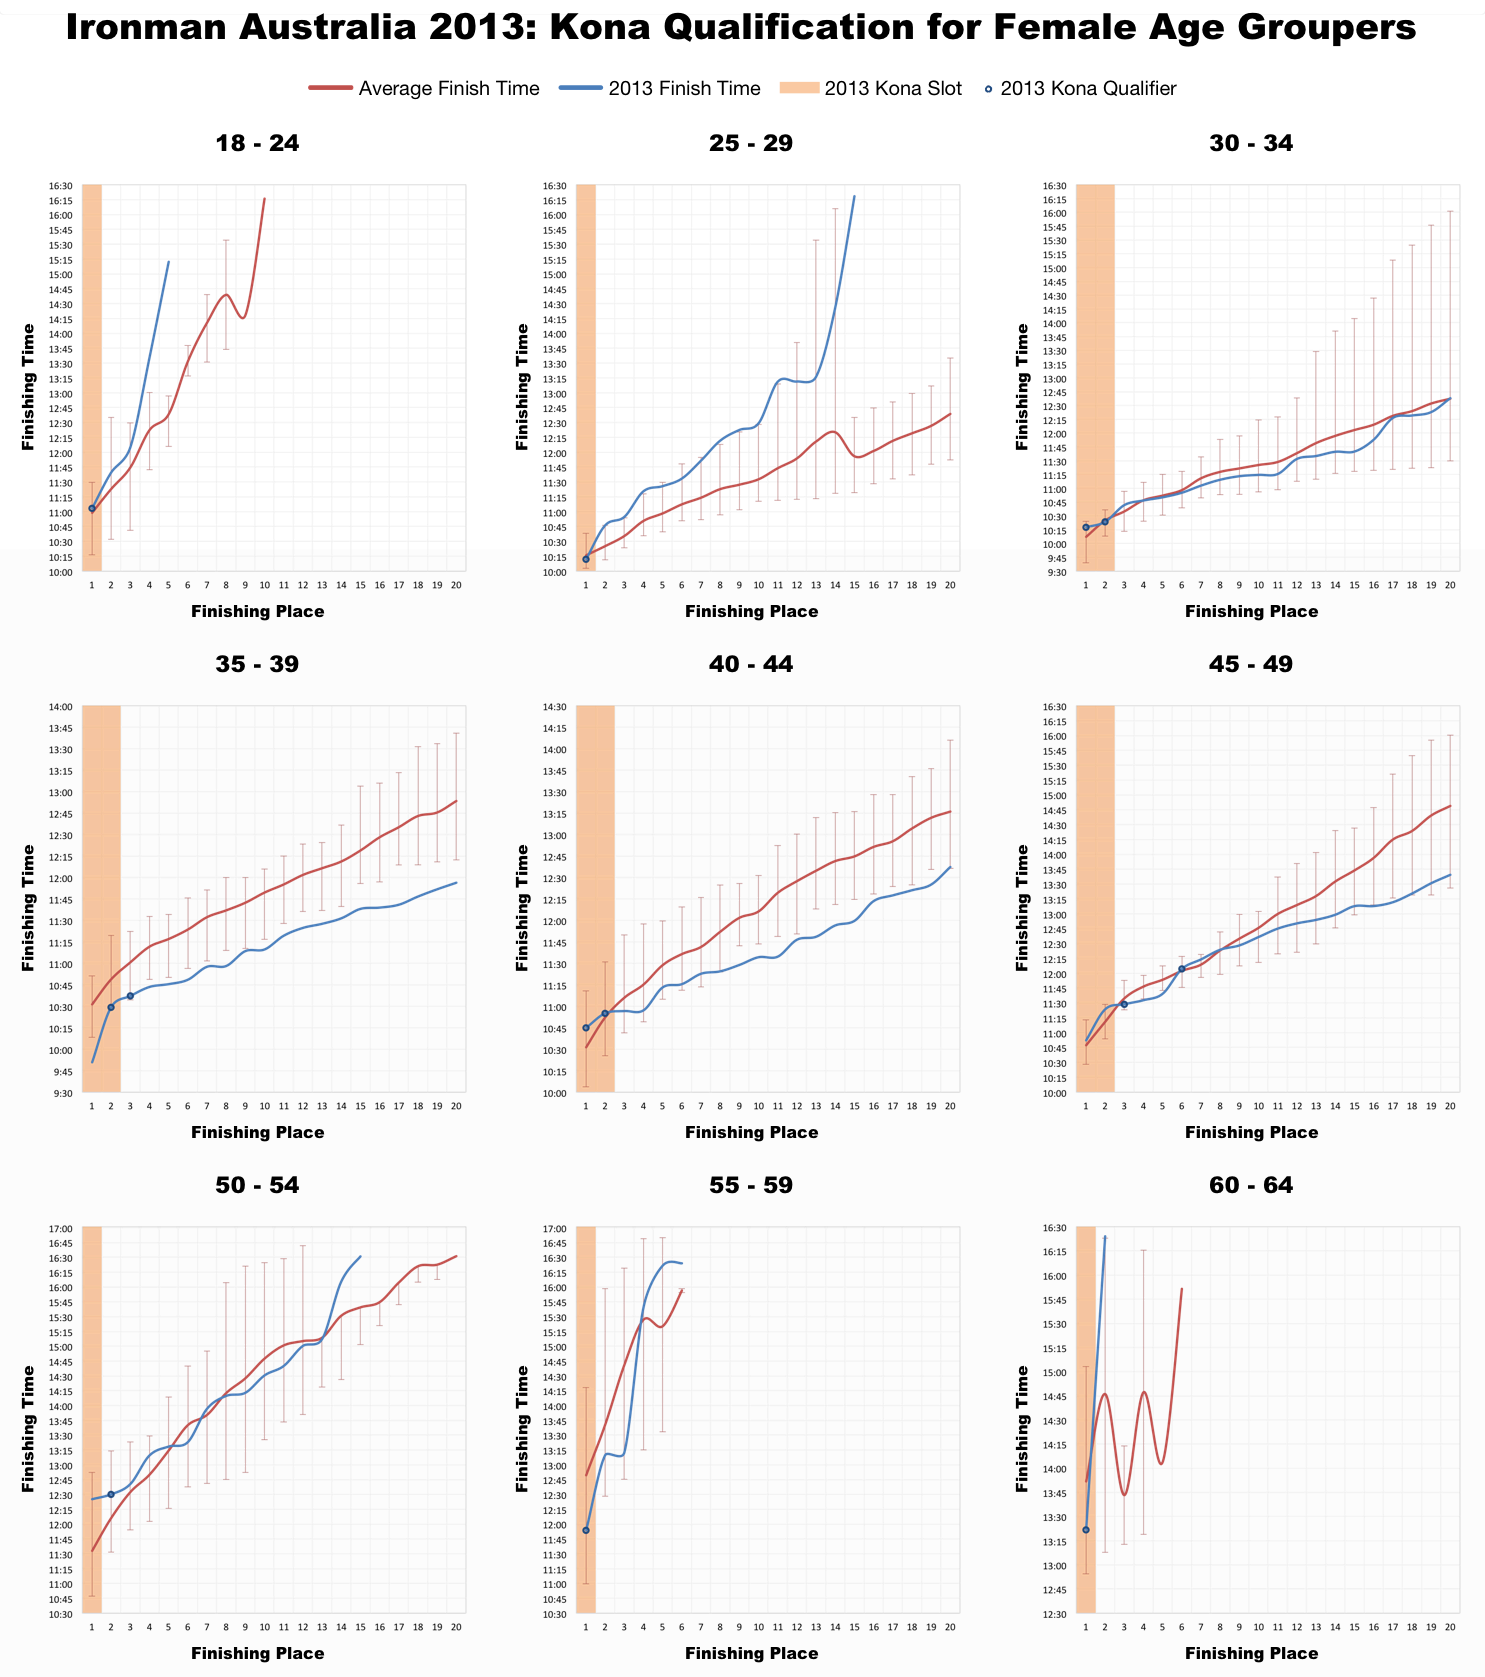
Again we see a mix of performances, some age groups slower than previous averages and some faster, but no consistent pattern indicative of an unusual race day. Historical results were a reasonable indicator of the kind of performance needed to qualify on race day, better than average being the safe bet. There are a handful of roll downs opening up slots to those further back in the field, but by and large you needed to place to qualify. Looking back at results from Melbourne while times may be faster there, a mix of competitive field with a fast (short) course, the presence of 100 slots opened up qualification opportunities more widely. That said neither race represents an easy opportunity to qualify.
For those interested I have added the full results and splits from Ironman Australia 2013 to Google Docs in a more useful spreadsheet form. Ironman Cairns will bring the Australian Ironman season to a close in June and will enable me to produce a more complete picture of the the qualification process Down Under.


