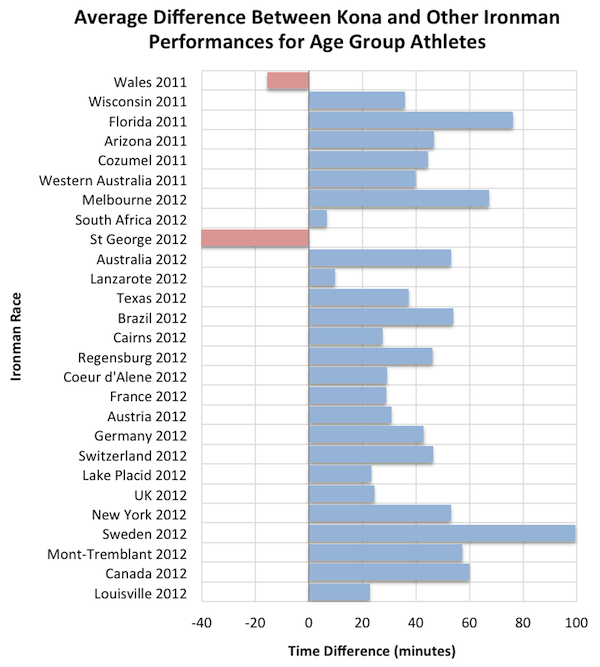
A common question among first time Kona qualifiers is how finish times at the World Champs compare to qualifying times. It’s not an easy question to answer as conditions at both the qualifier and in Hawaii will hugely influence the results. However, comparing Kona times with athletes’ results during the qualifying season can, at least, offer an idea as to the differences. I tried this approach for the 2012 World Champs back in January and concluded that a typical age group qualifier can expect to swim between 5 to 10 minutes slower, bike 10 to 30 minutes slower and run 10 to 25 minutes slower in Hawaii.
How does this year compare?
| Swim | Bike | Run | Overall | |
|---|---|---|---|---|
| Wales 2012 | 00:11:55 | -00:37:10 | 00:19:21 | -00:09:50 |
| Wisconsin 2012 | 00:04:00 | -00:05:38 | 00:25:39 | 00:23:01 |
| World Championship 2012 | -00:02:30 | -00:16:02 | -00:02:04 | -00:20:37 |
| Florida 2012 | 00:03:54 | 00:25:52 | 00:12:13 | 00:42:15 |
| Arizona 2012 | 00:02:57 | 00:20:33 | 00:22:09 | 00:46:46 |
| Cozumel 2012 | -00:02:34 | 00:07:00 | -00:00:22 | 00:05:54 |
| Western Australia 2012 | 00:06:21 | 00:08:07 | 00:06:03 | 00:21:50 |
| New Zealand 2013 | 00:07:59 | 00:03:45 | 00:07:22 | 00:19:47 |
| Melbourne 2013 | 00:41:28 | 00:11:29 | 00:20:25 | 01:15:42 |
| Los Cabos 2013 | 00:02:56 | -00:13:36 | -00:06:18 | -00:15:19 |
| South Africa 2013 | 00:02:27 | 00:02:51 | 00:11:29 | 00:17:56 |
| Australia 2013 | 00:05:18 | -00:01:18 | 00:30:08 | 00:36:42 |
| Texas 2013 | -00:01:48 | 00:12:41 | -00:12:03 | -00:02:24 |
| Lanzarote 2013 | 00:07:45 | -00:38:34 | 00:13:08 | -00:19:52 |
| Brazil 2013 | 00:04:03 | 00:22:31 | 00:28:26 | 00:43:37 |
| Cairns 2013 | 00:02:52 | 00:05:44 | 00:06:43 | 00:15:38 |
| Austria 2013 | 00:10:37 | 00:12:40 | 00:19:43 | 00:43:42 |
| Coeur d’Alene 2013 | 00:03:11 | -00:00:35 | 00:22:04 | 00:25:53 |
| France 2013 | 00:07:38 | -00:04:25 | 00:15:00 | 00:14:38 |
| Frankfurt 2013 | 00:08:18 | 00:07:20 | 00:12:42 | 00:29:58 |
| UK 2013 | 00:08:59 | -00:17:22 | 00:24:20 | 00:17:33 |
| Lake Placid 2013 | 00:05:54 | -00:05:16 | 00:12:04 | 00:17:42 |
| Switzerland 2013 | -00:04:57 | -00:03:04 | 00:04:23 | -00:01:34 |
| Canada 2013 | 00:04:15 | -00:00:12 | 00:20:11 | 00:25:52 |
| Mont-Tremblant 2013 | 00:04:40 | 00:06:03 | 00:21:09 | 00:32:54 |
| Copenhagen 2013 | 00:09:40 | 00:21:16 | 00:23:26 | 00:56:29 |
| Sweden 2013 | 00:05:09 | 00:15:12 | 00:23:20 | 00:46:34 |
| Louisville 2013 | 00:06:58 | 00:14:03 | 00:08:34 | 00:22:35 |
| Average | 00:05:59 | 00:01:55 | 00:13:54 | 00:21:54 |
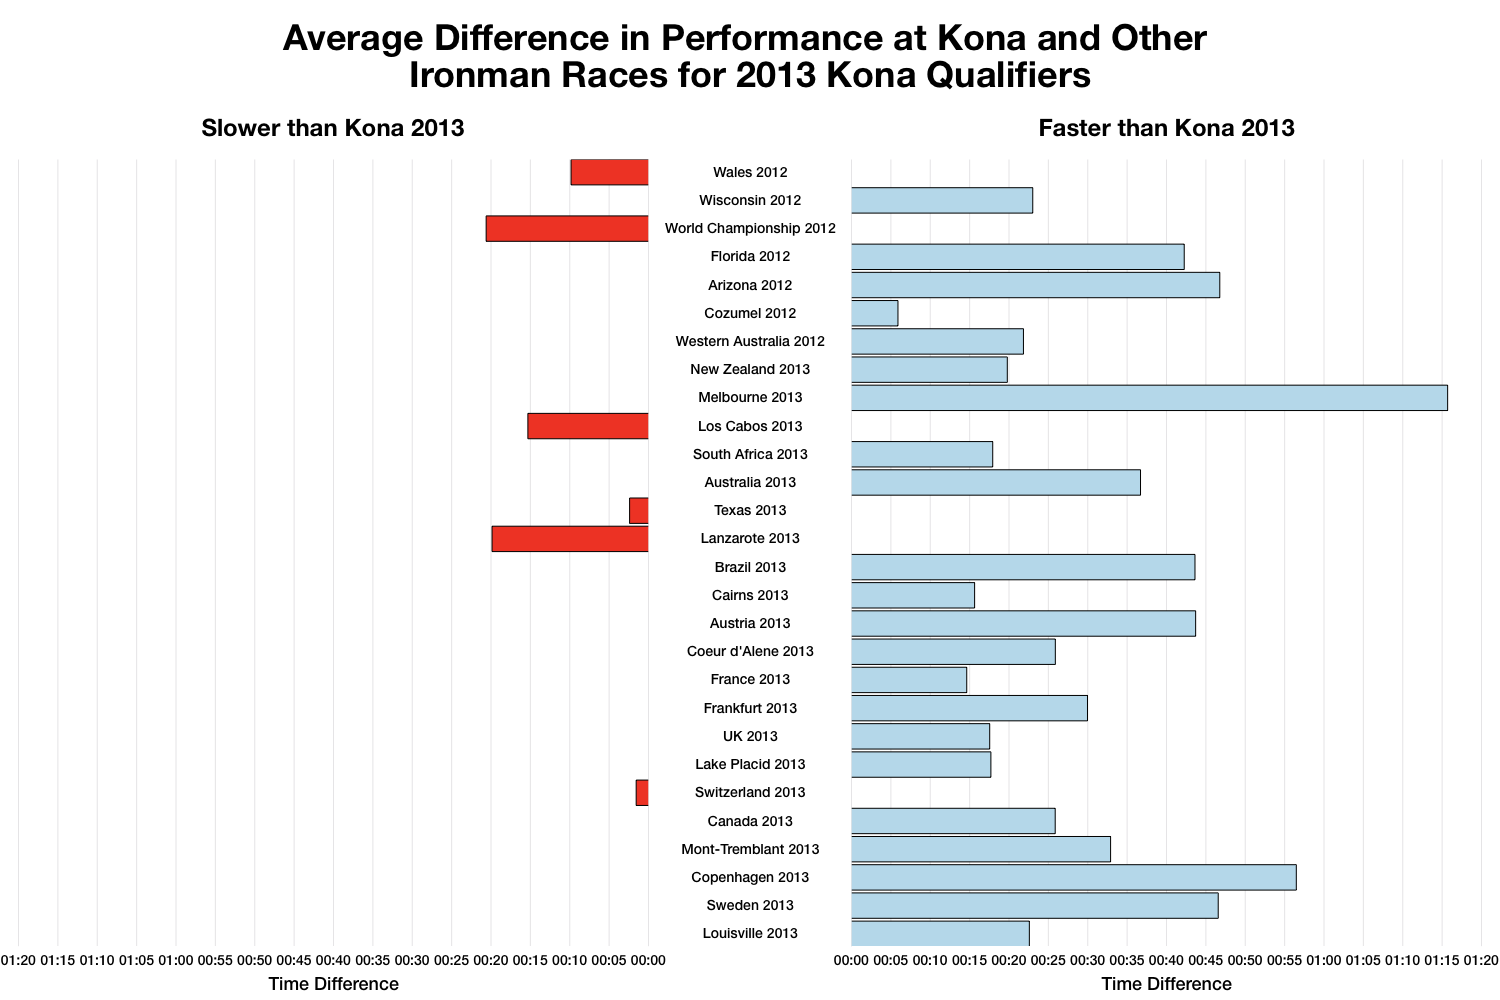
The chart above presents the average difference between qualifiers’ times at a given race and their times in Kona. For example on average qualifiers who raced Ironman France 2013 finished 14 minutes slower when they raced in Hawaii. The table presents the same information with the additional details of individual splits. Negative times mean a faster split in Hawaii, positive times represent a faster split at the other race. My conclusion for the 2012 race was that a qualifier could expect to be 37 minutes slower in Kona, this year the same approach suggests the difference is only 21 minutes.
There are many similarities with the 2012 chart above, but this year a few more races are slower and the degree to which races are faster is reduced. Why? As observed yesterday, results in Kona were fast this year and so the difference between race times elsewhere and in Hawaii tends to be smaller. There are a few outliers, Melbourne stands out due to its shortened swim, double that swim and it will fall in line with other fast courses.
Of note in this year’s comparison is the inclusion of results from the 2012 Ironman World Championship. If we look at the finish times for those who raced in Kona both this year and last then we find that on average they were 20 minutes faster this time with the bike split the biggest contributor to that. Again this falls inline with yesterday’s analysis where the bike showed the most significant change in results over previous years.
So the answer to the question of how qualifying time differs from Kona time is different to last. In 2012 there was a 37 minute difference on average between Kona times and other races, this year a faster bike means the difference has reduced to around 22 minutes. As I said at the start conditions play a major role both in Kona and at the other events. We know for example that conditions in Los Cabos were particularly tough and it’s not surprising to see it among the races slower than Hawaii. Kona is a challenging race and athletes are generally slower there, how much very much depends on their preparations and how race day pans out.


