It’s over a year since I last published a review of one of my athlete’s performances. Which is not to say I’m lacking publishable performances – we’ve seen plenty of PBs in the Coach Cox camp this year – I’m just reticent to share! But now we’re in race season and I’m handling race files on a weekly basis I thought it was time I got back into the habit, starting with the PB performance of one of my athletes at Ironman Austria.
I’ve been working with Simon since he came on my Lanzarote training camp earlier this year. His goal was to go sub-10 in Ironman which, to be honest, I felt he was probably already capable of. When he grabbed a last minute spot at Austria it seemed pretty much guaranteed, although he tried to give me a scare by crashing 3 weeks before the race. Despite this he managed to convincingly break the 10 hour mark with a 9:35:21 finish, splits as follows.
| Simon Barry | David Corredor Panadero | Ivan Raña | ||||
|---|---|---|---|---|---|---|
| 35th M30-34 | 1st M30-34 | 1st MPRO | ||||
| Split | Time | Place (All/Gen/AG) | Time | Place (All/Gen/AG) | Time | Place (All/Gen/AG) |
| Swim | 1:01:40 | 393 / 360 / 61 | 0:55:12 | 98 / 90 / 15 | 0:44:36 | 7 / 7 / 7 |
| T1 | 0:05:07 | 392 / 355 / 64 | 0:03:55 | 83 / 74 / 14 | 0:02:37 | 6 / 6 / 6 |
| Bike 1 km | 0:00:40 | 392 / 355 / 64 | 0:00:32 | 81 / 73 / 14 | 0:00:23 | 6 / 6 / 6 |
| Bike 25.2 km | 0:37:41 | 359 / 333 / 63 | 0:36:29 | 78 / 72 / 14 | 0:32:05 | 2 / 2 / 2 |
| Bike 35.5 km | 0:19:05 | 360 / 335 / 66 | 0:17:33 | 68 / 63 / 12 | 0:15:37 | 2 / 2 / 2 |
| Bike 55.4 km | 0:32:03 | 359 / 337 / 66 | 0:30:27 | 67 / 62 / 12 | 0:26:51 | 2 / 2 / 2 |
| Bike 64.5 km | 0:18:16 | 376 / 354 / 71 | 0:17:08 | 63 / 59 / 11 | 0:14:34 | 2 / 2 / 2 |
| Bike 92 km | 0:45:23 | 184 / 178 / 31 | 0:43:39 | 54 / 49 / 7 | 0:39:00 | 2 / 2 / 2 |
| Bike 112.4 km | 0:34:40 | 328 / 315 / 63 | 0:32:20 | 59 / 55 / 10 | 0:28:10 | 1 / 1 / 1 |
| Bike 122.7 km | 0:19:09 | 322 / 309 / 63 | 0:17:39 | 46 / 44 / 6 | 0:16:23 | 1 / 1 / 1 |
| Bike 142.6 km | 0:32:38 | 303 / 292 / 60 | 0:29:40 | 48 / 45 / 6 | 0:26:55 | 1 / 1 / 1 |
| Bike 151.7 km | 0:18:40 | 295 / 285 / 59 | 0:16:36 | 41 / 39 / 5 | 0:15:44 | 1 / 1 / 1 |
| Bike 180 km | 0:47:48 | 282 / 273 / 61 | 0:42:26 | 39 / 37 / 5 | 0:40:15 | 1 / 1 / 1 |
| Bike | 5:06:03 | 282 / 273 / 61 | 4:44:29 | 39 / 37 / 5 | 4:15:57 | 1 / 1 / 1 |
| T2 | 0:03:19 | 269 / 260 / 61 | 0:03:00 | 44 / 42 / 5 | 0:01:50 | 1 / 1 / 1 |
| Run 1.5 km | 0:06:31 | 261 / 252 / 60 | 0:05:54 | 41 / 39 / 5 | 0:05:23 | 1 / 1 / 1 |
| Run 2.4 km | 0:04:02 | 260 / 250 / 61 | 0:04:01 | 43 / 41 / 5 | 0:03:21 | 1 / 1 / 1 |
| Run 7.5 km | 0:23:13 | 246 / 236 / 58 | 0:20:28 | 31 / 30 / 2 | 0:19:30 | 1 / 1 / 1 |
| Run 12.7 km | 0:23:28 | 234 / 223 / 51 | 0:20:41 | 30 / 29 / 2 | 0:19:27 | 1 / 1 / 1 |
| Run 17 km | 0:20:15 | 227 / 216 / 47 | 0:17:13 | 28 / 28 / 2 | 0:16:20 | 1 / 1 / 1 |
| Run 21 km | 0:21:10 | 221 / 210 / 46 | 0:17:29 | 25 / 25 / 1 | 0:17:06 | 1 / 1 / 1 |
| Run 22 km | 0:04:18 | 217 / 206 / 45 | 0:03:45 | 25 / 25 / 1 | 0:03:36 | 1 / 1 / 1 |
| Run 27 km | 0:25:06 | 196 / 186 / 40 | 0:21:17 | 22 / 22 / 1 | 0:19:55 | 1 / 1 / 1 |
| Run 32.3 km | 0:24:44 | 187 / 177 / 39 | 0:20:58 | 20 / 20 / 1 | 0:20:37 | 1 / 1 / 1 |
| Run 36.5 km | 0:20:16 | 178 / 168 / 37 | 0:18:07 | 20 / 20 / 1 | 0:16:37 | 1 / 1 / 1 |
| Run 40.7 km | 0:20:30 | 172 / 162 / 35 | 0:18:29 | 19 / 19 / 1 | 0:16:28 | 1 / 1 / 1 |
| Run 41.6 km | 0:04:17 | 171 / 161 / 35 | 0:04:07 | 18 / 18 / 1 | 0:03:46 | 1 / 1 / 1 |
| Run 42.2 km | 0:01:22 | 171 / 161 / 35 | 0:01:31 | 19 / 19 / 1 | 0:01:37 | 1 / 1 / 1 |
| Run | 3:19:12 | 171 / 161 / 35 | 2:54:00 | 19 / 19 / 1 | 2:43:43 | 1 / 1 / 1 |
| Overall | 9:35:21 | 171 / 161 / 35 | 8:40:36 | 19 / 19 / 1 | 7:48:43 | 1 / 1 / 1 |
Pleased as I was with the result I was also interested in the performance behind it and what we might learn before Simon next races (Ironman Switzerland in just over 2 weeks). So once the data had been uploaded to TrainingPeaks I put it through my analysis tools to take a better look.
Based on a recent FTP test and a few other performances I’d given Simon a power cap of 236W to work to in accordance with my recent advice on racing with power. Unusually he wanted to ride a bit lower, around the 220W mark, to be certain of a good run. While I was clear I felt he could give more, I was also happy that at a 220W average he’d still be able to reach his goal and likely it would work in his favour on the run.
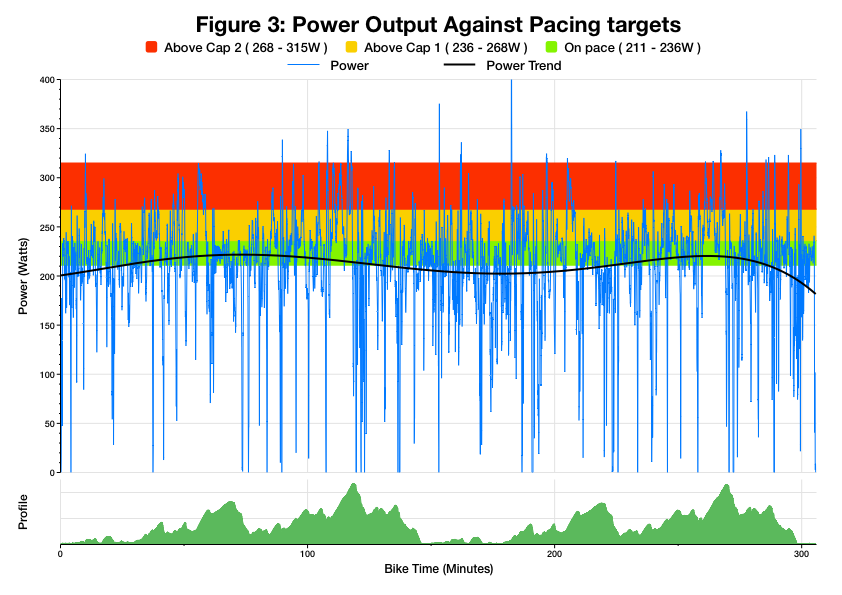
Plotting his power output against his race caps and, as I’d expect with a lower power target, the trend line skims along the bottom of the range of power I’d hope to see. Pleasingly there are few surges that cross FTP and relatively few that cross above the secondary power cap of 268W. This has all the appearances of a very conservative ride with no real degradation in power output over the course of the event. The drop off towards the end reflecting a descent and easing into T2.
The consistency of pacing is good; we can see this if we summarise the race data into 10 minute blocks as in the chart below.
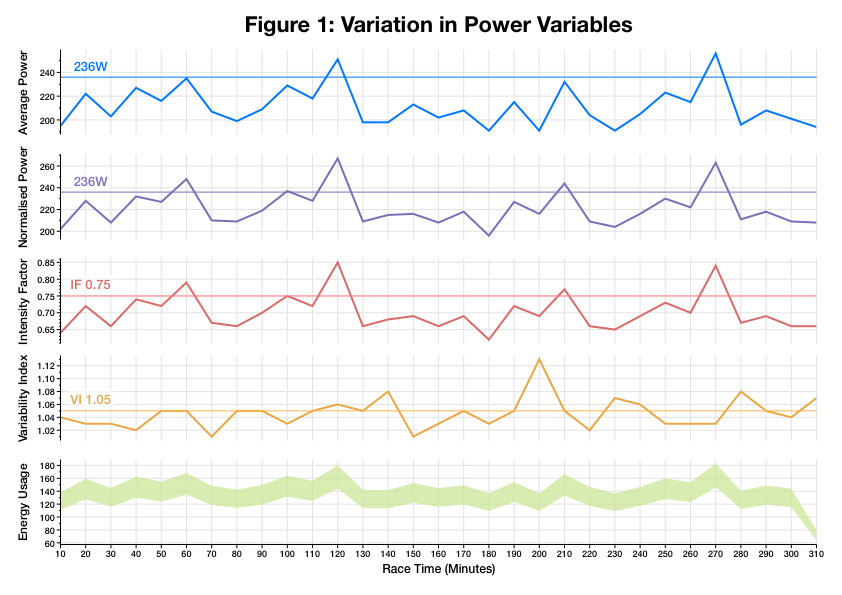
It’s rare that either average or normalised power cross the race cap, it only happens during two or three 10 minute periods of the race. Naturally this means the Intensity Factor rarely cross 0.75 and of more interest from the perspective of consistency the Variability Index rarely crosses 1.05. From an Ironman perspective these are generally all safe values to be racing at.
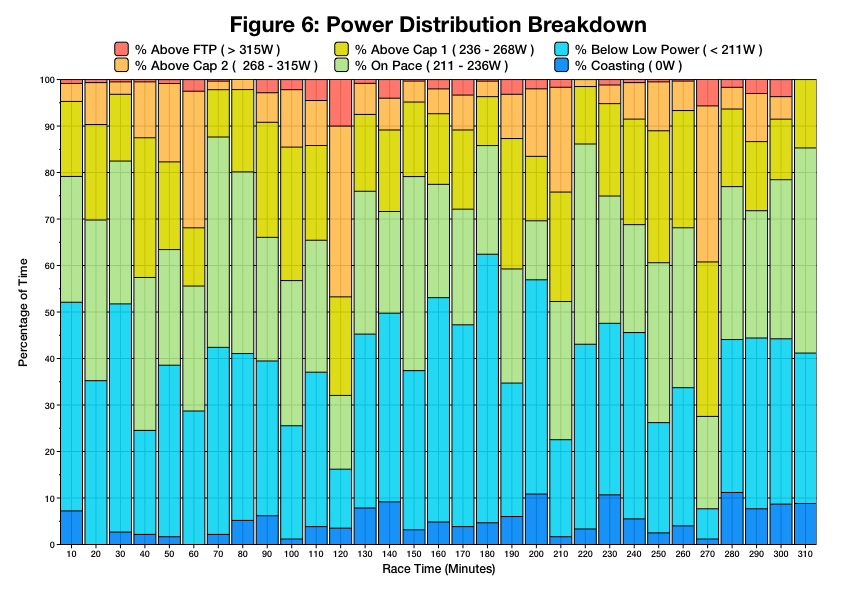
For a little more detail we can look at how much time is spent relative to Simon’s FTP and race caps during each of those 10 minute blocks of the race. Having chosen to ride comfortably below 75% of his FTP there’s a bit more blue in this chart than I’d normally look for, but as importantly there’s plenty of green (on pace) and for the most part relatively little of the orange and red that indicates pushing outside his race guidelines. The distribution of effort in each block is also quite uniform; again pointing to the consistency of the ride.
Of course, the whole point of this ride was to finish the race with a decent run and as the next chart shows it largely seemed to pay off.
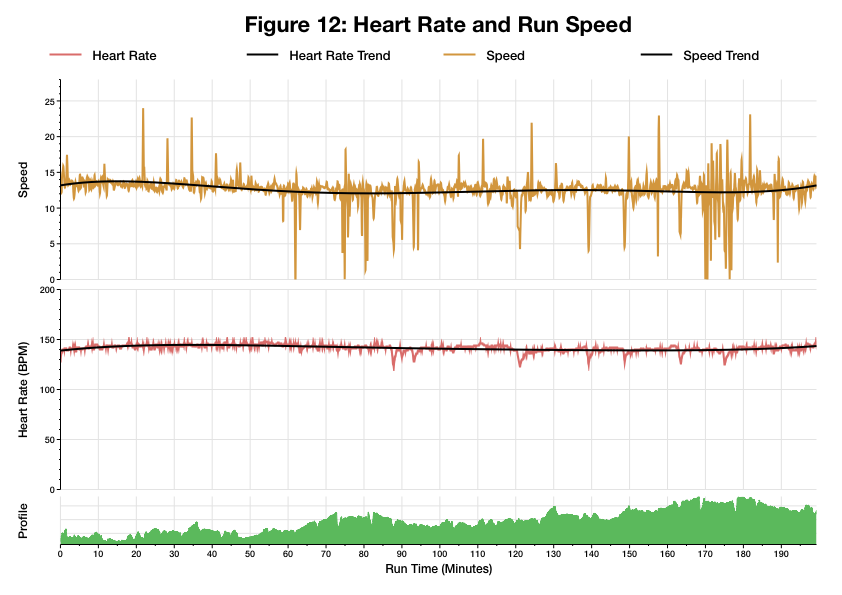
Both heart rate and more importantly run pace are uniform throughout. There is a small drop off in pace on the run and a few walk breaks starting from about 80 minutes in, but these are probably the result of a fuelling error; during the run, up until the point he started to struggle, Simon was only drinking water. Perhaps unsurprisingly by 80 minutes into the run he was pretty low on reserves – a switch to bananas and energy drink helped deal with that and the impact of this mistake proved fairly small.
So, a controlled performance delivered a solid sub-10 result and other than neglecting to eat during the early part of the run there’s little I’d change in Simon’s race. The only tweak we’re making for Switzerland is to adopt a less conservative strategy on the bike. The 236W race cap will remain and Simon will aim to stay below it, but also to ride a little harder. Of course the run may suffer for this, we’ll find out, but having played it safe in Austria we want to start testing the boundaries a little more.
At the end of this month we’ll be able to compare performances and see what impact a more aggressive ride has on his day.
