It’s another big weekend of Ironman racing on the calendar with Ironman Canada, Ironman Switzerland and the race I’m looking at today, Ironman Lake Placid, taking place. Lake Placid is a long standing event on the North American circuit with readily available results going back to 2002. It also doesn’t deviate far from what I’ve come to expect from US Ironman results.
Those who want more detailed statistics for individual age groups can download them at the bottom of this post.
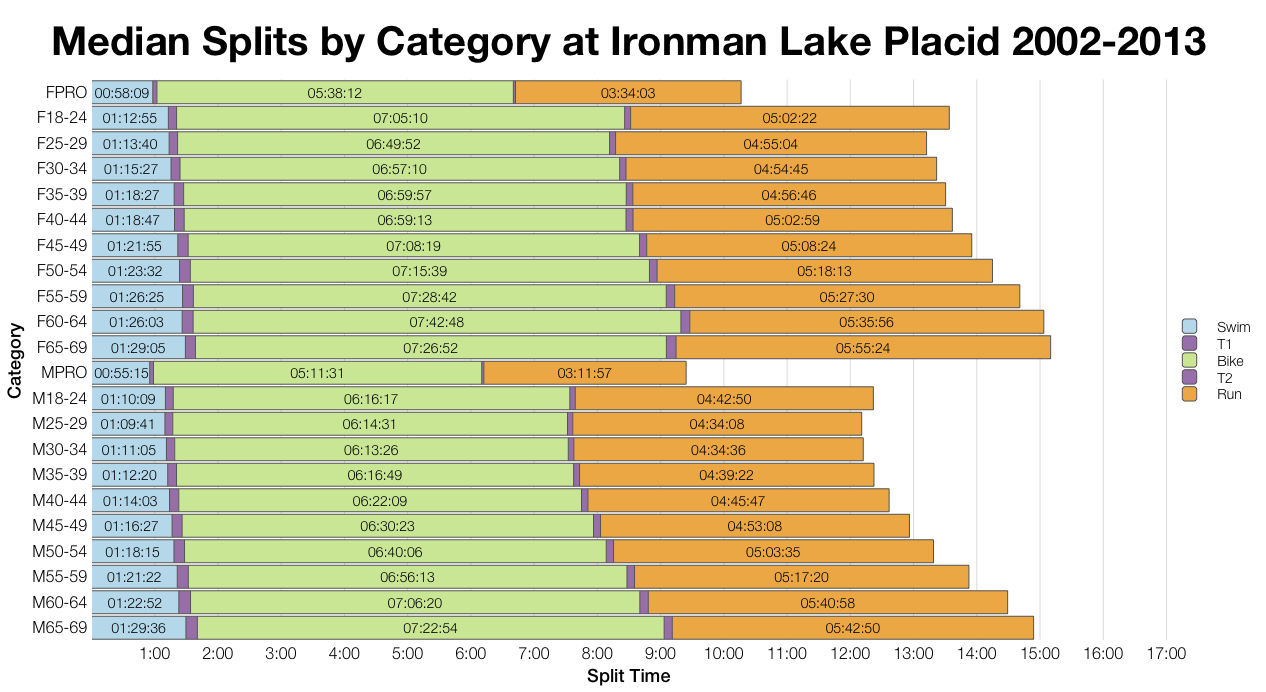
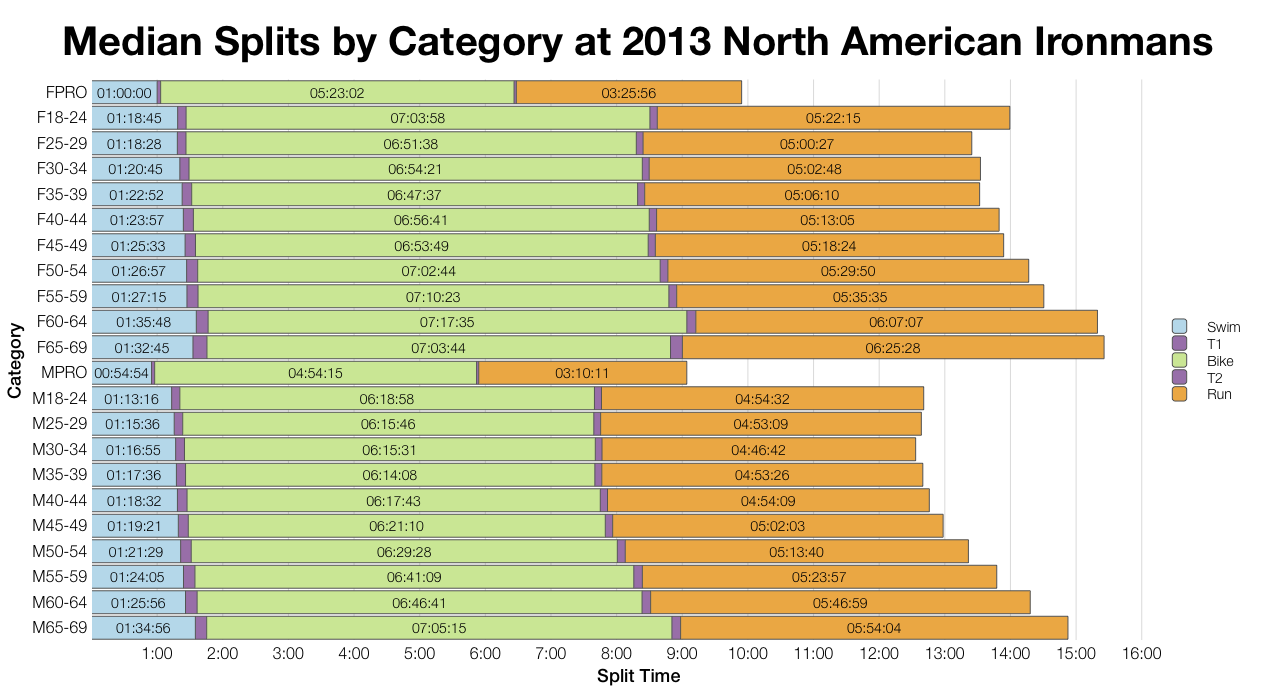
Comparing the medians from a decade of racing in Lake Placid with the aggregated results from all the North American races of 2013 gives some indication of how it stands. Times aren’t too disimilar with the most notable differences coming on the run where Lake Placid trends a little faster. Otherwise in the age group ranks variations are generally small. In contrast professional times at Lake Placid come out a little slower than last year’s North American averages.
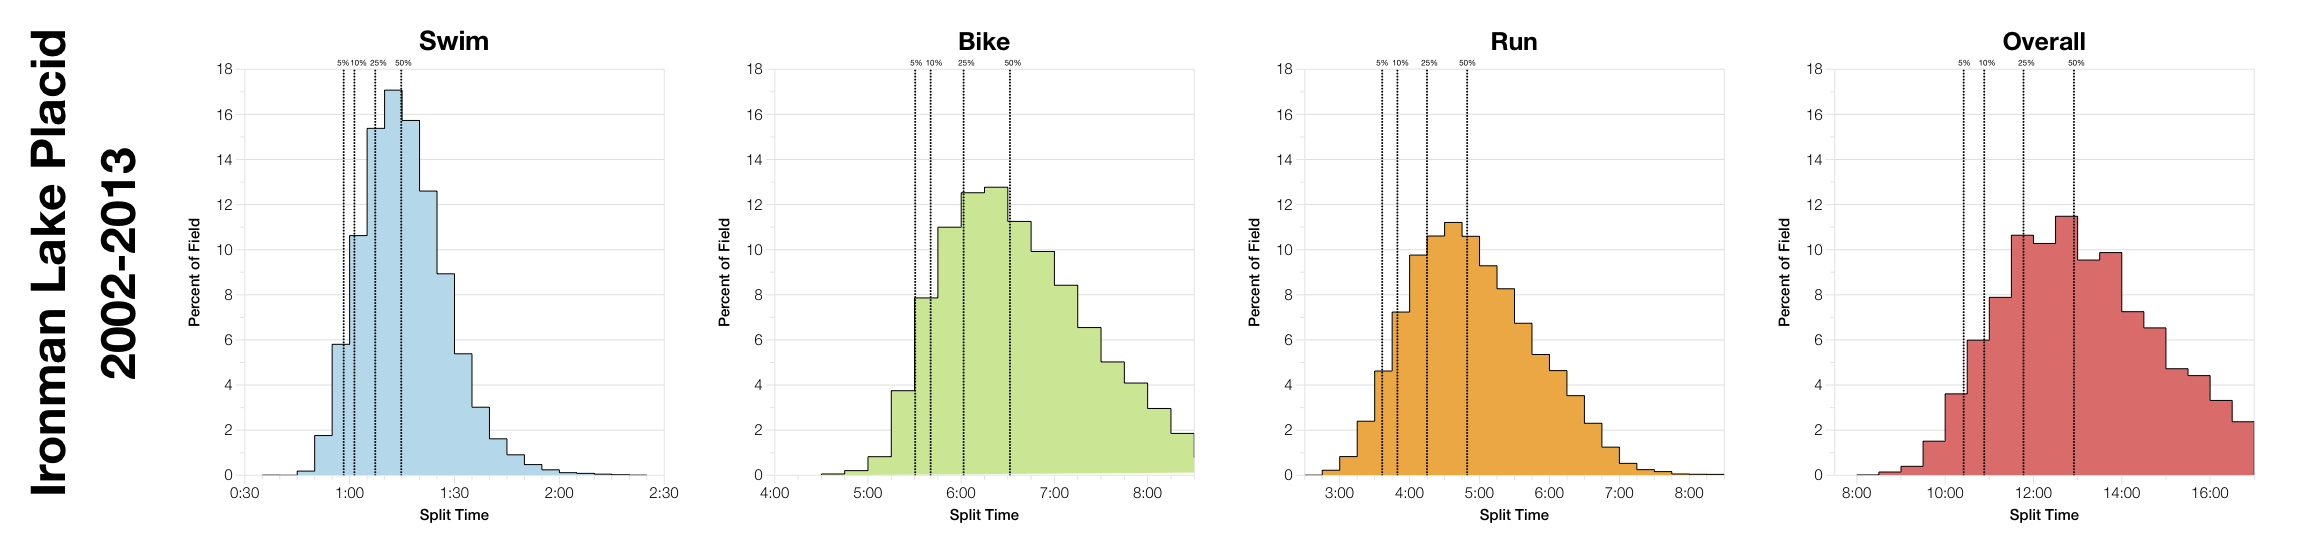
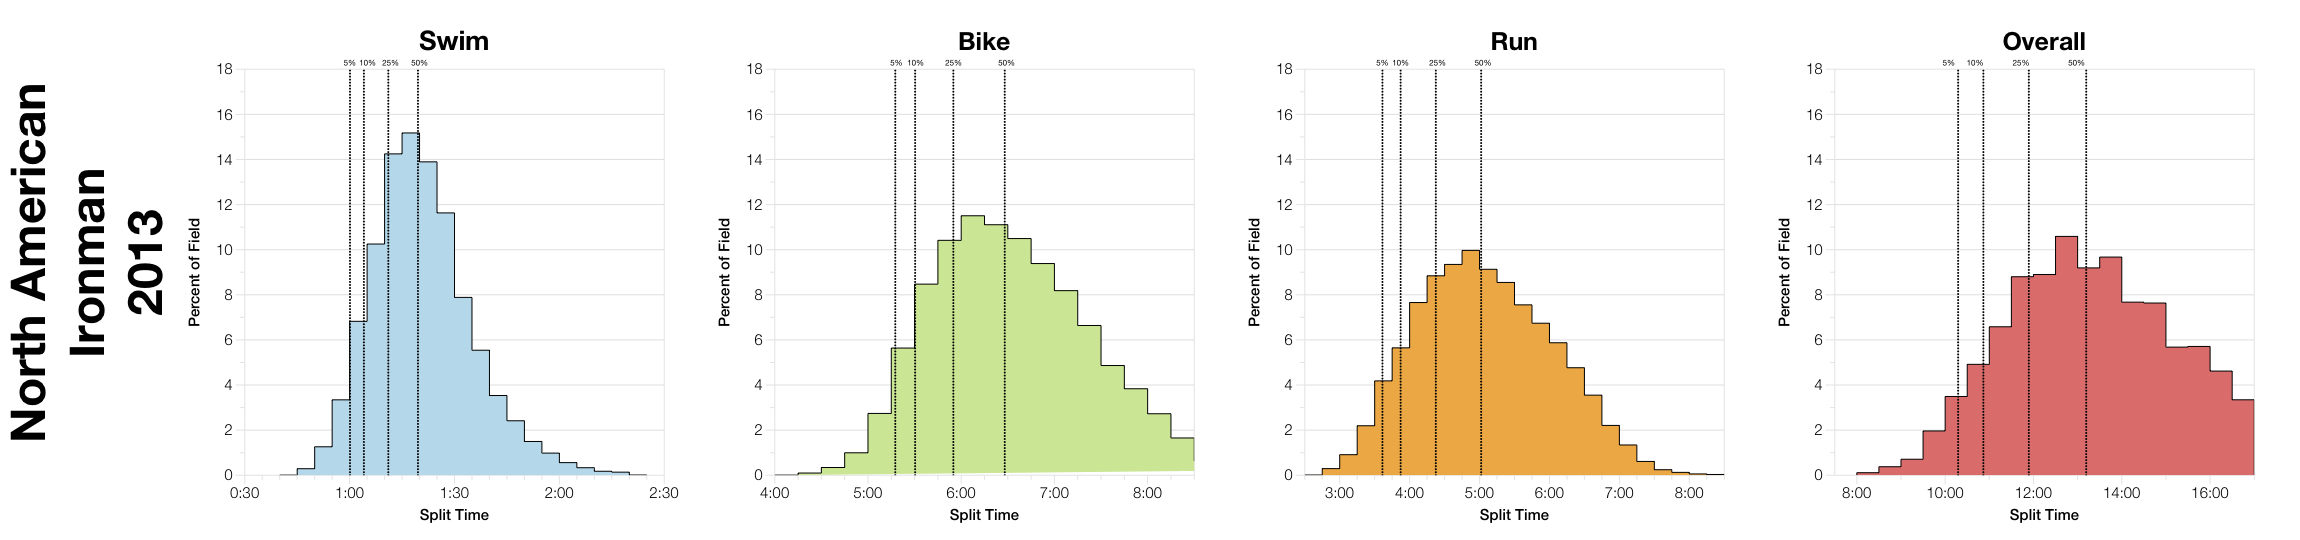
Comparing distributions gives a more detailed picture. Much of it is the same, but we can see how times vary across the front of the field. Swim times in Lake Placid are clearly faster. Bike times, while similar in the middle of the pack, are slower at the front of the pack (5-10% of athletes). Conversely run times are faster in the middle of the pack, but by the front of the pack they are largely the same as the other races. Lake Placid has fewer athletes filling out the tail end of the split distributions, but no additional weight at the front of the pack.
| Number of Athletes | Number of Slots | |
|---|---|---|
| F18-24 | 27 | 1 |
| F25-29 | 60 | 2 |
| F30-34 | 92 | 2 |
| F35-39 | 95 | 2 |
| F40-44 | 170 | 4 |
| F45-49 | 101 | 2 |
| F50-54 | 80 | 2 |
| F55-59 | 37 | 2 |
| F60-64 | 7 | 1 |
| F65-69 | 3 | 1 |
| M18-24 | 43 | 2 |
| M25-29 | 159 | 3 |
| M30-34 | 226 | 4 |
| M35-39 | 304 | 5 |
| M40-44 | 426 | 7 |
| M45-49 | 398 | 7 |
| M50-54 | 246 | 5 |
| M55-59 | 138 | 3 |
| M60-64 | 57 | 2 |
| M65-69 | 15 | 1 |
| M70-74 | 6 | 1 |
| M75-79 | 2 | 1 |
| Total | 2692 | 60 |
The above table contains my predictions for Kona slot allocations based on the start list available on the Ironman Lake Placid website. Actual numbers will likely vary depending on how many actually start. Lake Placid gets 60 slots, 10 more than most other races, otherwise the distribution is typical of Ironman with the biggest group being M40-44.
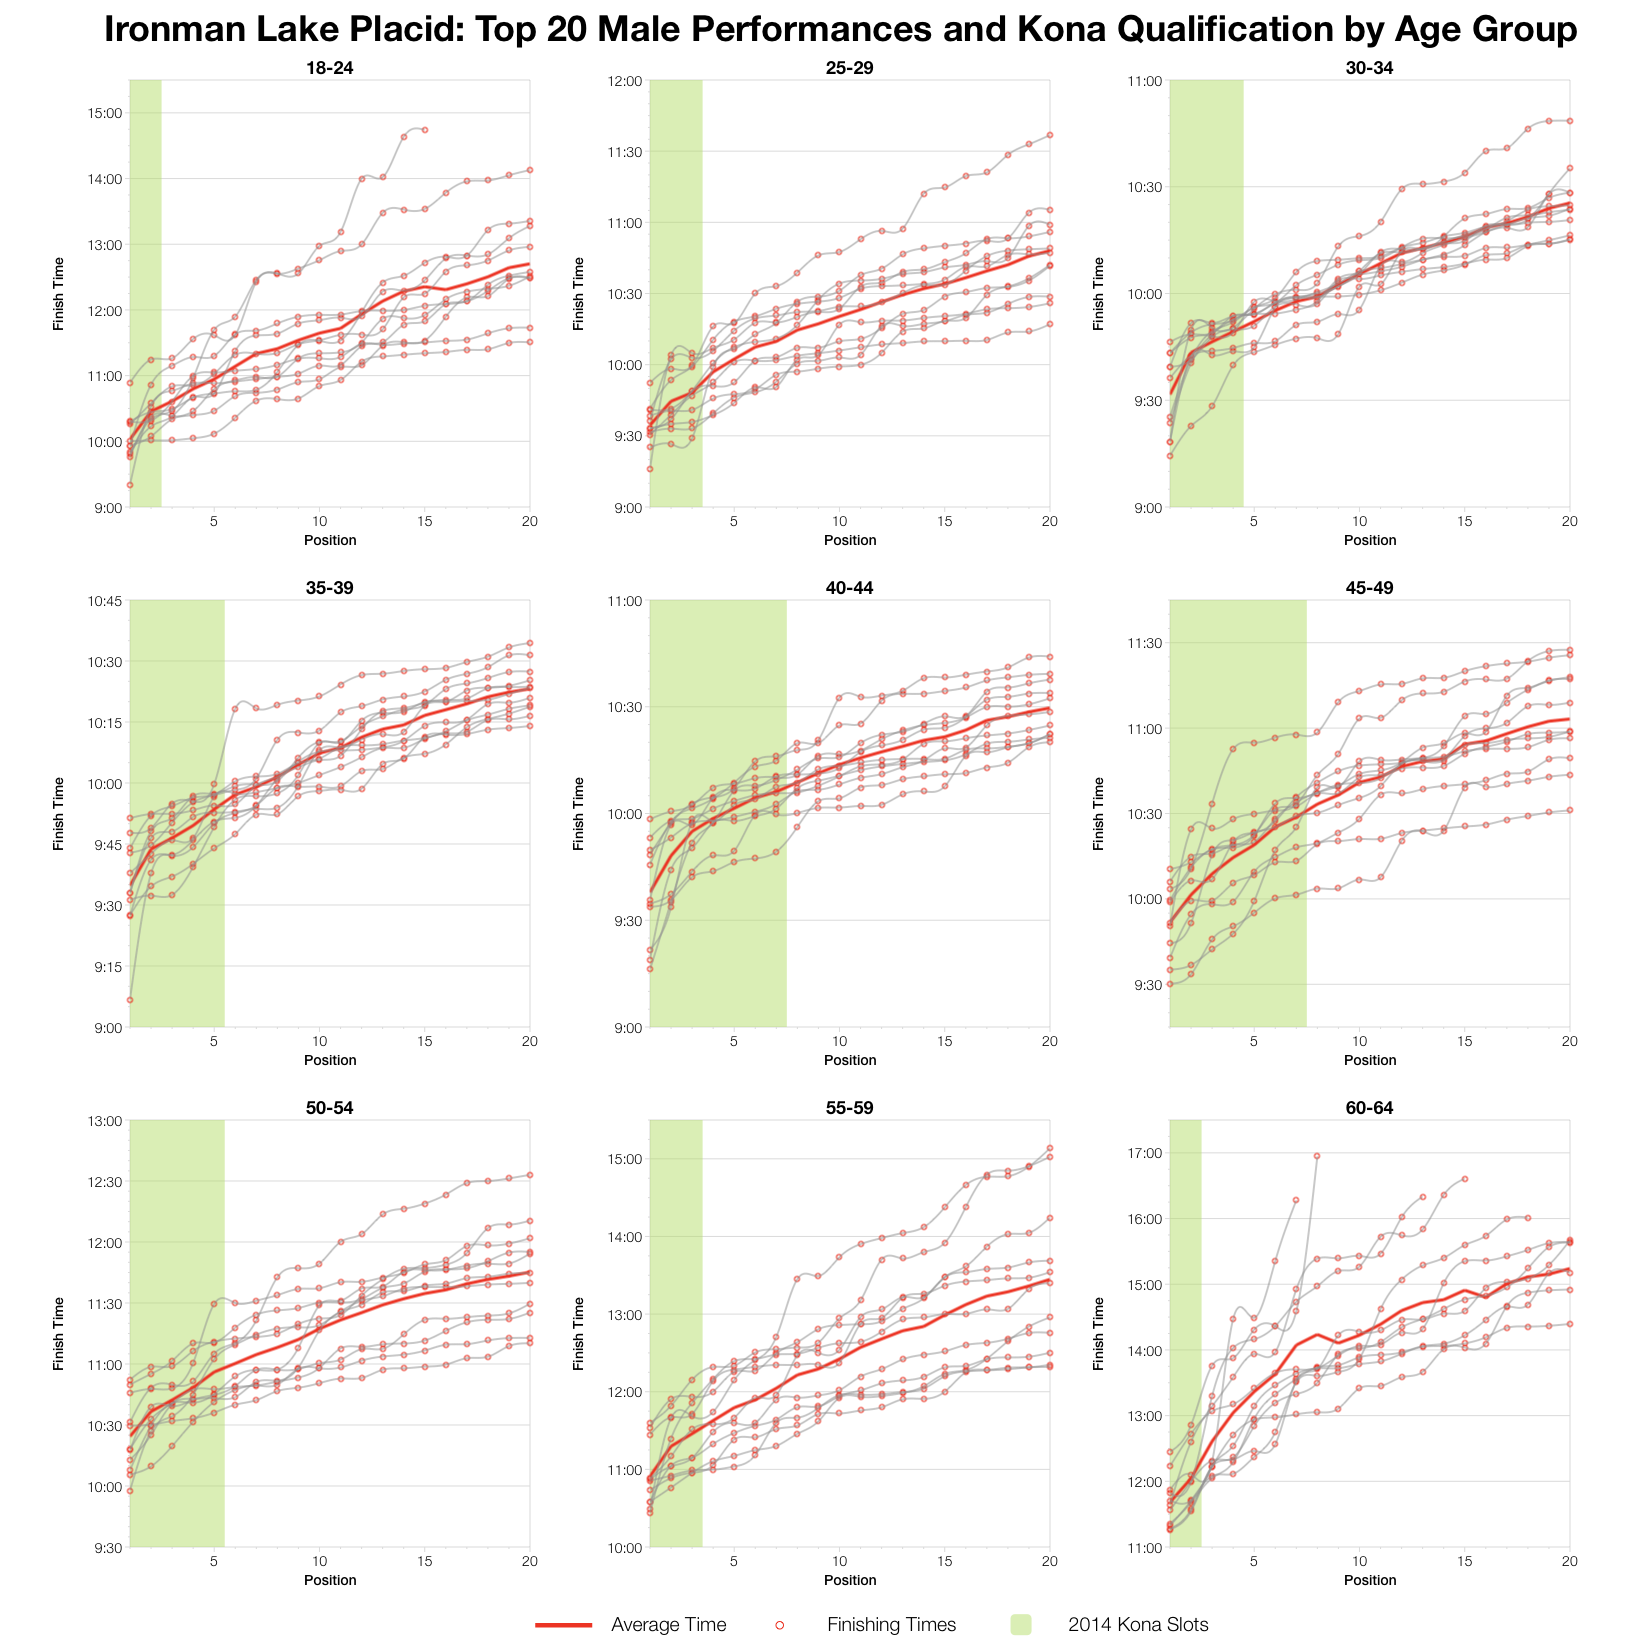
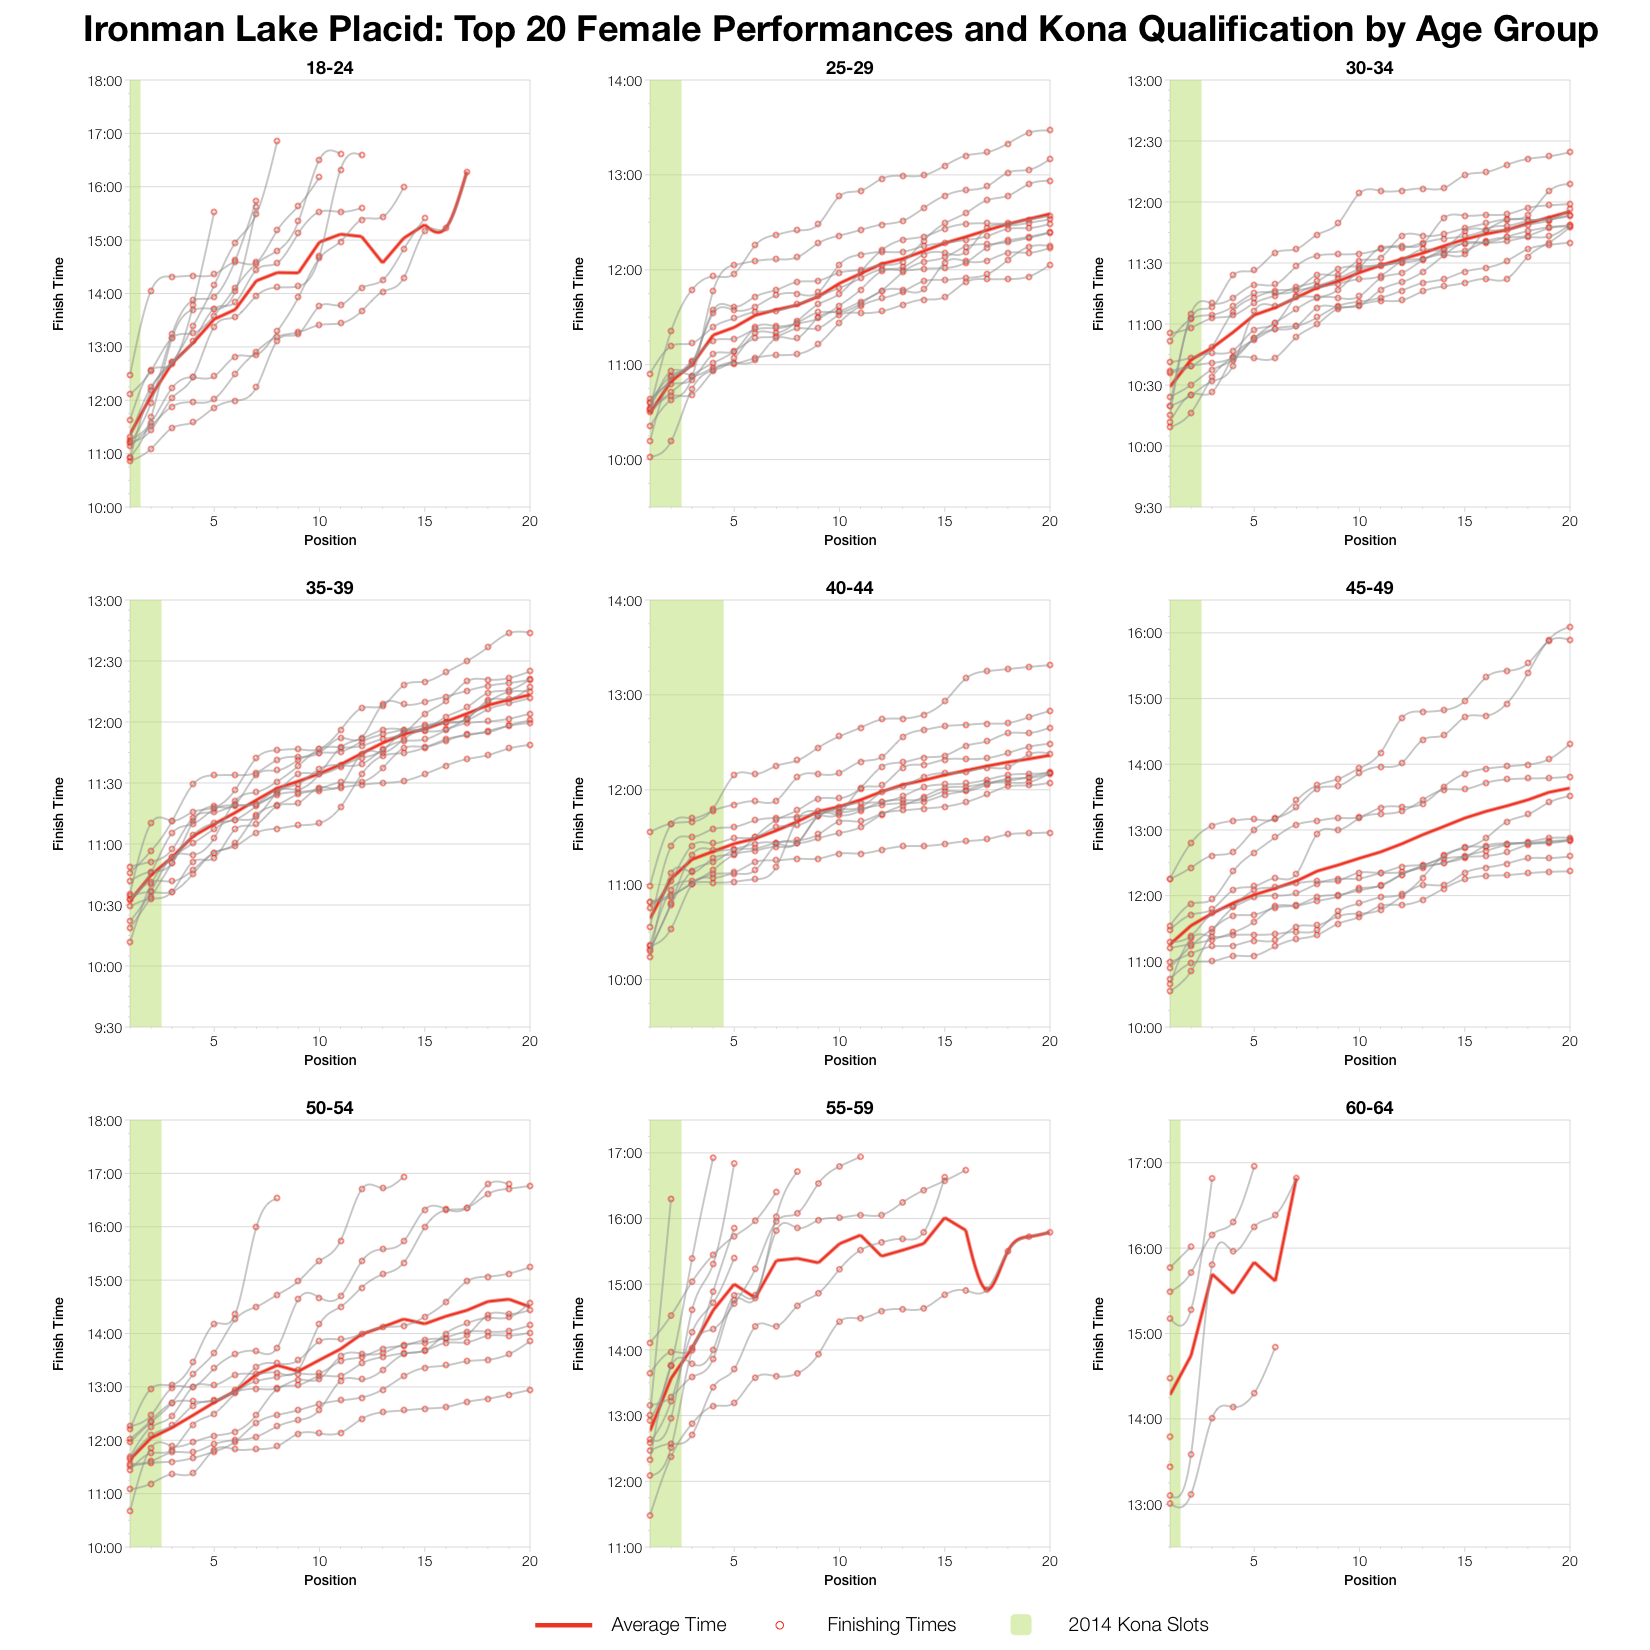
While there is year-on-year variation in top twenty times, generally the trend within each age group – the difference between first and tenth place – is consistent. It’s impossible to predict what time will make a Kona qualifying performance, but the average finish times (red line) gives a ball park figure. For male age groupers between 25 and 40 this likely means a 9:30-10:00 finish; for women in that age range the spread is wider 10:00-11:00.
There’s a lot more detail and information for individual years and age groups in the PDFs below.
Detailed Age Group Statistics
Age group specific Ironman Lake Placid results analysis. More charts and more detailed timings and splits for top age grouper and Kona qualifiers.
Select an age group to view or download PDF
Found these statistic useful? Support the stats, buy me a coffee.
A full analysis of results will follow the race, but may be delayed due to travel.


