We’re back into race season: Ironman New Zealand 2015 took place last weekend. This year I won’t be doing any pre-race analysis of past results, there’s already plenty of data available here. I will continue with the post-race analysis though, but will keep it brief. I’m going to let the graphs do most of the work.
Not having raced on the course on Saturday I can’t say what conditions were actually like, if you were there feel free to add a comment below. Similarly if you have any questions or particular statistics you’re looking for I’m happy to answer them. Finally, a quick note: I’ve excluded results from Ironman New Zealand 2006 from this analysis due to the shortened race.
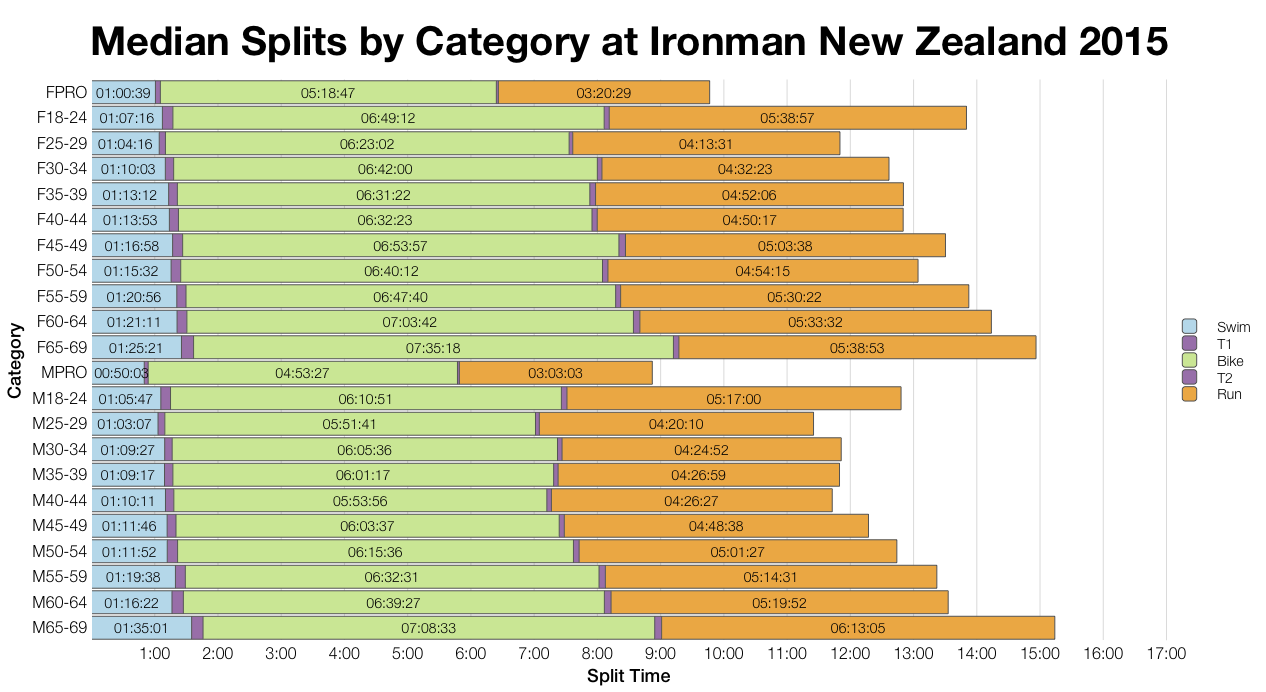
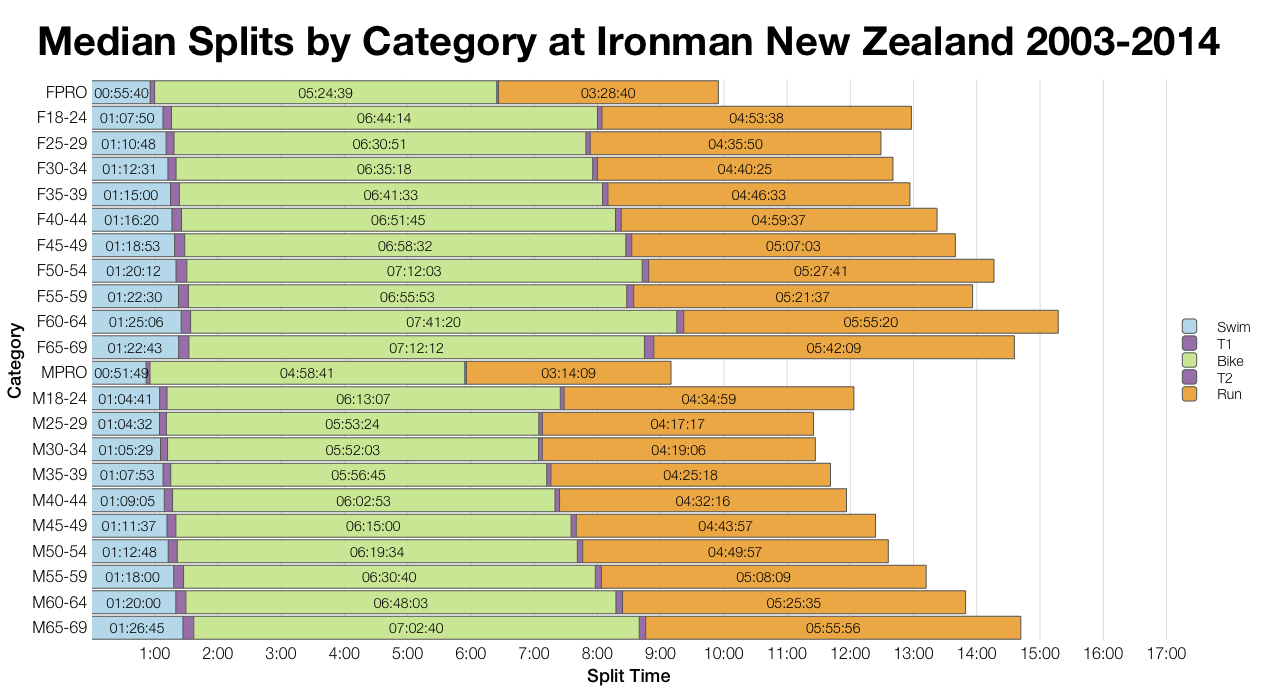
Starting with median splits by age group. There aren’t consistent patterns across all age groups – some slower, some faster – making it tough to say how this race compares. New Zealand has experienced a broad range of race conditions, mostly on the tough end of the spectrum, I’d be inclined to believe 2015 fits within that range. Not the worst the race has seen, not the best either. Medians are quite a broad summary of the data set, it’s hard to read detail into them.
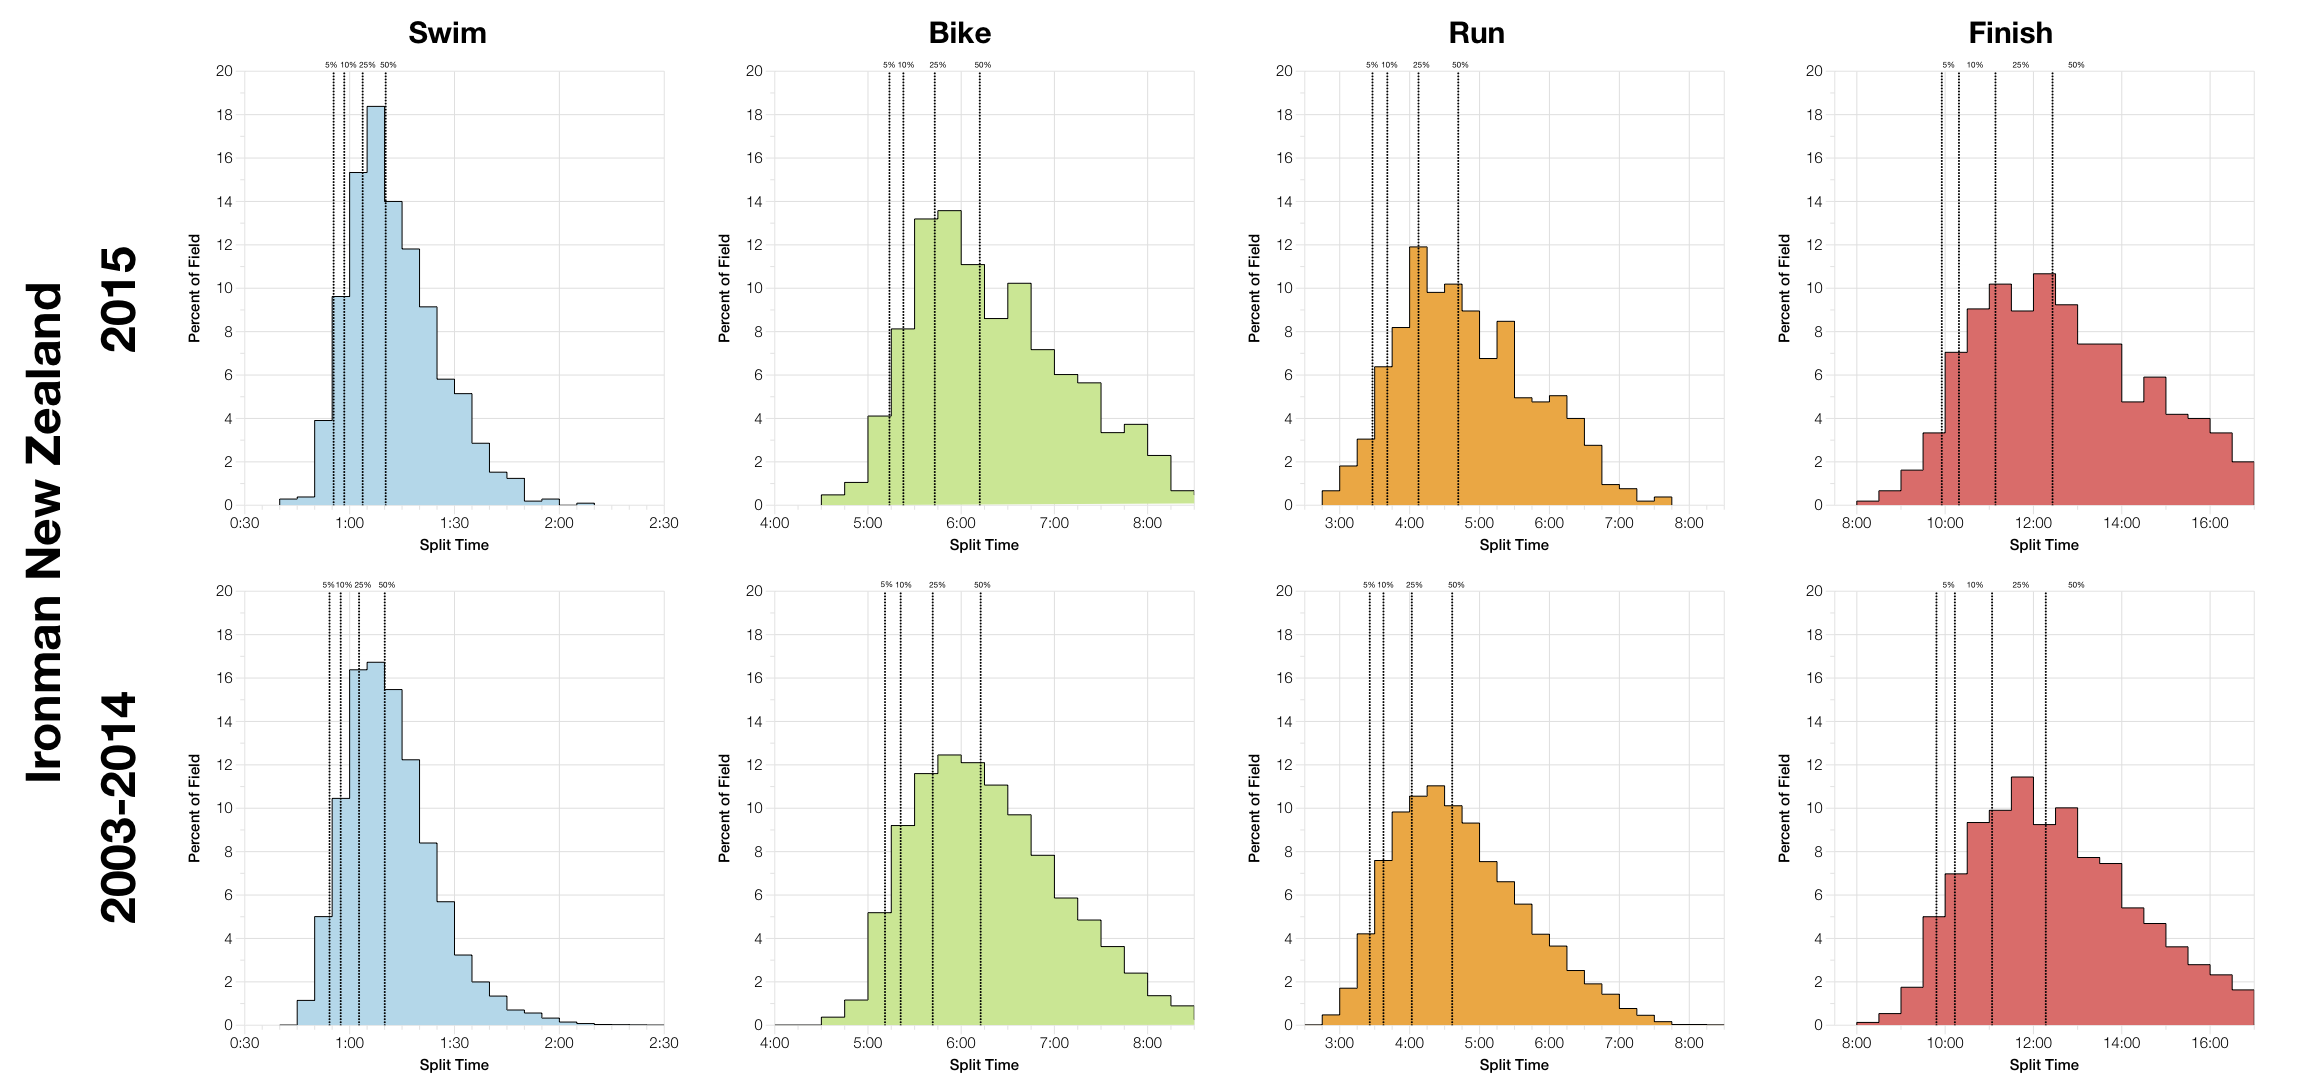
Distributions allow for an easier visualisation of race times. The dotted lines, representing 5%, 10%, 25% and 50% of the field, are generally quite similar between the two sets. The overall median is a little slower this year than in previous years combined. What’s more interesting to note is that in this years results there are more spikes of athletes after the 50% line. The field is a little thinner at the faster times, well weighted in the middle and a little more broadly distributed into the slower times. This could suggest slower conditions overall.
| Number of Athletes | Number of Slots | |
|---|---|---|
| F18-24 | 5 | 1 |
| F25-29 | 17 | 1 |
| F30-34 | 44 | 2 |
| F35-39 | 30 | 2 |
| F40-44 | 50 | 2 |
| F45-49 | 32 | 2 |
| F50-54 | 24 | 2 |
| F55-59 | 8 | 1 |
| F60-64 | 10 | 1 |
| F65-69 | 2 | 1 |
| F70-74 | 1 | 1 |
| M18-24 | 21 | 2 |
| M25-29 | 54 | 2 |
| M30-34 | 87 | 3 |
| M35-39 | 124 | 4 |
| M40-44 | 180 | 6 |
| M45-49 | 151 | 5 |
| M50-54 | 135 | 4 |
| M55-59 | 71 | 3 |
| M60-64 | 29 | 2 |
| M65-69 | 19 | 1 |
| M70-74 | 6 | 1 |
| M75-79 | 3 | 1 |
| Total | 1103 | 50 |
I’ve estimated Kona slot allocations in the table above for use in my final set of graphs. Numbers are based on the data in the Athlete Tracker; the actual slot allocation may vary from this, but it’s a reasonable guide.
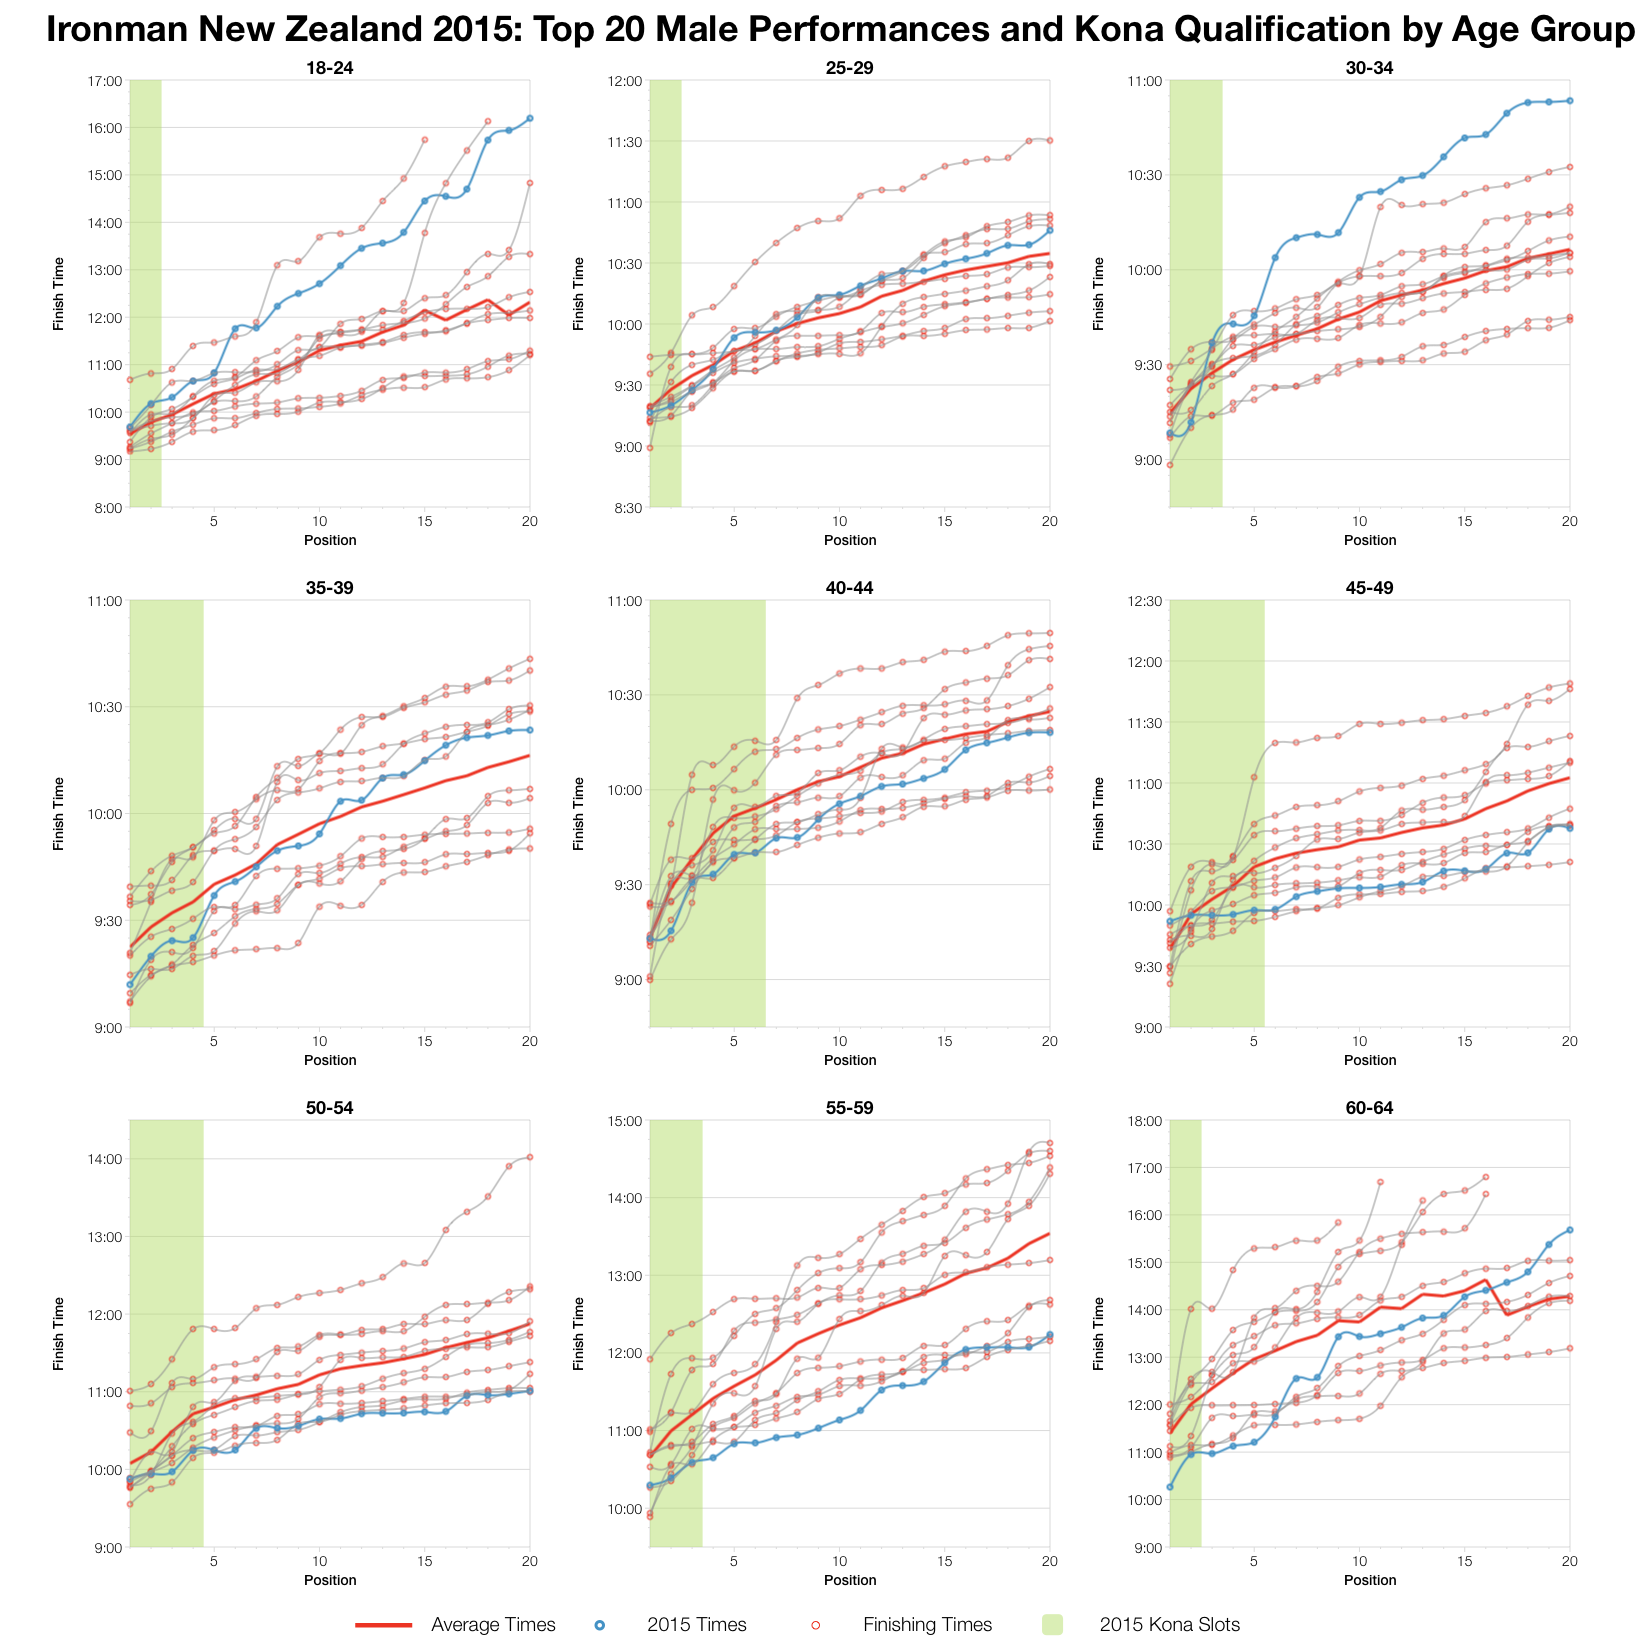
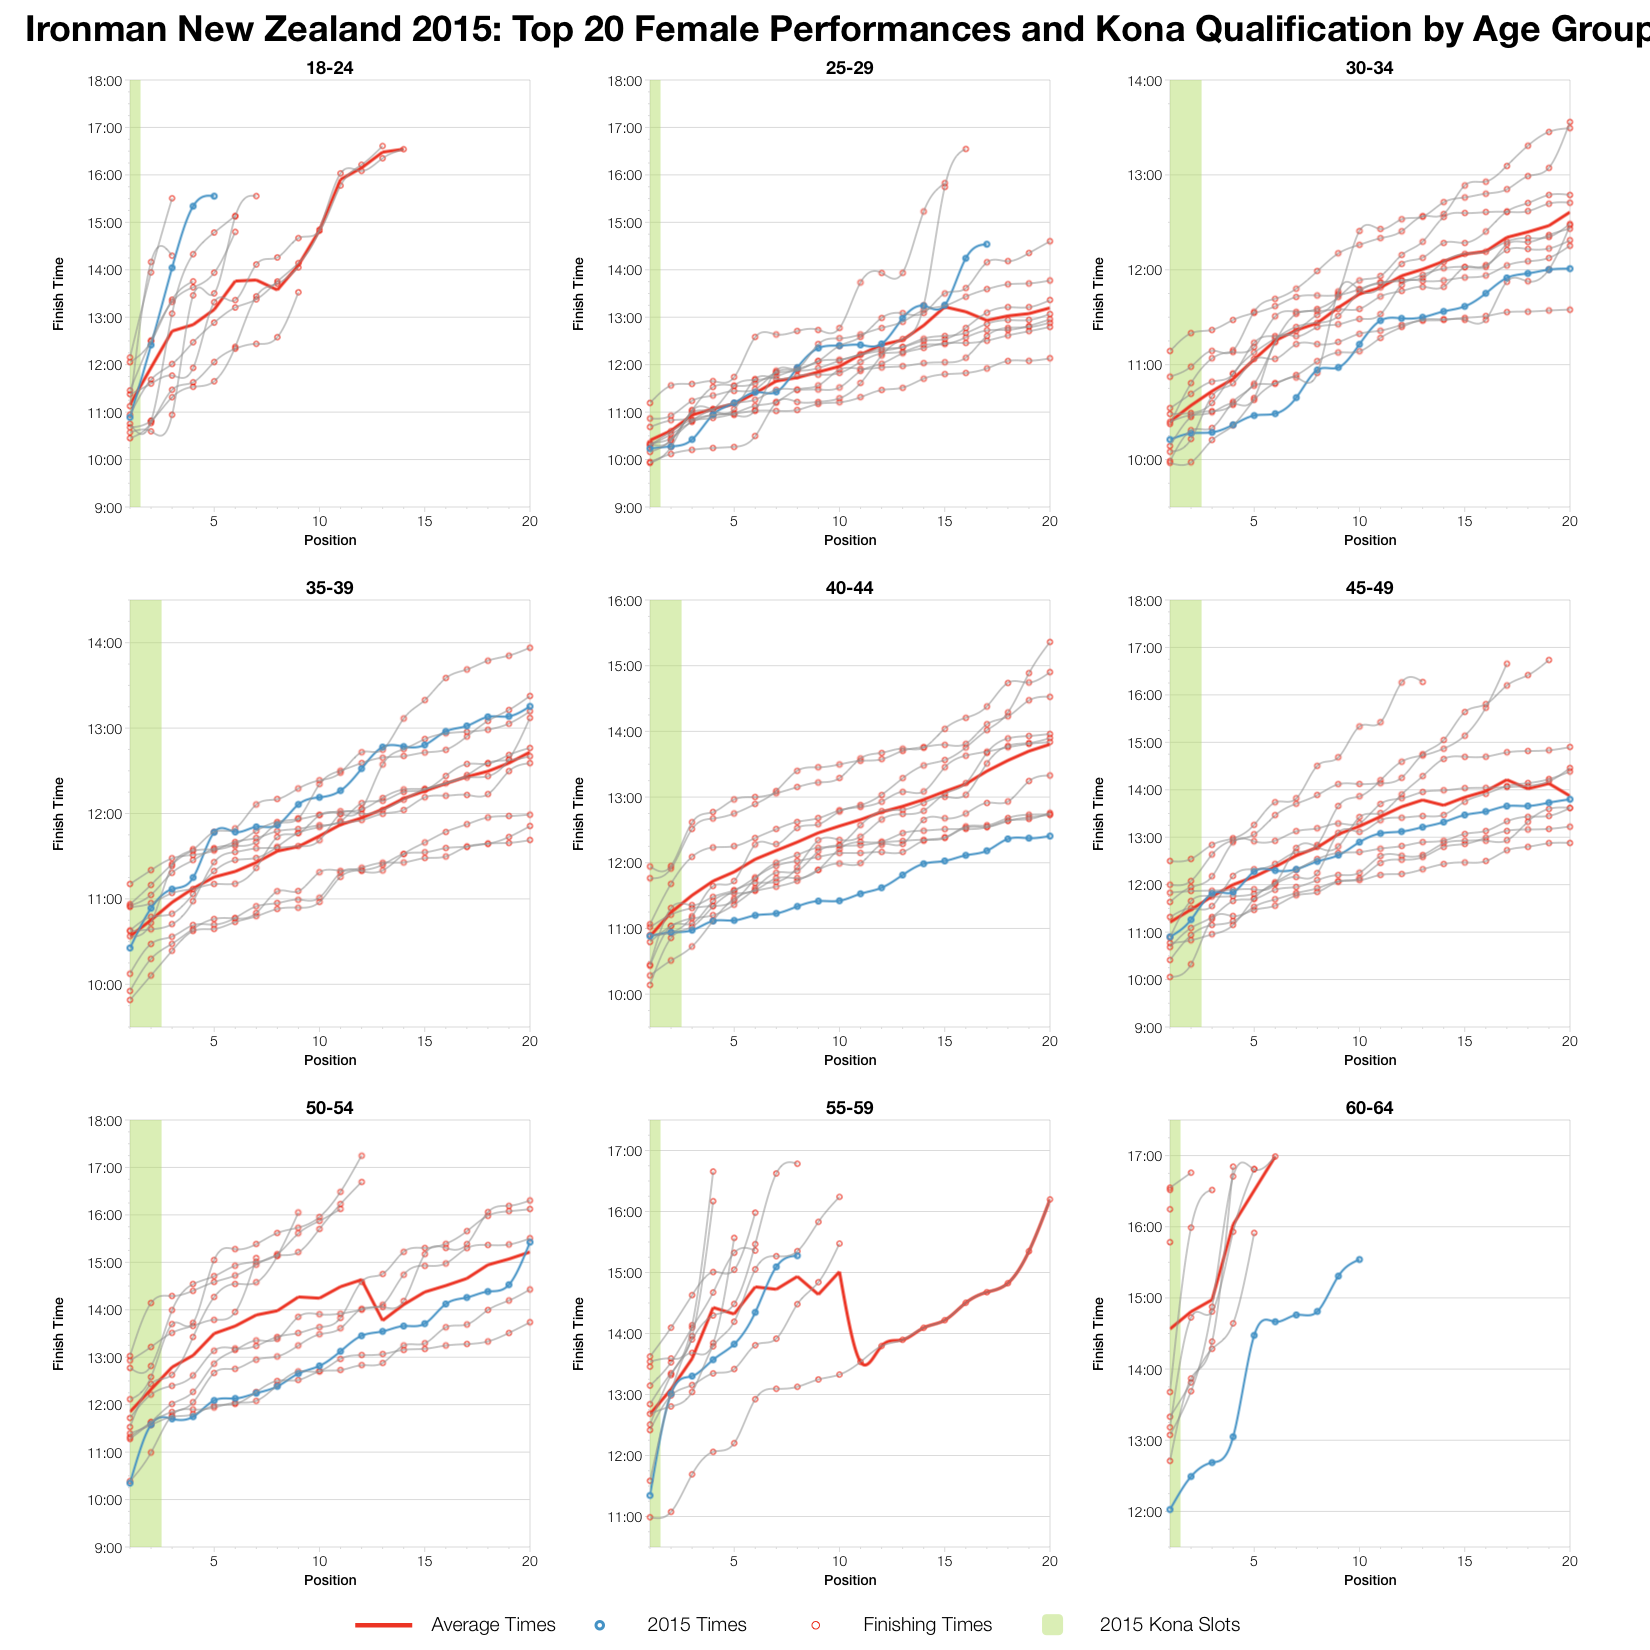
It’s a mixed picture looking at the top twenty of each age group. Some faired worse this year, some better. A casual glance suggests age was a determining factor – it’s the older age groups who appear to have outperformed the averages. I wouldn’t place too much significance on this; although if that is the case it runs contrary to the idea that things got tougher as the day went on. What I will say is that whatever the conditions, the very front of the race tends to see the same high standards every time.
For those interested in the full breakdown of results you’ll find a spreadsheet of the Ironman New Zealand 2015 Splits on my Google Drive.


