Another busy weekend of Ironman racing with both Ironman UK taking place in Bolton and Ironman Switzerland in Zurich. As it’s local (well, in the same country) and as I had more athletes racing there I’ll start the week with review of results from Ironman UK. While the continent has been seeing some hot racing over the last few weeks, Bolton went with more traditionally British damp conditions. The result appears to have been a slower race than usual, mostly due to the bike.
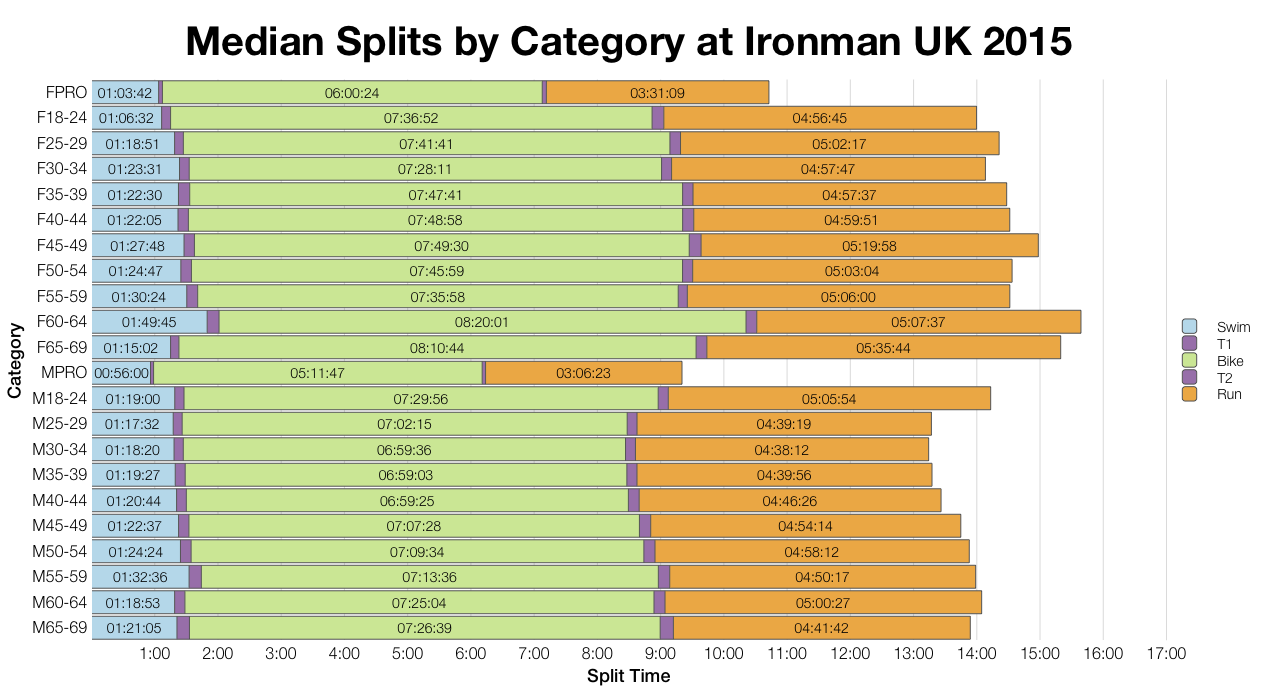
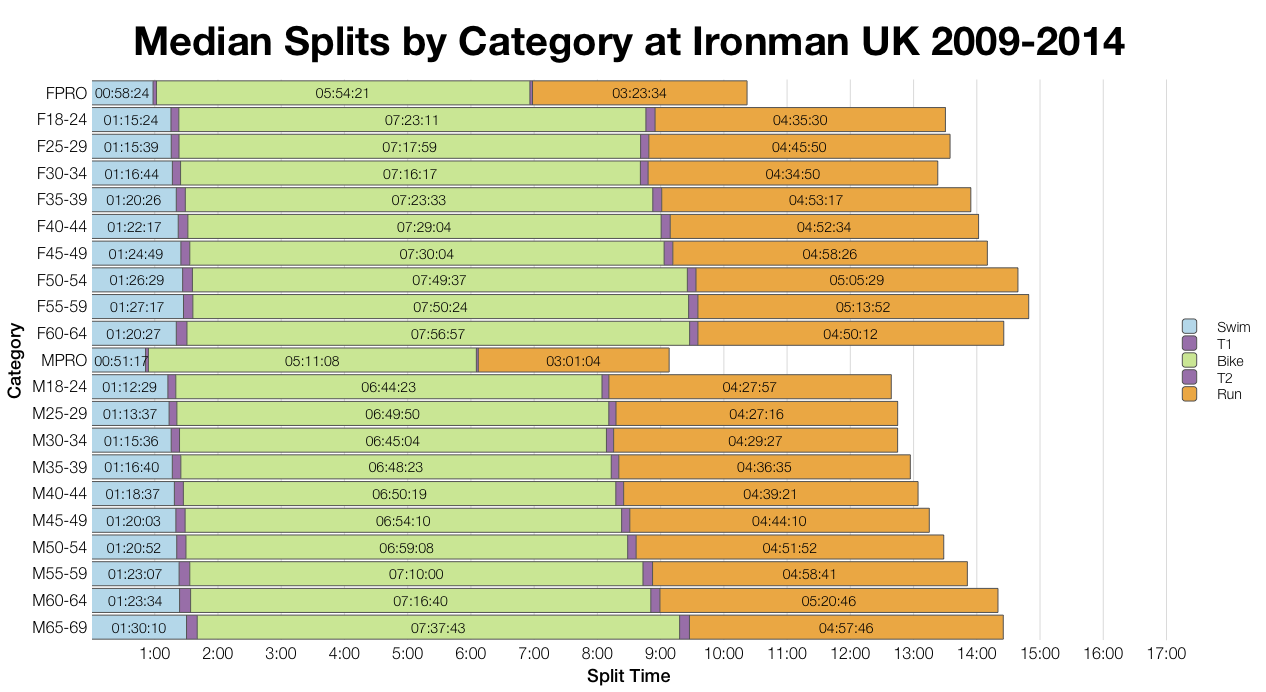
Starting with age group medians the 2015 results are basically slower than previous years at Bolton (2009 onwards). The difference is particularly noticeable on the bike, but also present in swim and run to lesser extents. As usual there is variation across age groups, not all splits are slower, and the pro field appears less impacted than age groupers.
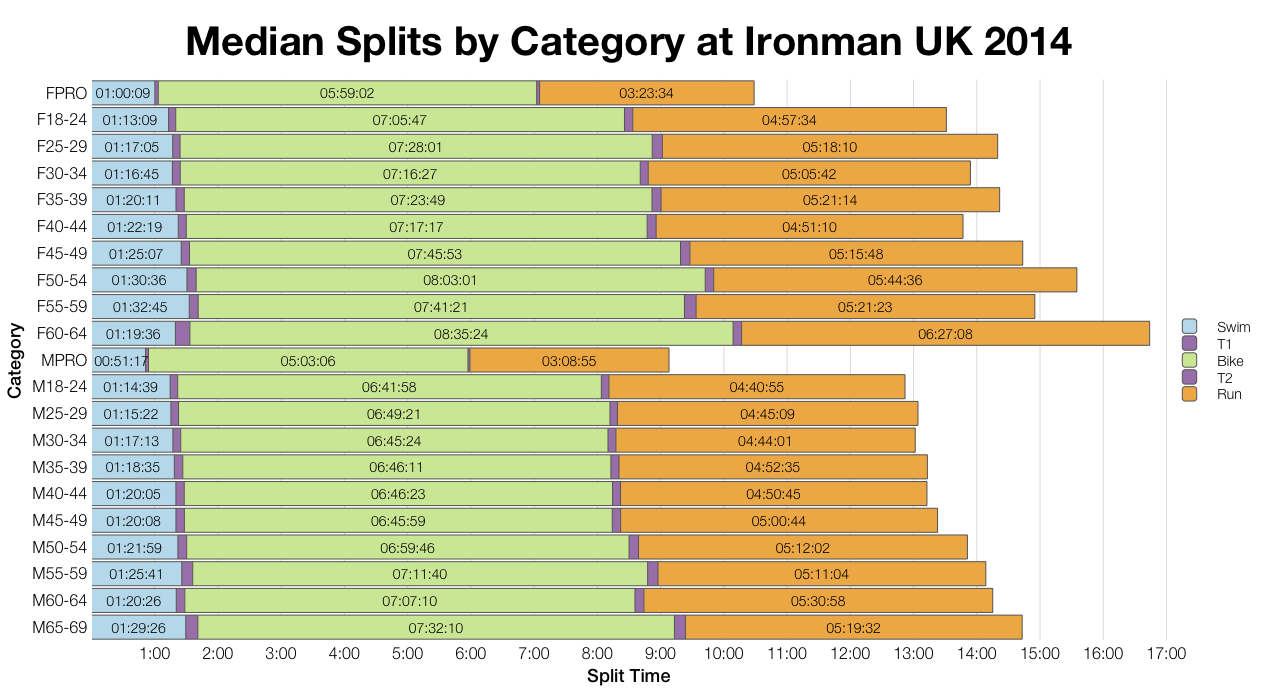
Given the biggest difference is seen on the bike I’ve also included separate 2014 medians – the bike course was altered in 2014 so I wanted to see how the two races on the newer course compared. Bike splits are clearly slower in 2015, but note the run splits are faster. Looking back to Ironman UK 2014: results and analysis the run was hot and humid which likely impacted its times. This year’s wetter, cooler conditions better suit the run, but weren’t so favourable for the bike.
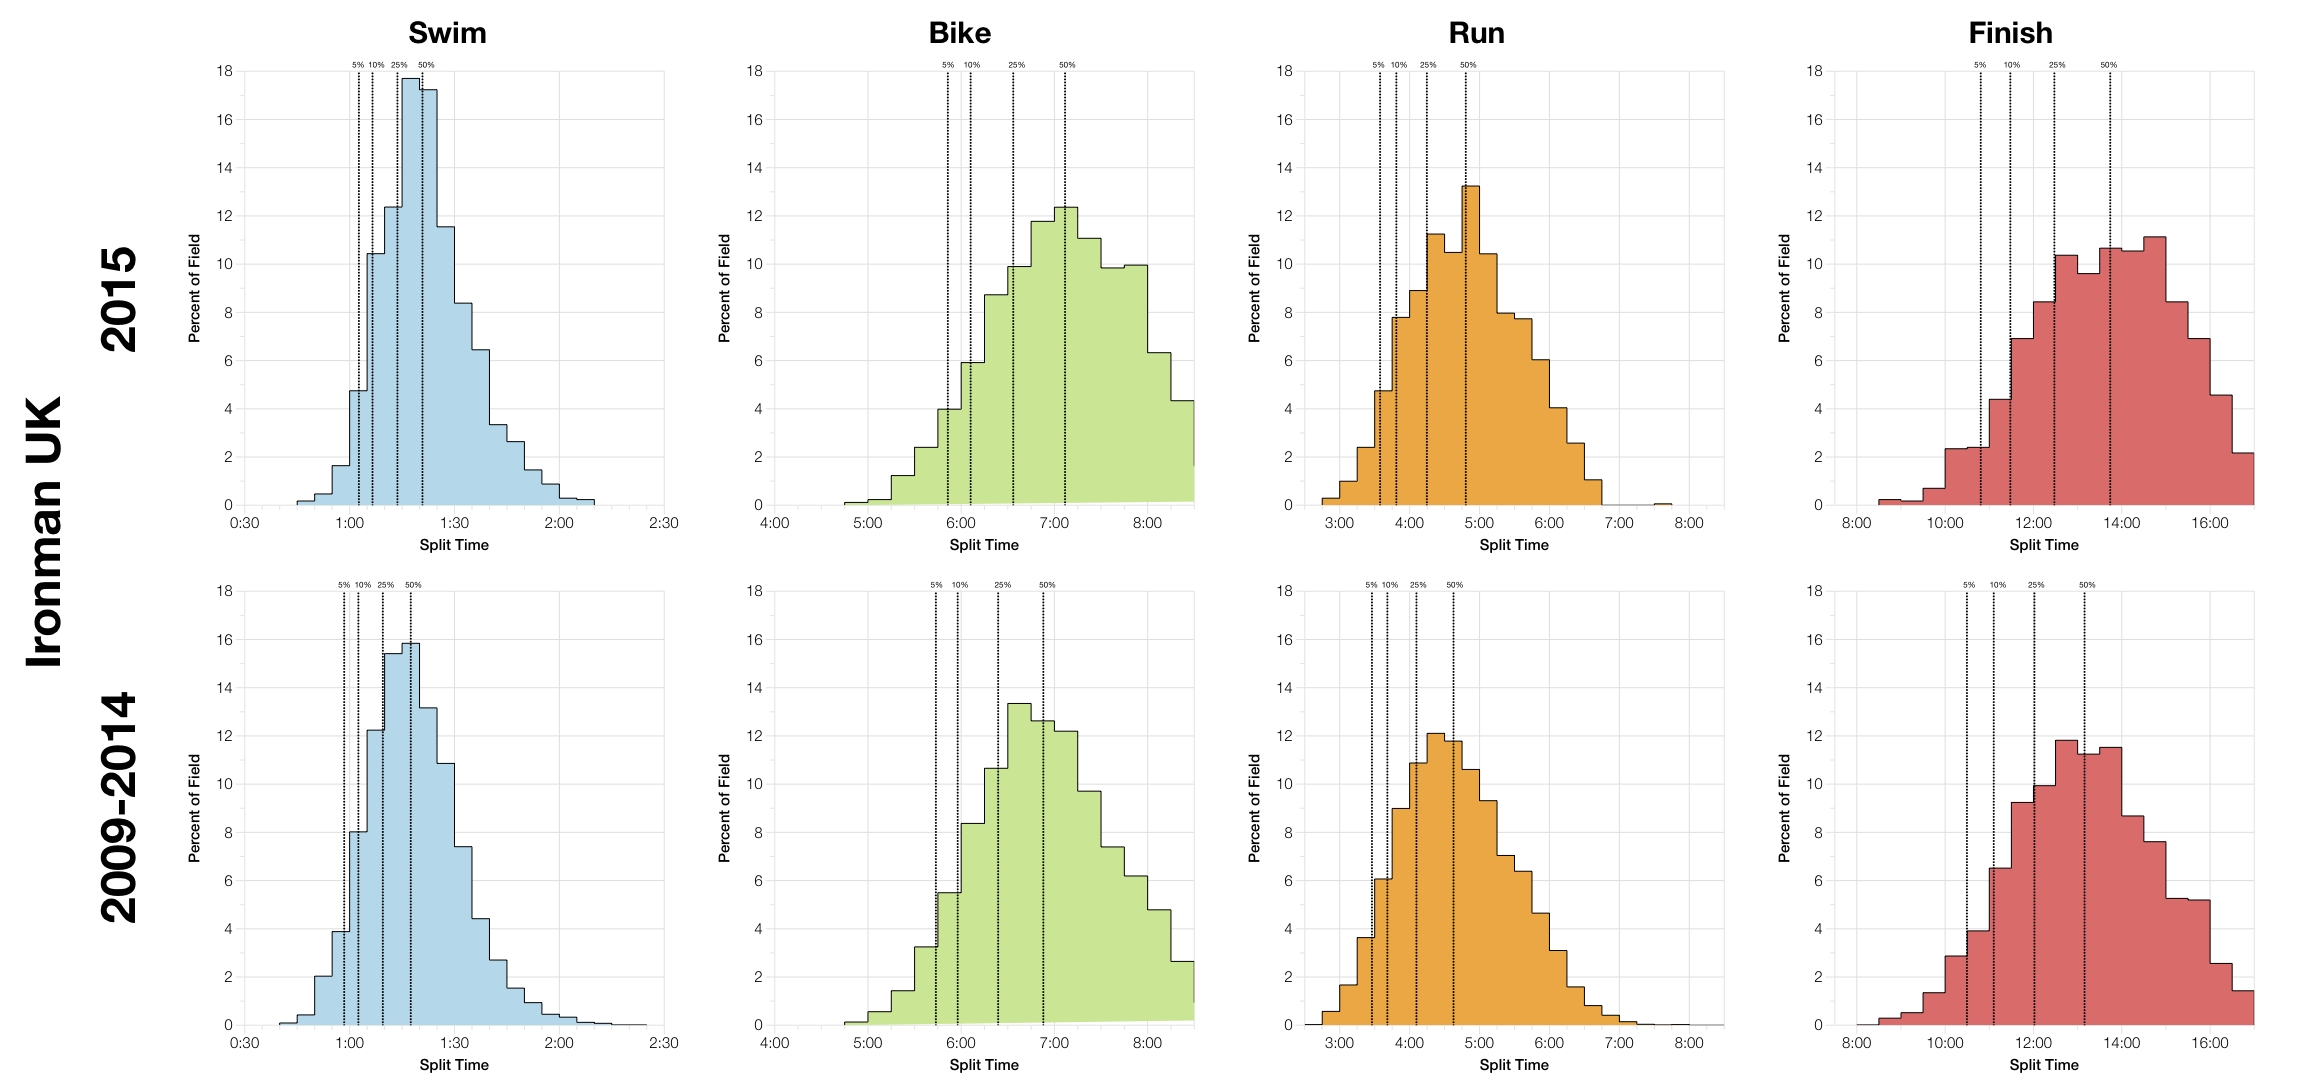
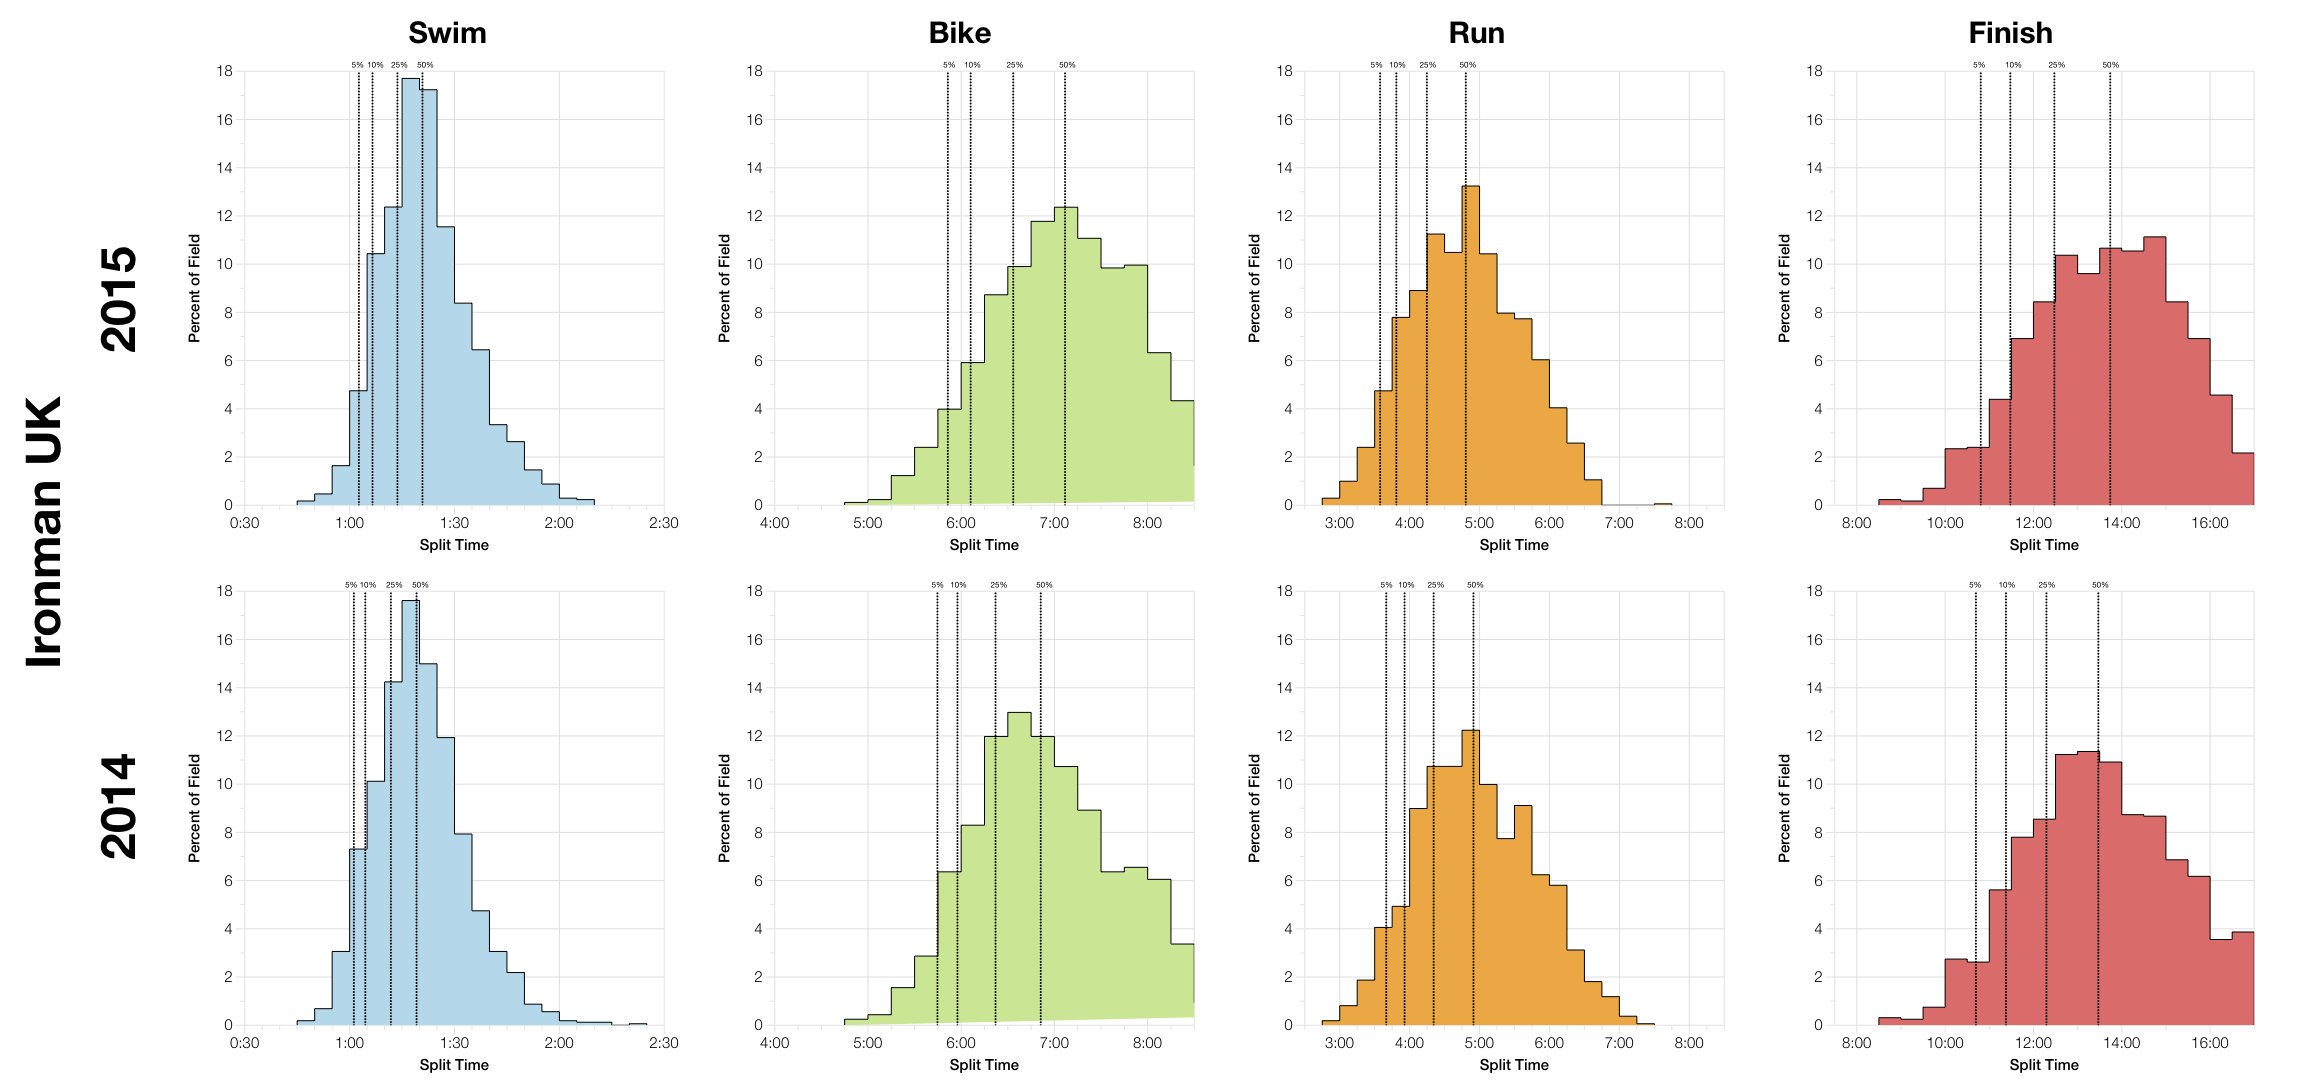
The distribution of splits emphasises the slower race that took place this year when compared with the aggregated results from 2009-2014. Swim, bike and run are all affected, more so at the median than at the front of the field. I’ve heard some reports that the swim may have been long which would explain why times were so much slower. After that the cool, damp conditions on the day didn’t help the bike and the slower run may be a knock on effect from a longer ride.
Again I’ve added a chart directly comparing 2015 and 2014 to see how the same course compares. The change here is in the run where 2015 proves faster than the 2014 race for reasons already noted. I’ll add that one or two previous races in Bolton have had short runs which slightly skew some of the earlier results and will factor into 2015’s apparently slower distribution.
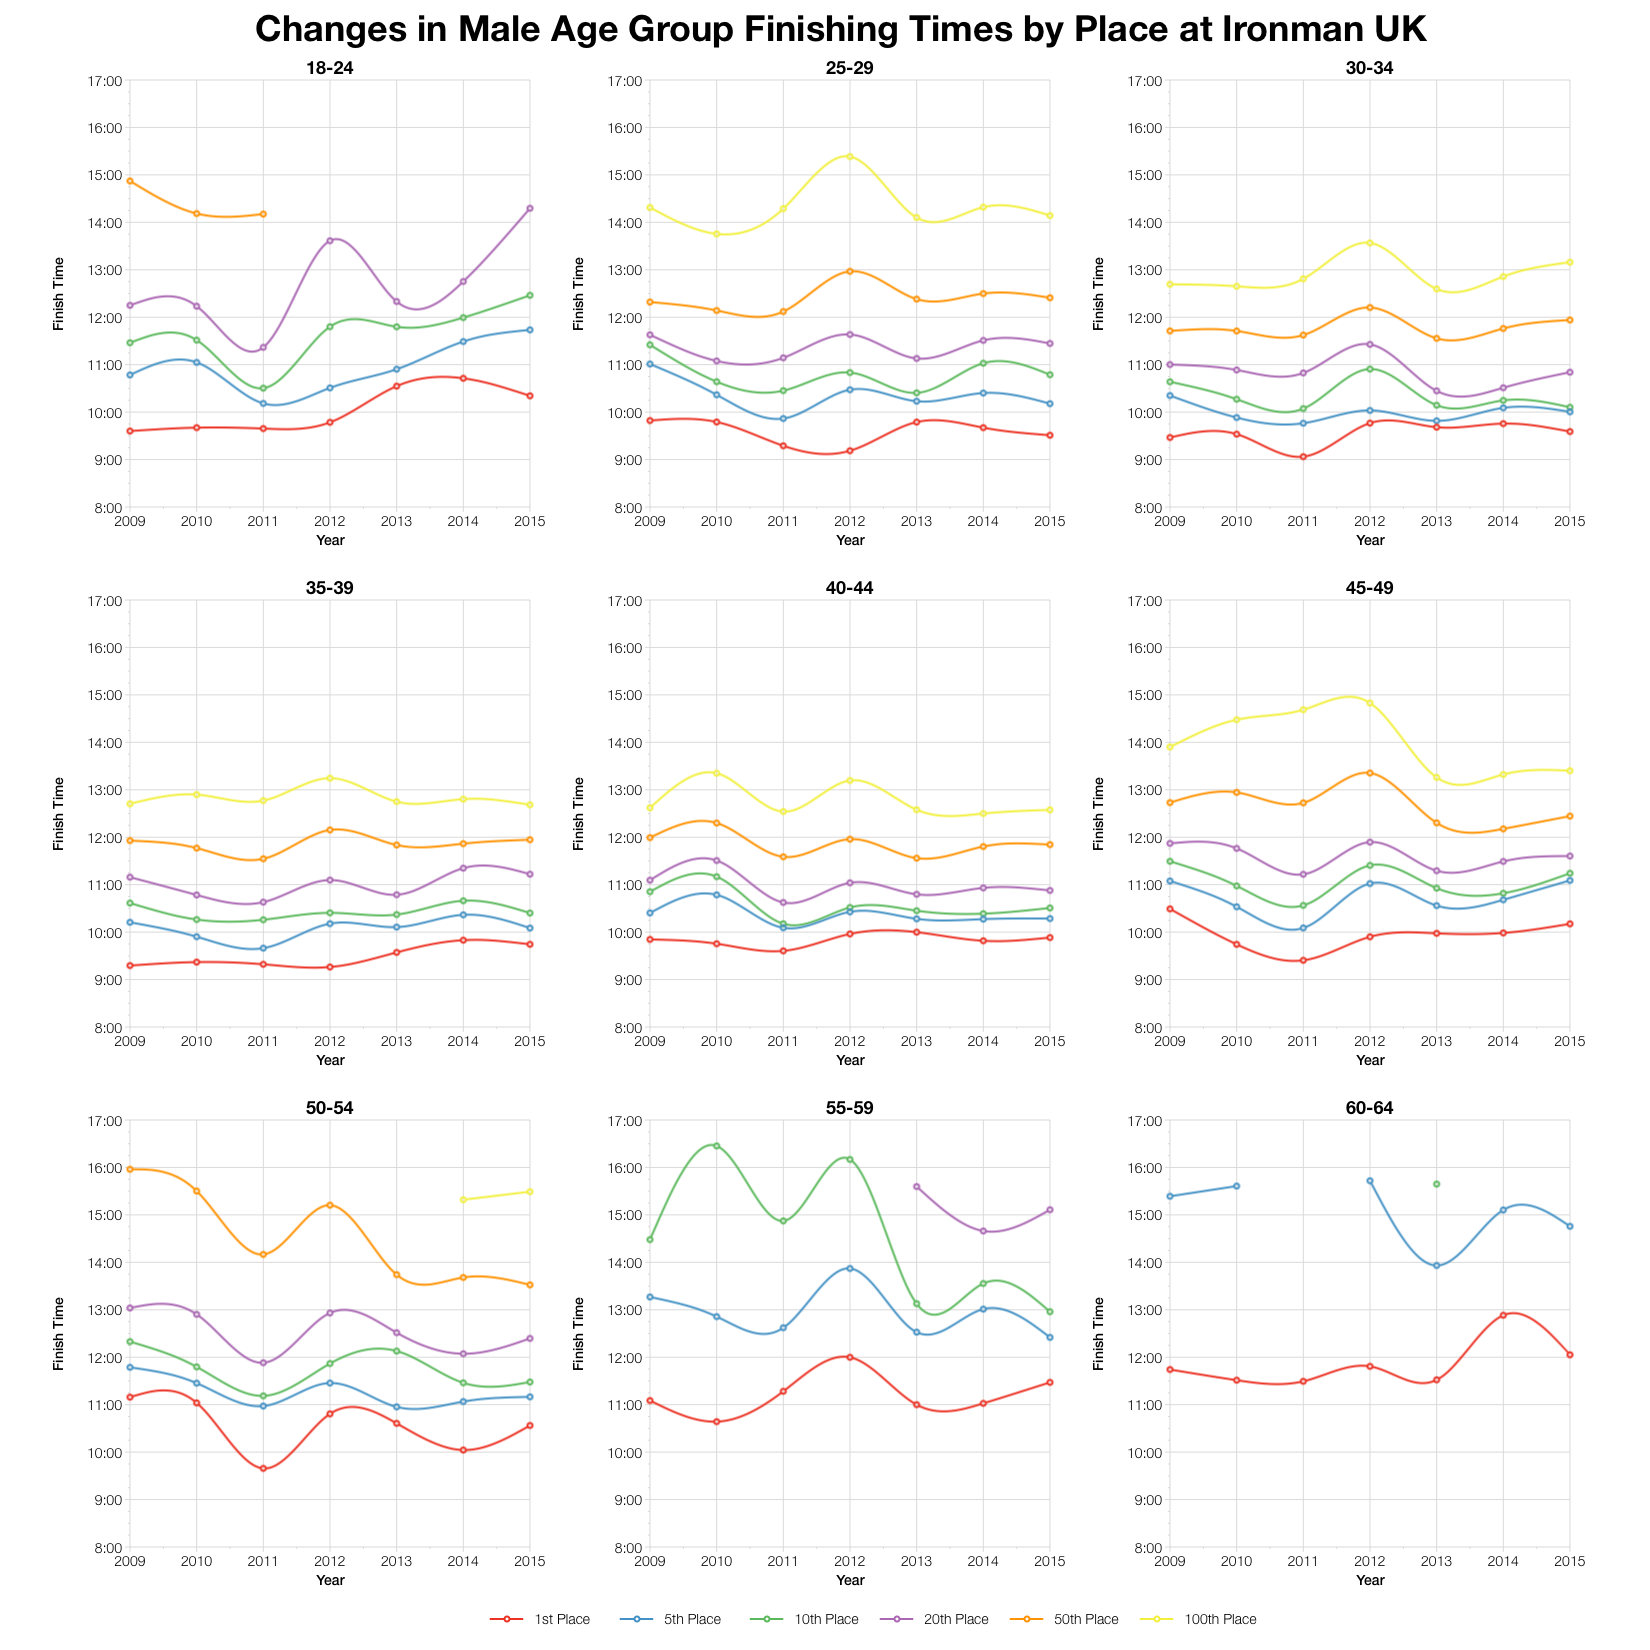
During its time in Bolton there has been quite a variation in results for Ironman UK as shown in the charts above. While the distributions and medians put 2015 as a slower than usual year if I look at finish times for specific age group positions the race doesn’t look that different to normal. Certainly not as slow as the 2012 event appears to have been.
This may, in part, be a product of the data points used – for the large age groups 100th place is still in the top third of that field and the front of the pack is generally less impacted by conditions. It’s the tail end of the field where the biggest differences occur. Also when comparing an individual year to aggregated data in previous charts we inevitably lose some of the details
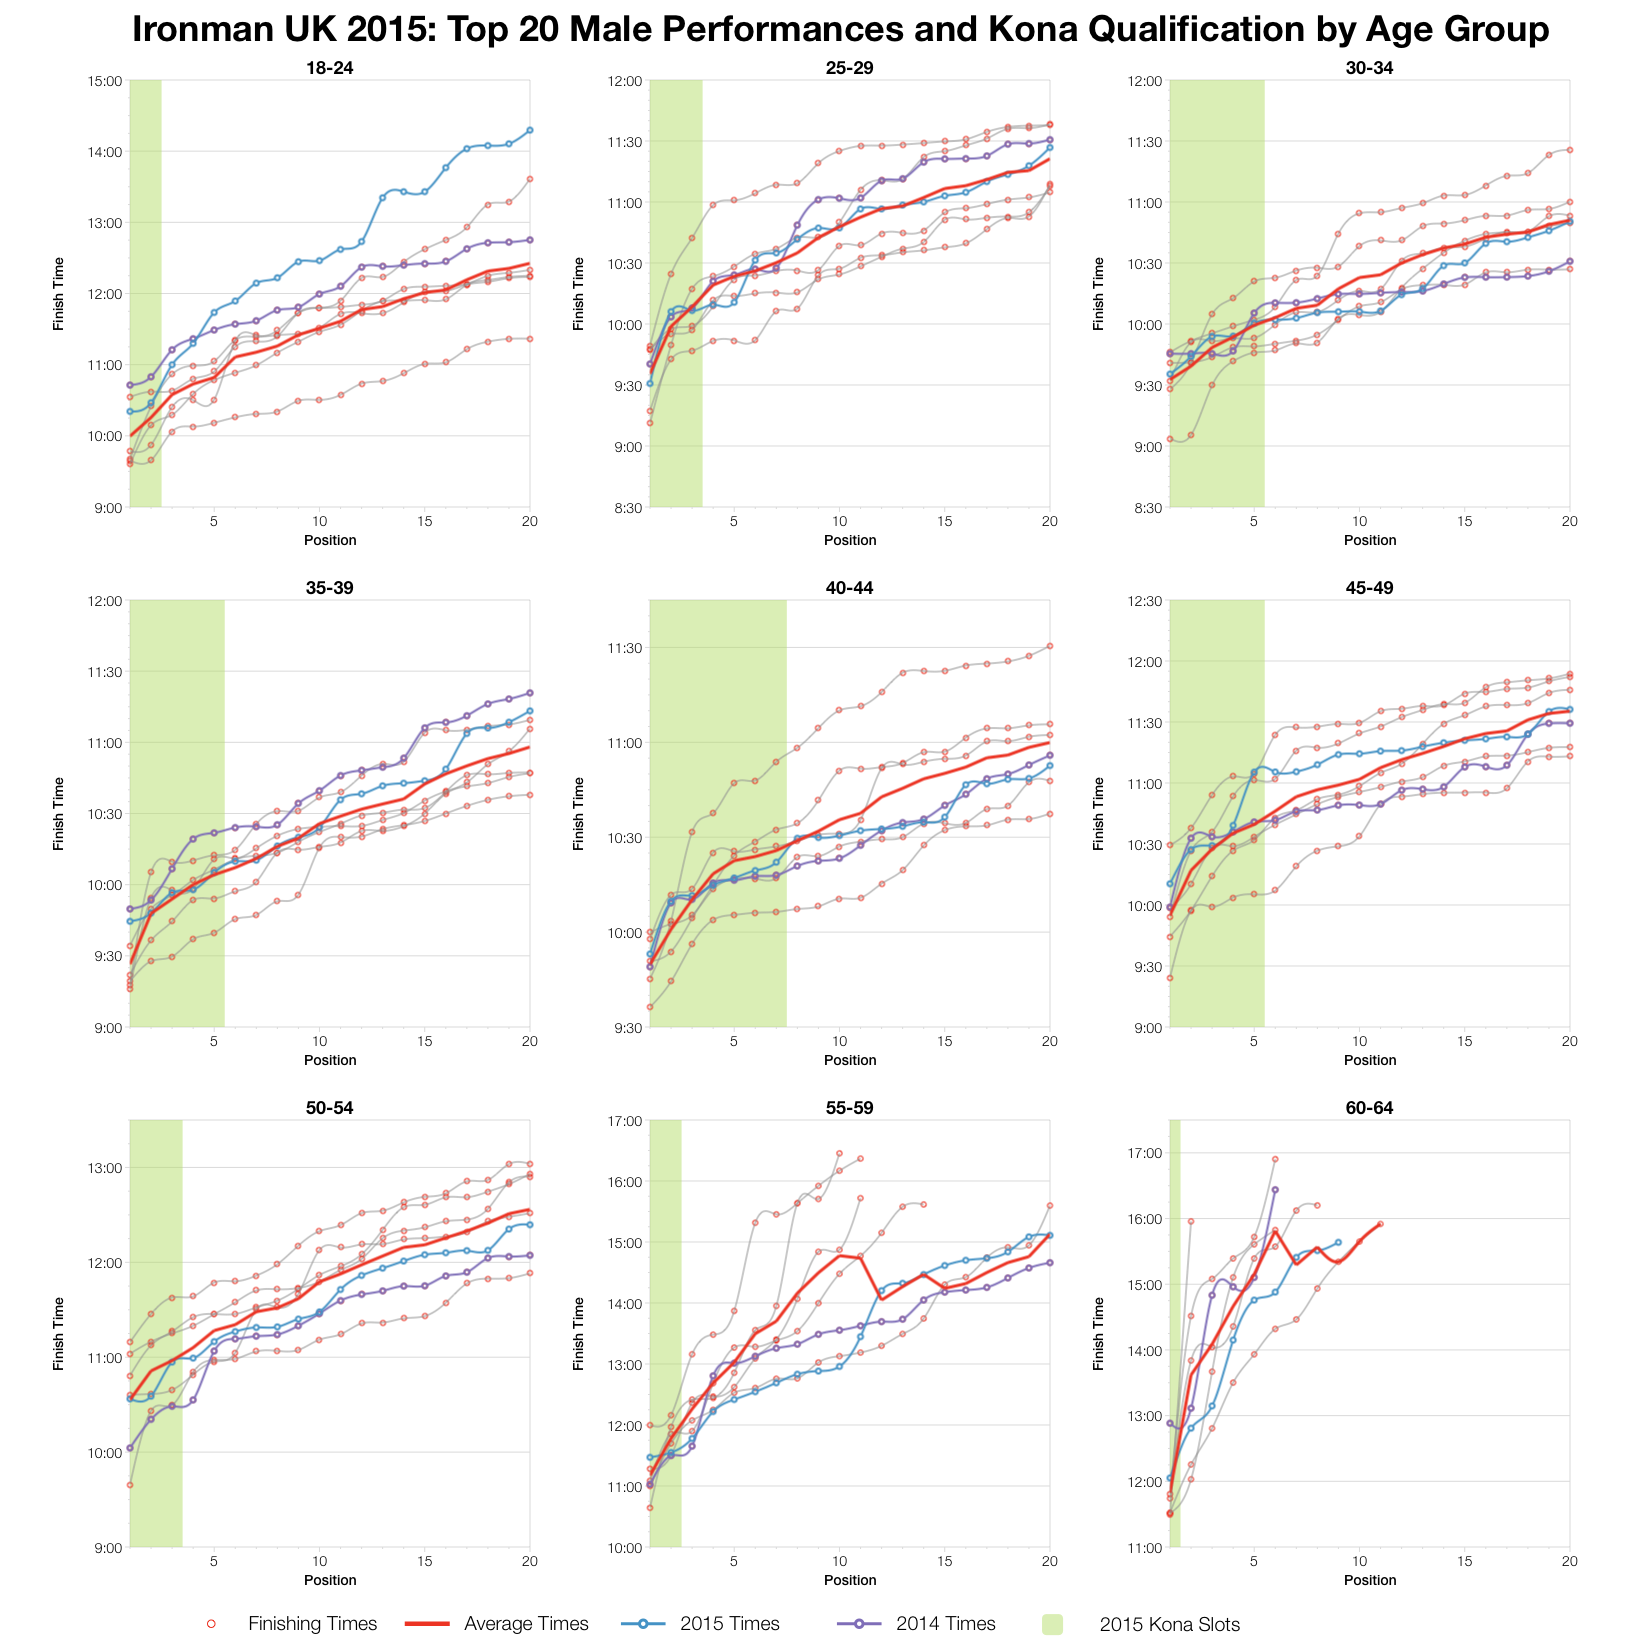
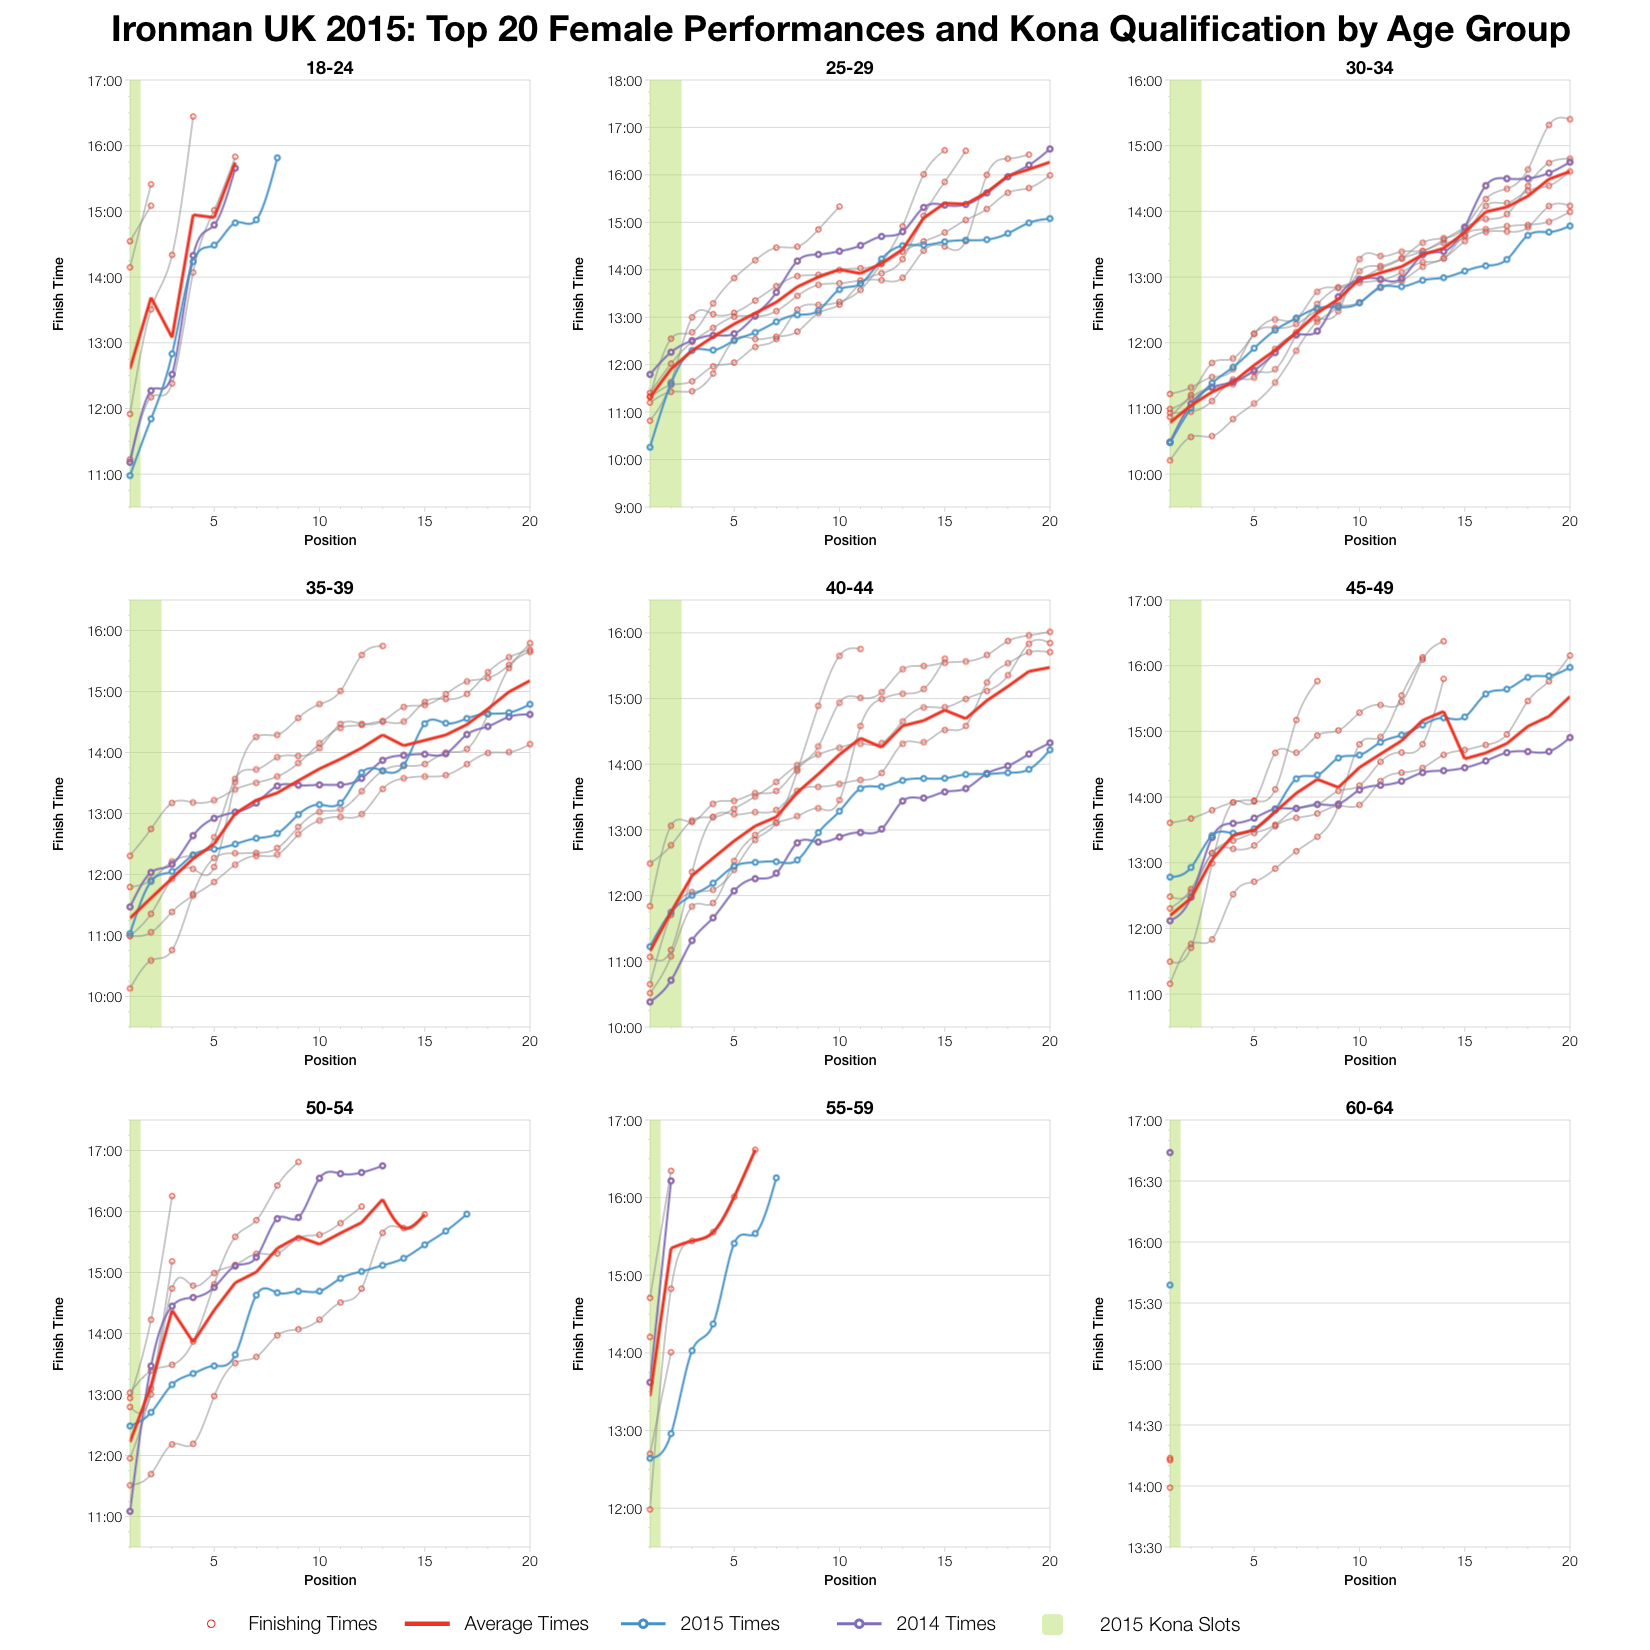
At the very front of the age group race there is less impact from conditions. Times among the top twenty of each age group tend to fall close to their 2014 counterparts and not far from the Bolton averages. As usual, there are exceptions, but not very many. The race for Kona slots was largely on form.
A full spreadsheet of the results and splits from Ironman UK 2015 is available on my Google Drive.


