Since relaunching in 2013 Ironman Japan has been one of the slower races on the Ironman calendar. 2015 is no exception, in fact this year’s results are particularly slow with the bike proving to be the challenging stage.
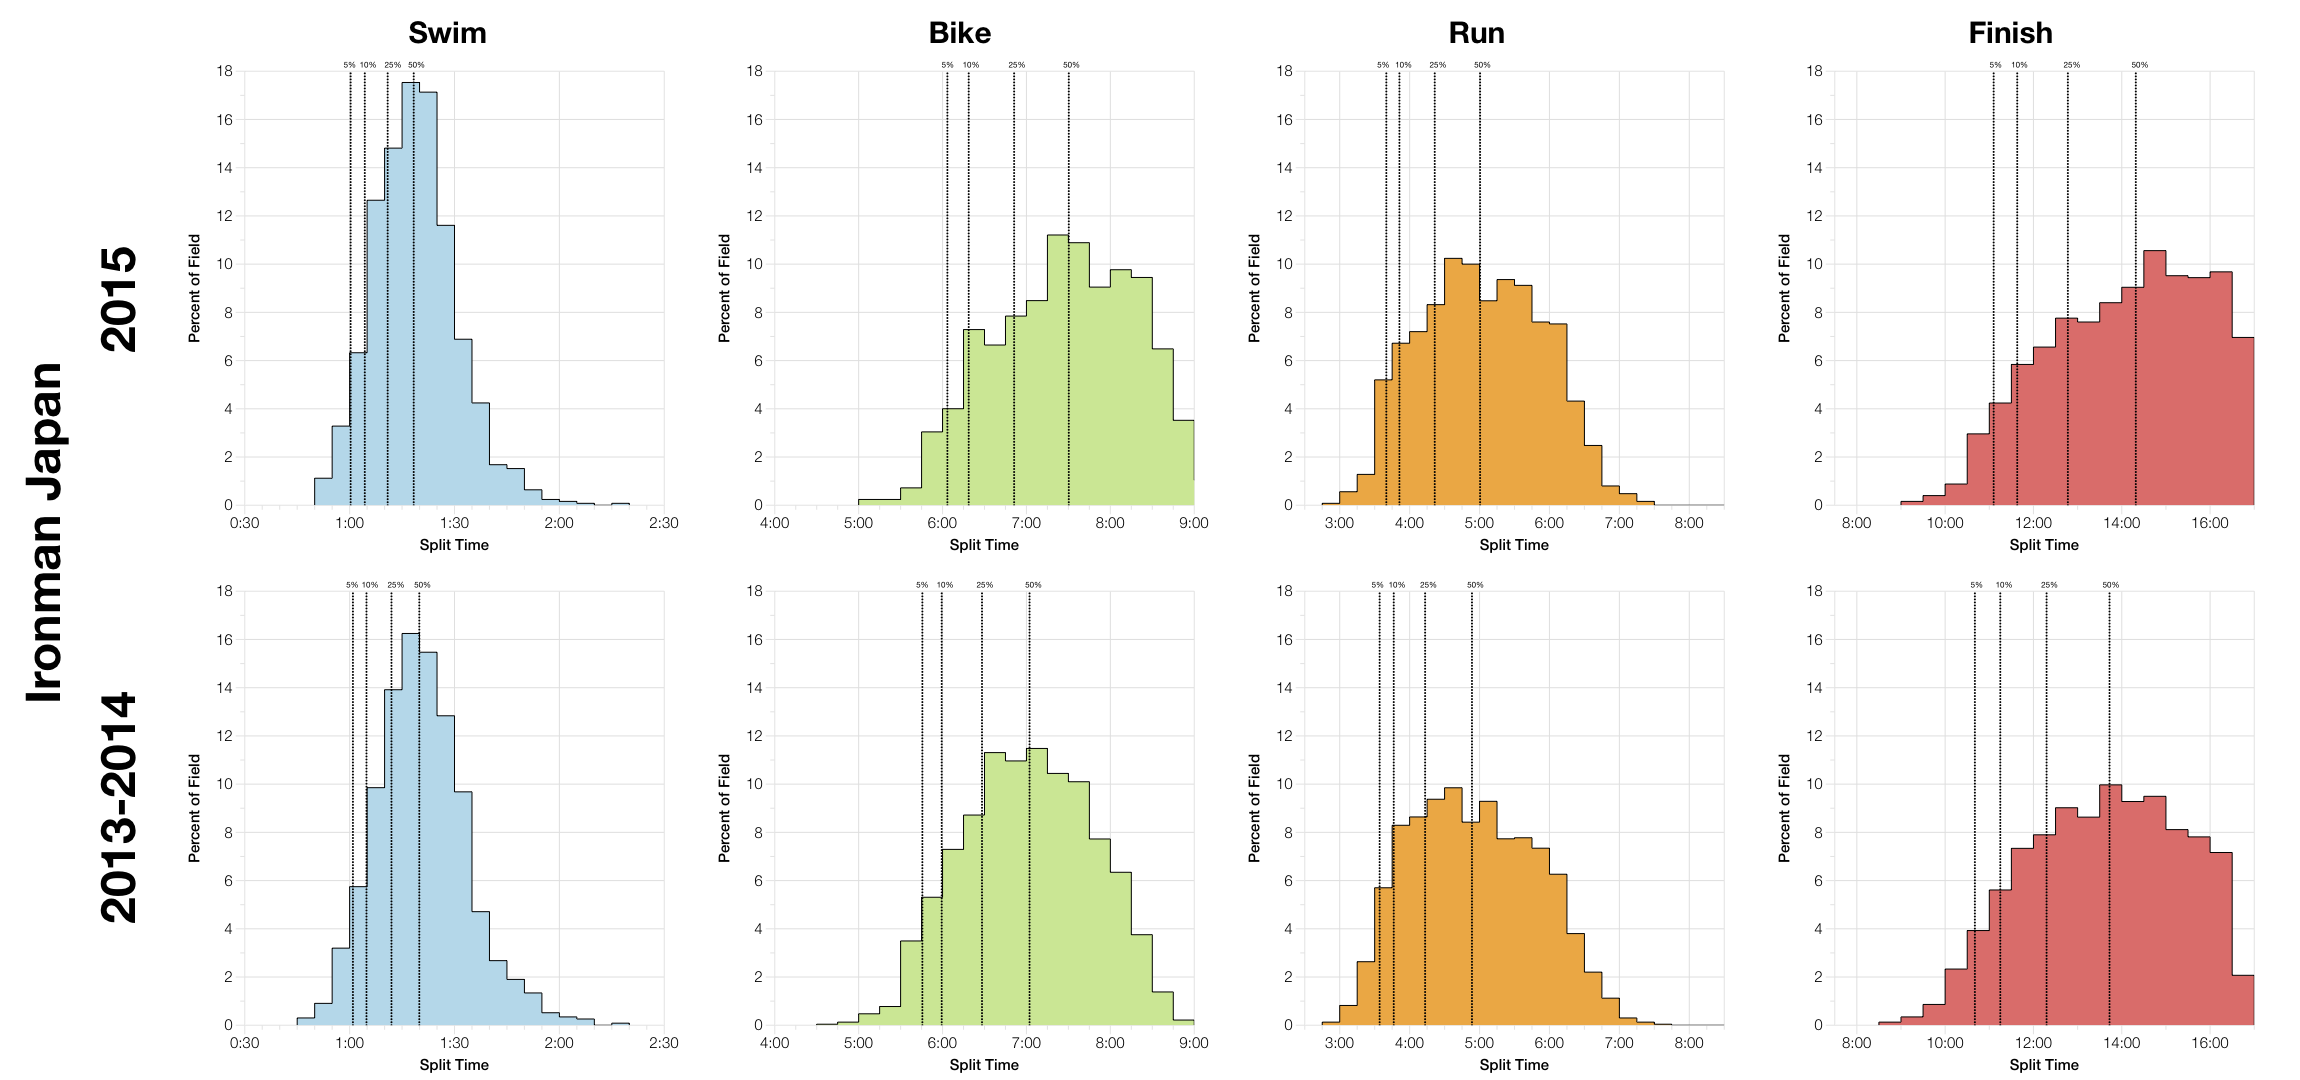
I’m going to start with the split distributions as these give a better oversight of the race. The swim appears to have been very slightly faster this year, but both bike and run are slower. The big difference comes on the bike, I had to adjust the scale for the charts given so many athletes took longer than 8:30 for the ride. Times are in the region of 30 minutes slower on average and this carries through to overall finishing splits. That’s a substantial change for a race suggestive of particularly tough conditions.
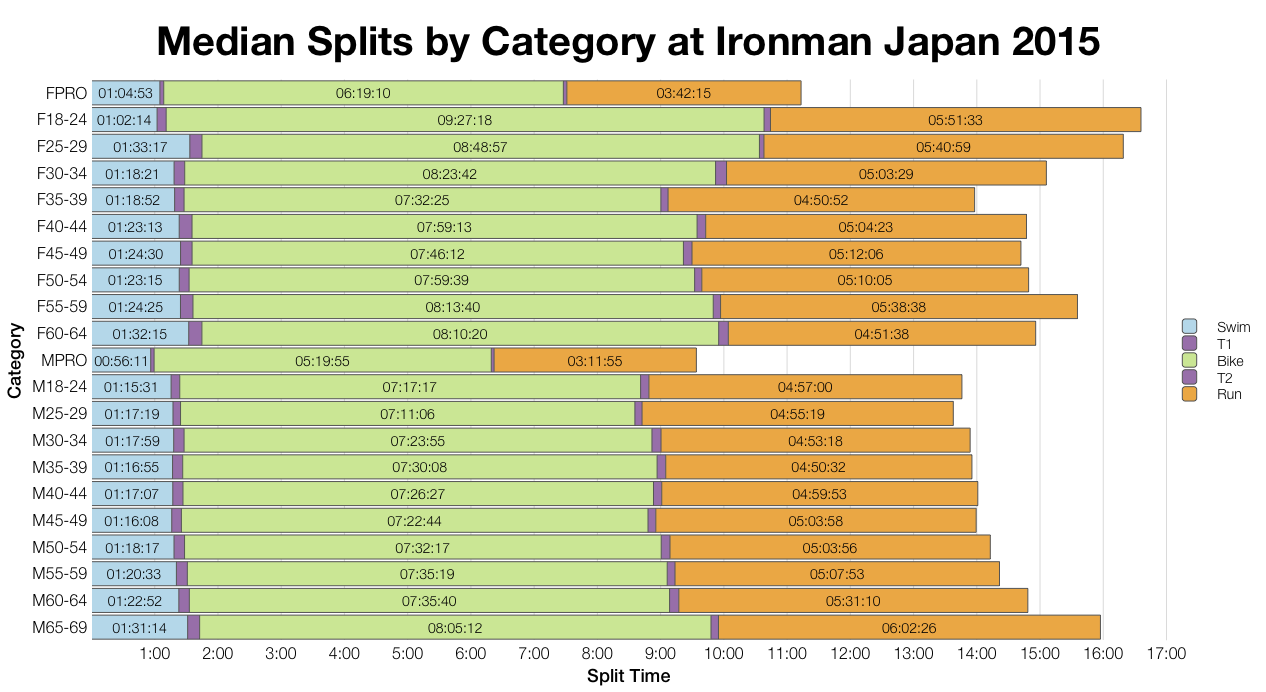
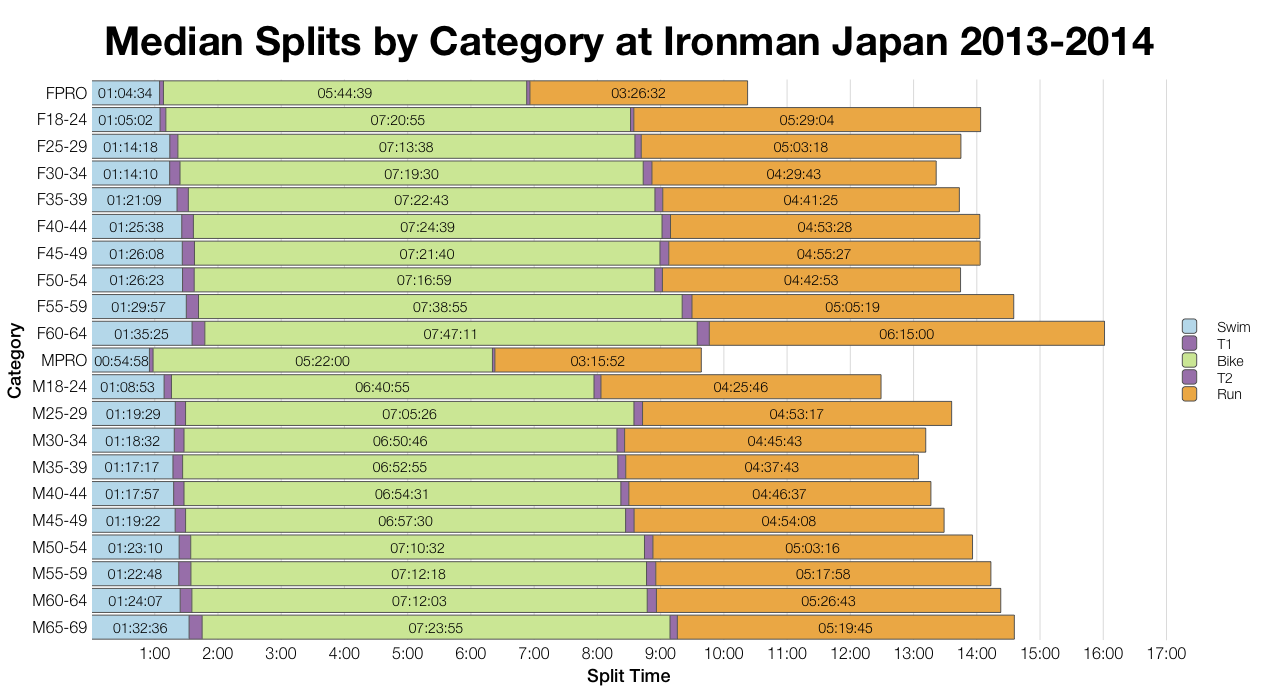
Medians reflect this pattern. Bike and run splits are near universally slower, the sole exception being the male pros who actually trended faster than the previous 2 years. Focussing on the age groupers it’s clear that this year’s race proved a lot more challenging for the field.
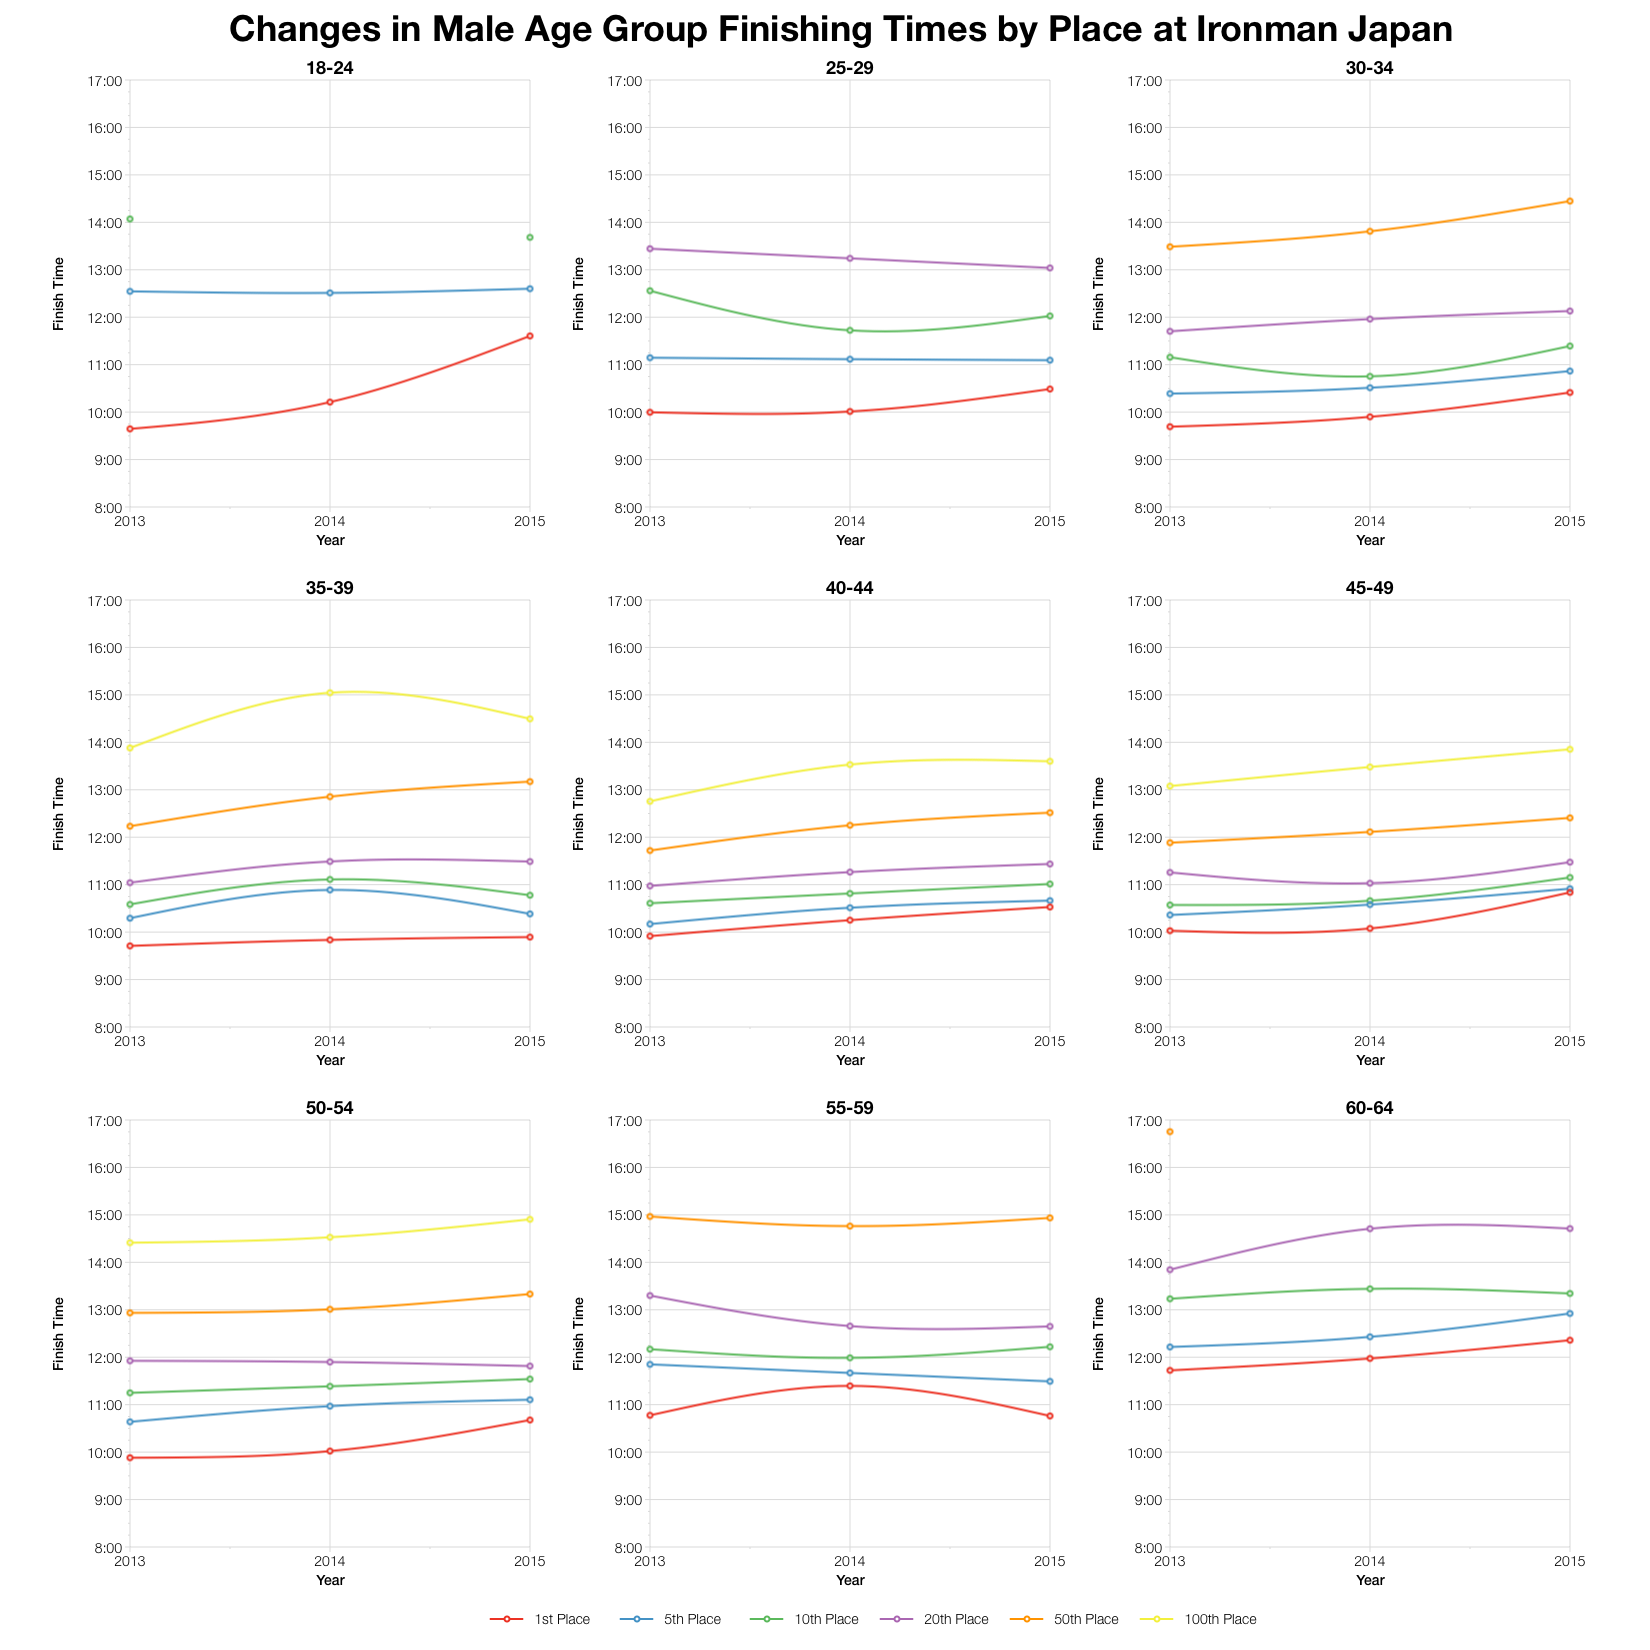
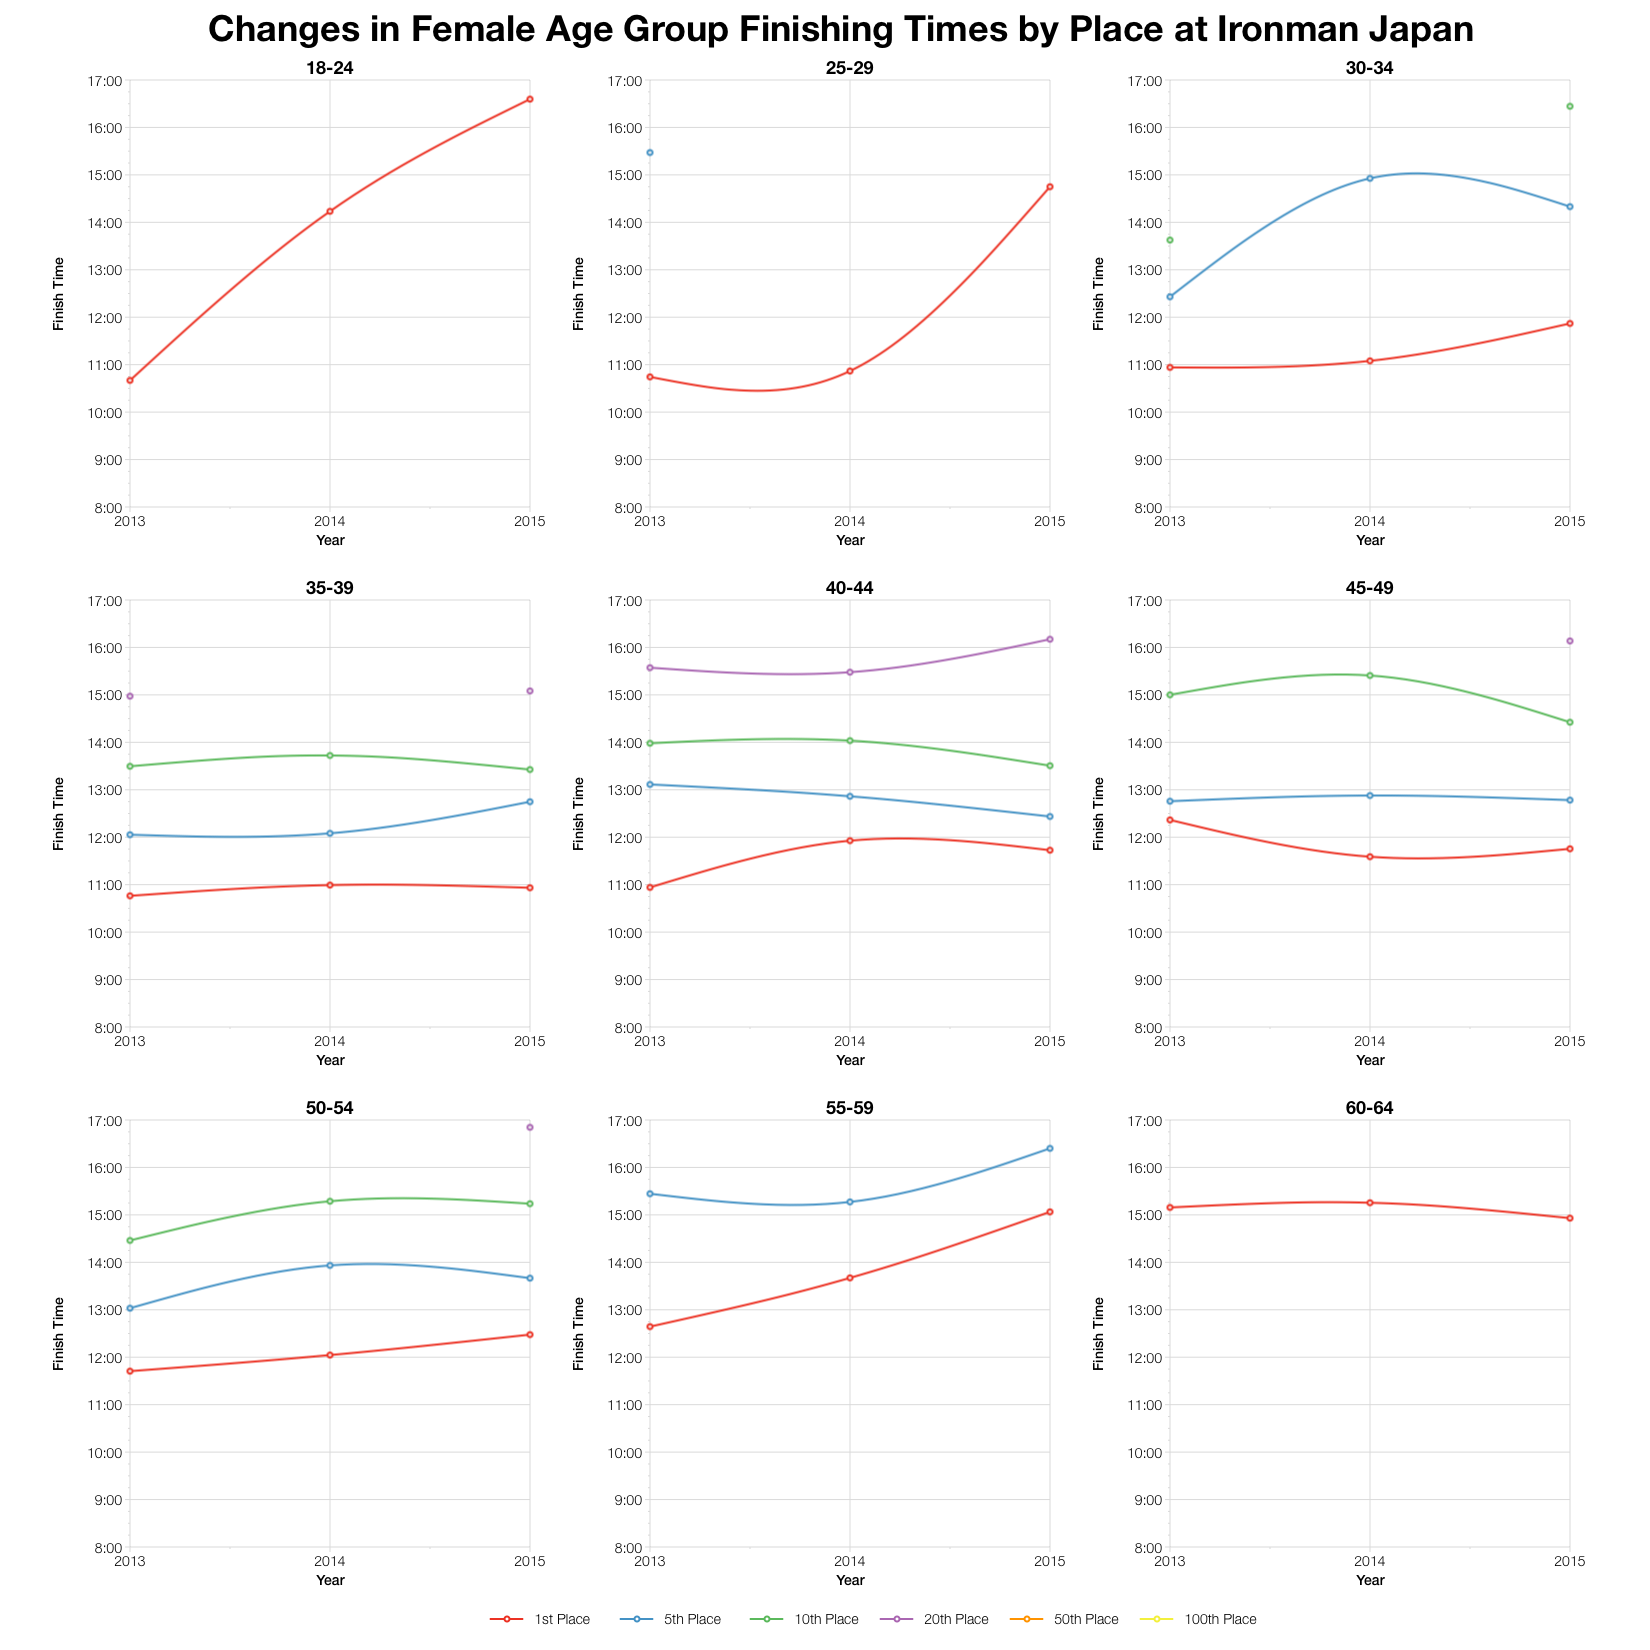
Looking at how times have trended since the relaunch at Lake Toya and this year is generally the slowest so far. Of course a few age groups or race placings buck the trend, there are those who remained consistent with previous results. Variation in depth of field is a factor in these statistics and with smaller races like Japan the impact may be more obvious.
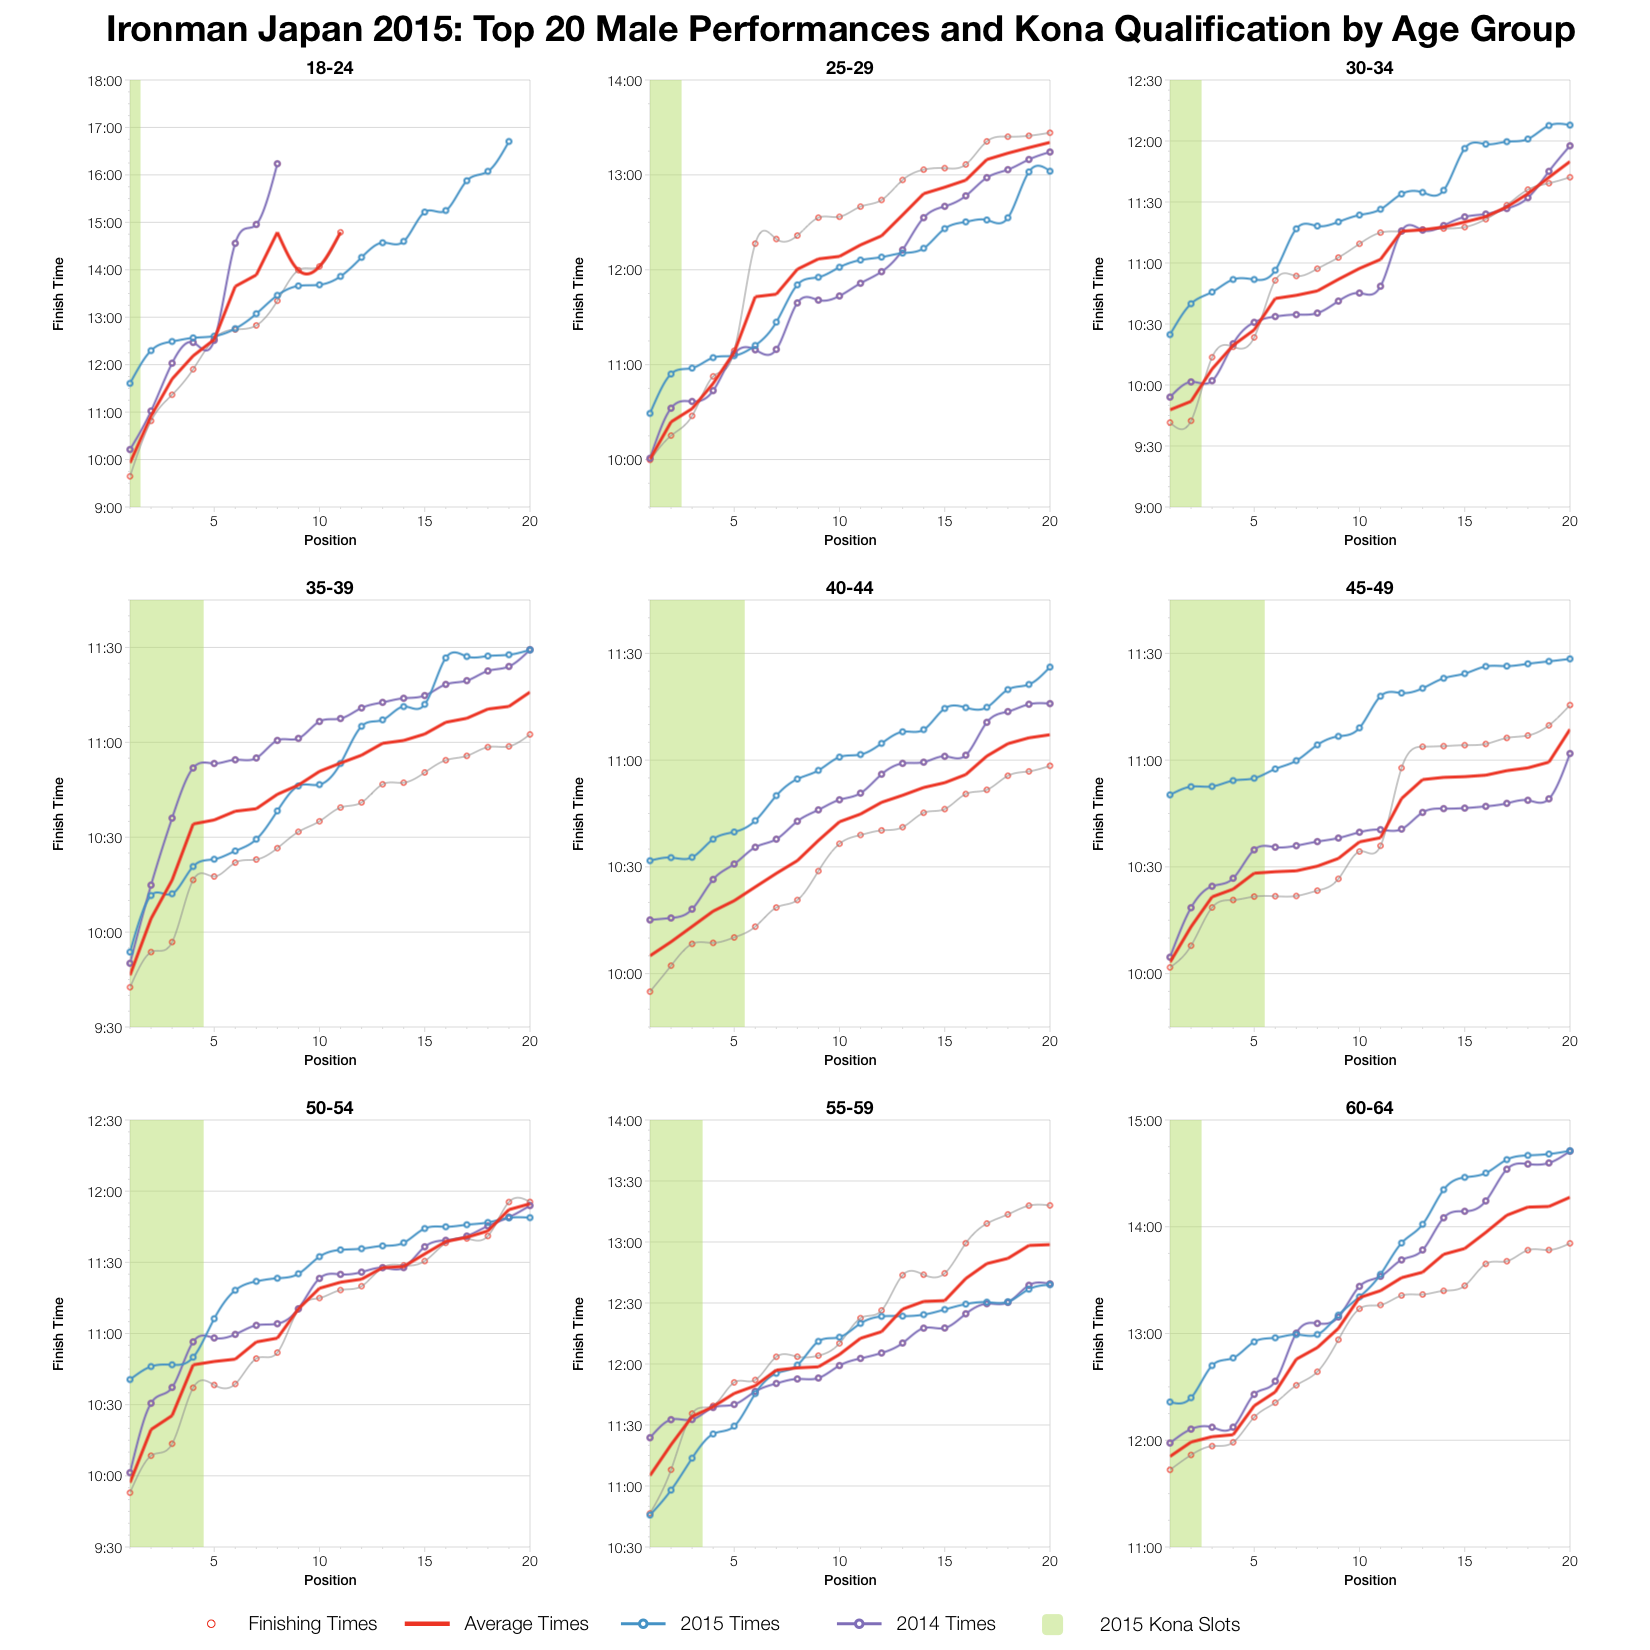
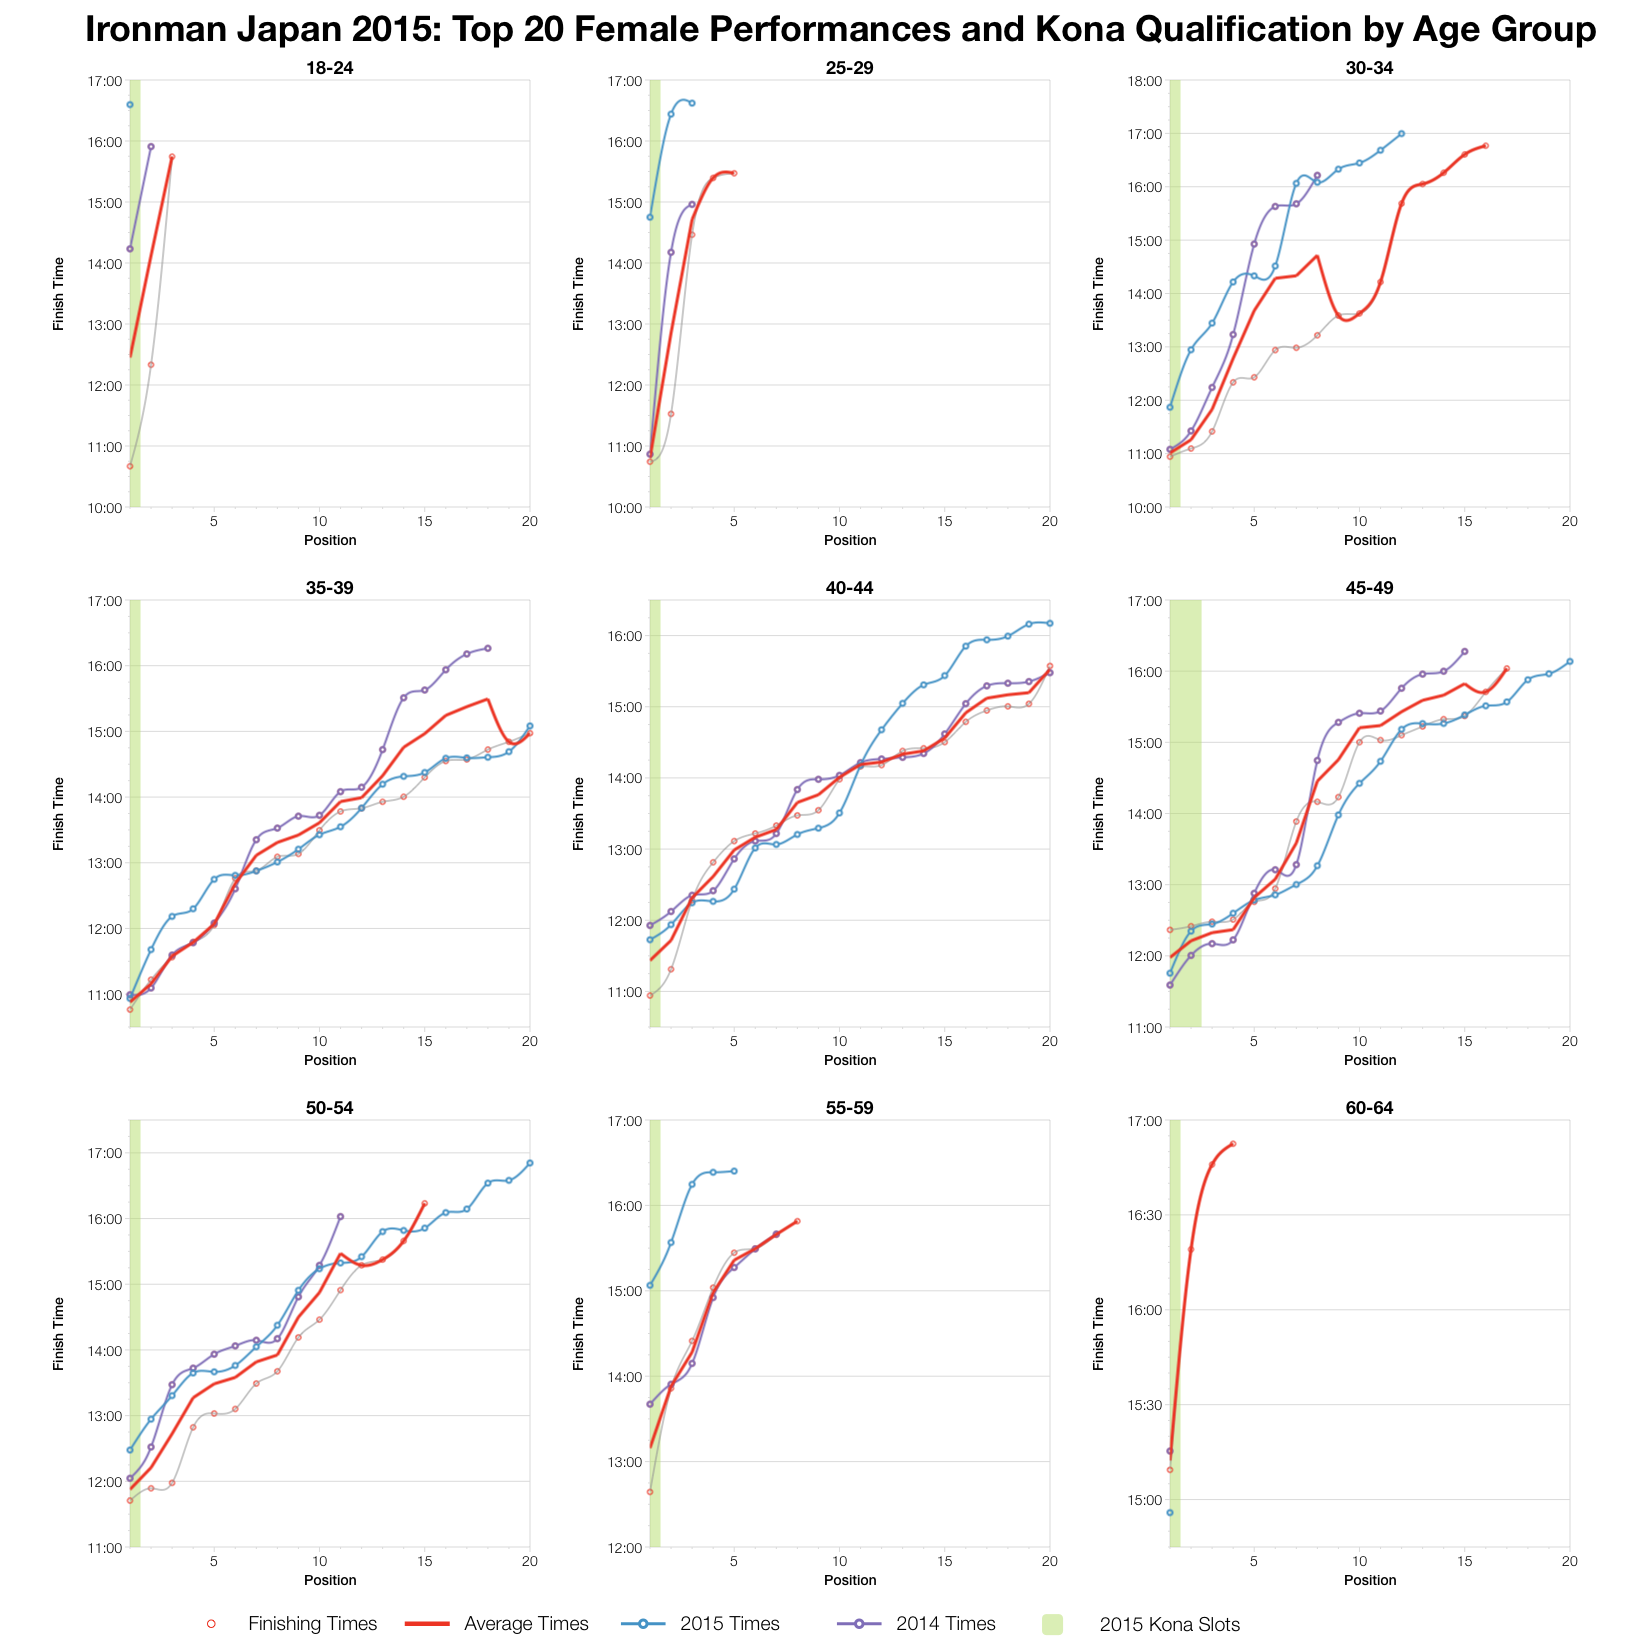
At the front of the race there’s a little more variation. For the most part women’s age groups trend close to the average. In the male age groups far more are slower than average although it’s not as universal as the shift in median times might suggest. The front of the age group race wasn’t so far off expectations suggesting conditions had more impact at the middle to back of pack.
You can access a spreadsheet of the full results and splits from Ironman Japan 2015 on my Google Drive.


