After four years of racing, Ironman Wales has firmly established itself among the toughest Ironman races on the circuit. The course itself is slow, but throw September’s weather on top of that and results take a dive. This year’s race, the fifth at Tenby, is no exception. Conditions appear to have been tough and 2015 times trend slower than average for the race.
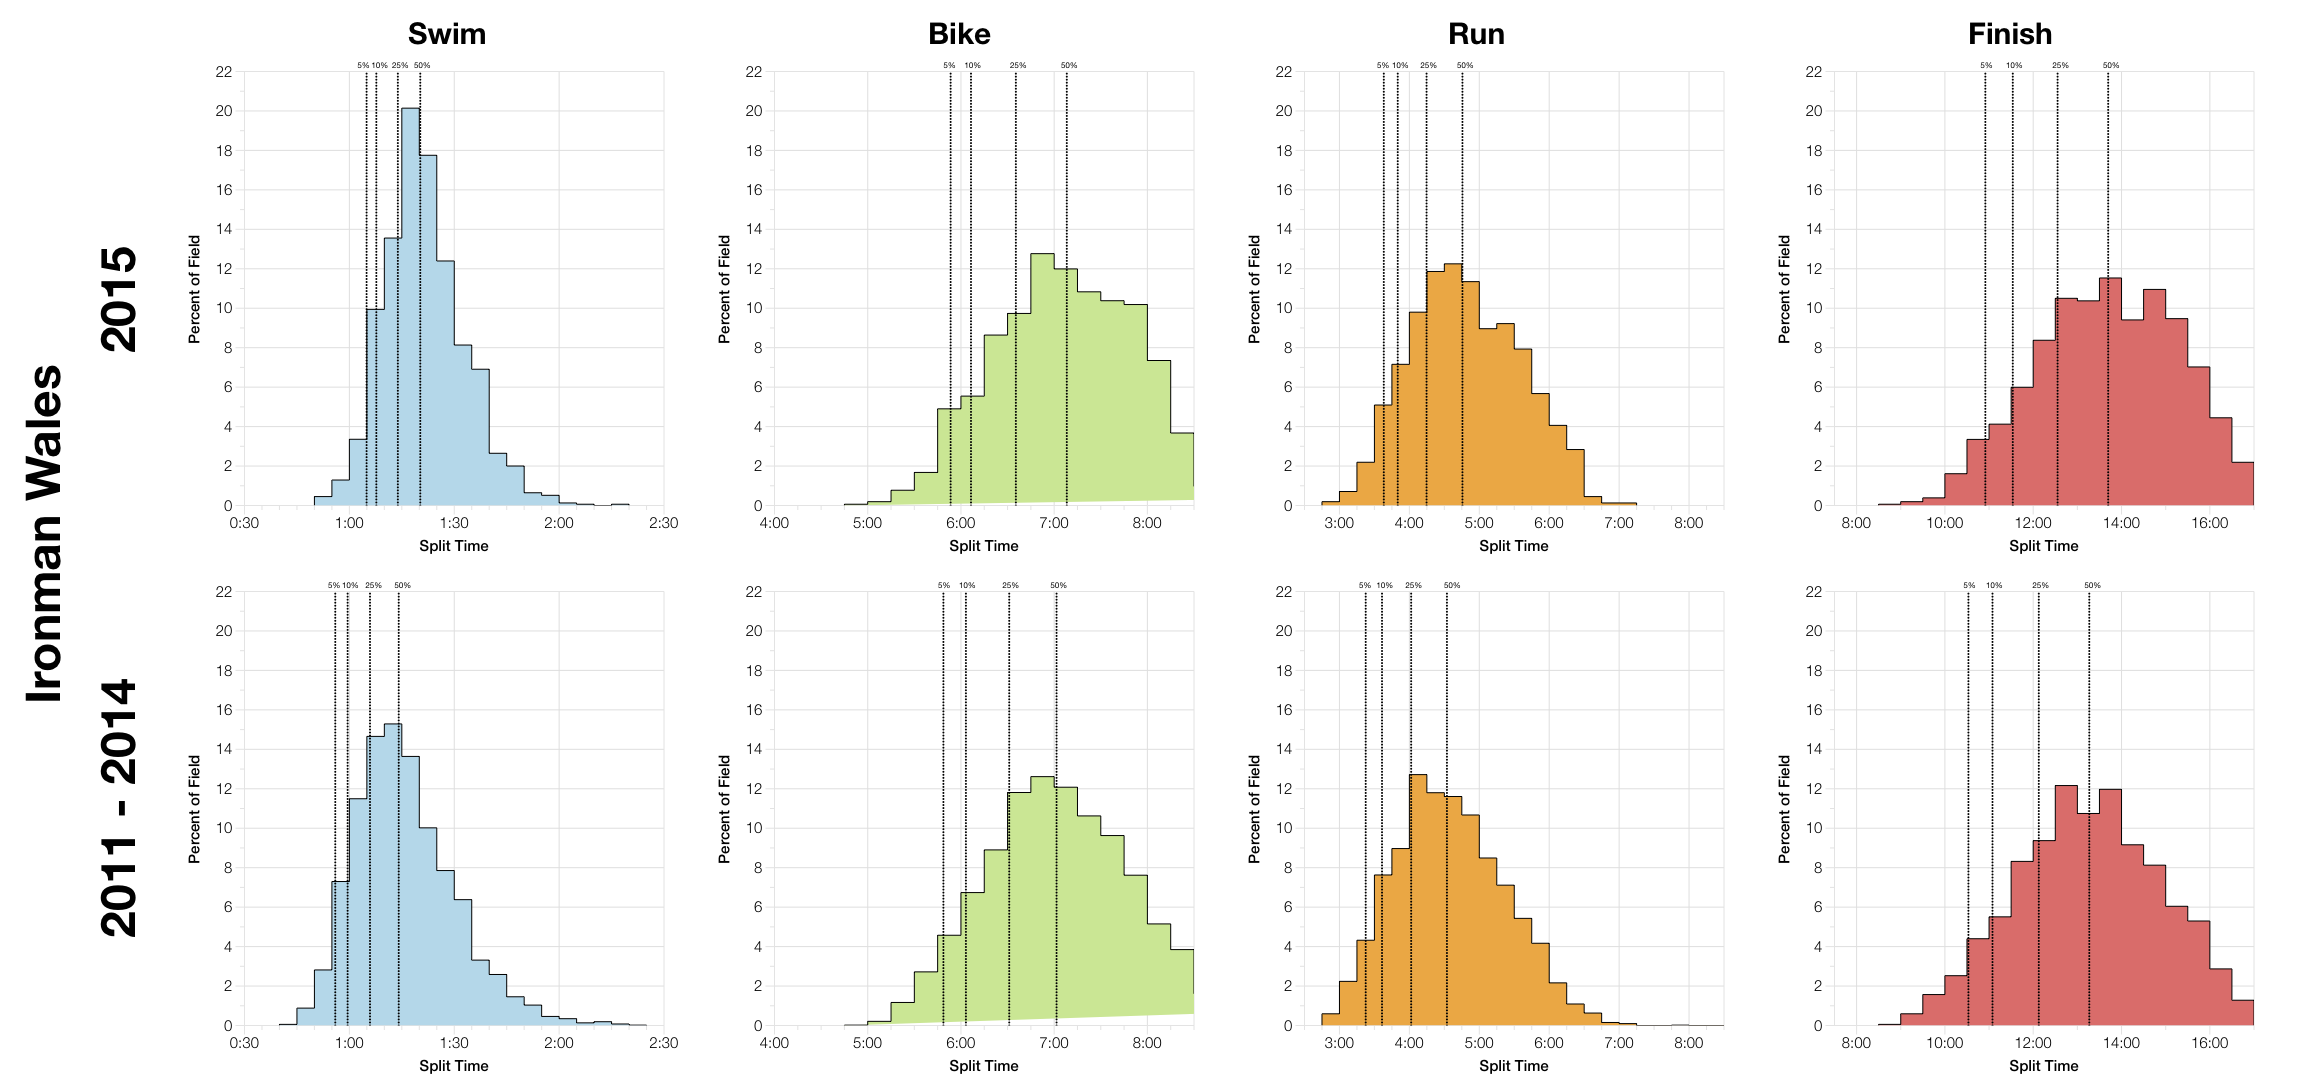
The simplest way to see this is through the split distributions, comparing 2015’s results against those of the previous four years. The biggest difference, relatively at least, is on the swim where times are a good 5-10 minutes slower than usual. That’s followed by a slightly slower bike and then a run that shows a similar shift of 10 minutes towards the right. With all three disciplines trending slower than previous years finishing times follow suit and come out a good 20-30 minutes behind.
Before I continue, it should be mentioned that in previous years some elements of the course have varied which will have a bearing on results comparisons. This affect is most notable at the front-of-pack, for example where we see large shifts in run times for the top 5% of athletes this is under the influence of 2012’s shorter run.
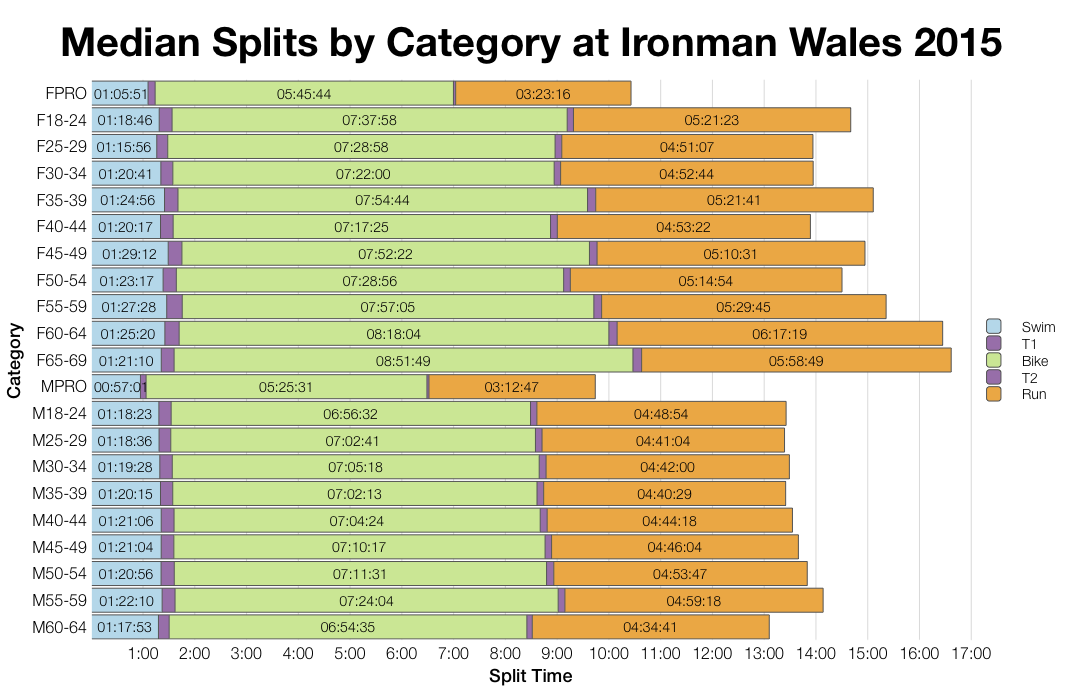
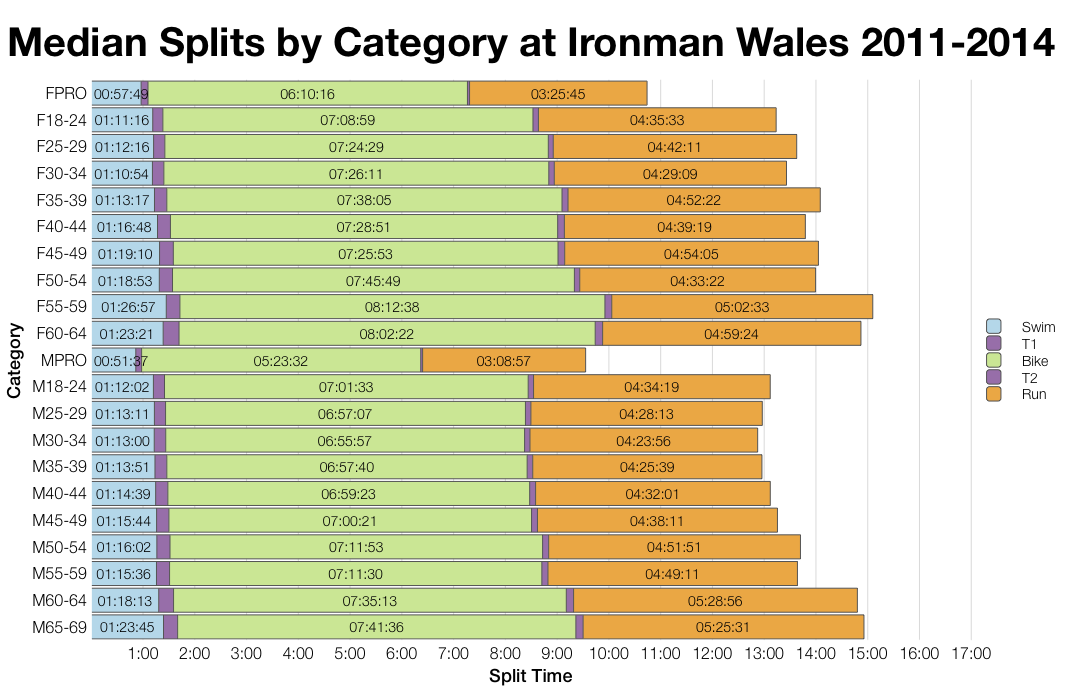
At the individual category level the trends are generally the same: distinctly slower swim and run, but a similar bike to before. Of course there are exceptions, but the one that stands out comes from the pros. Strong performances among the female pros saw much faster bike splits this year and slightly faster runs. Not many other groups improved on previous averages.
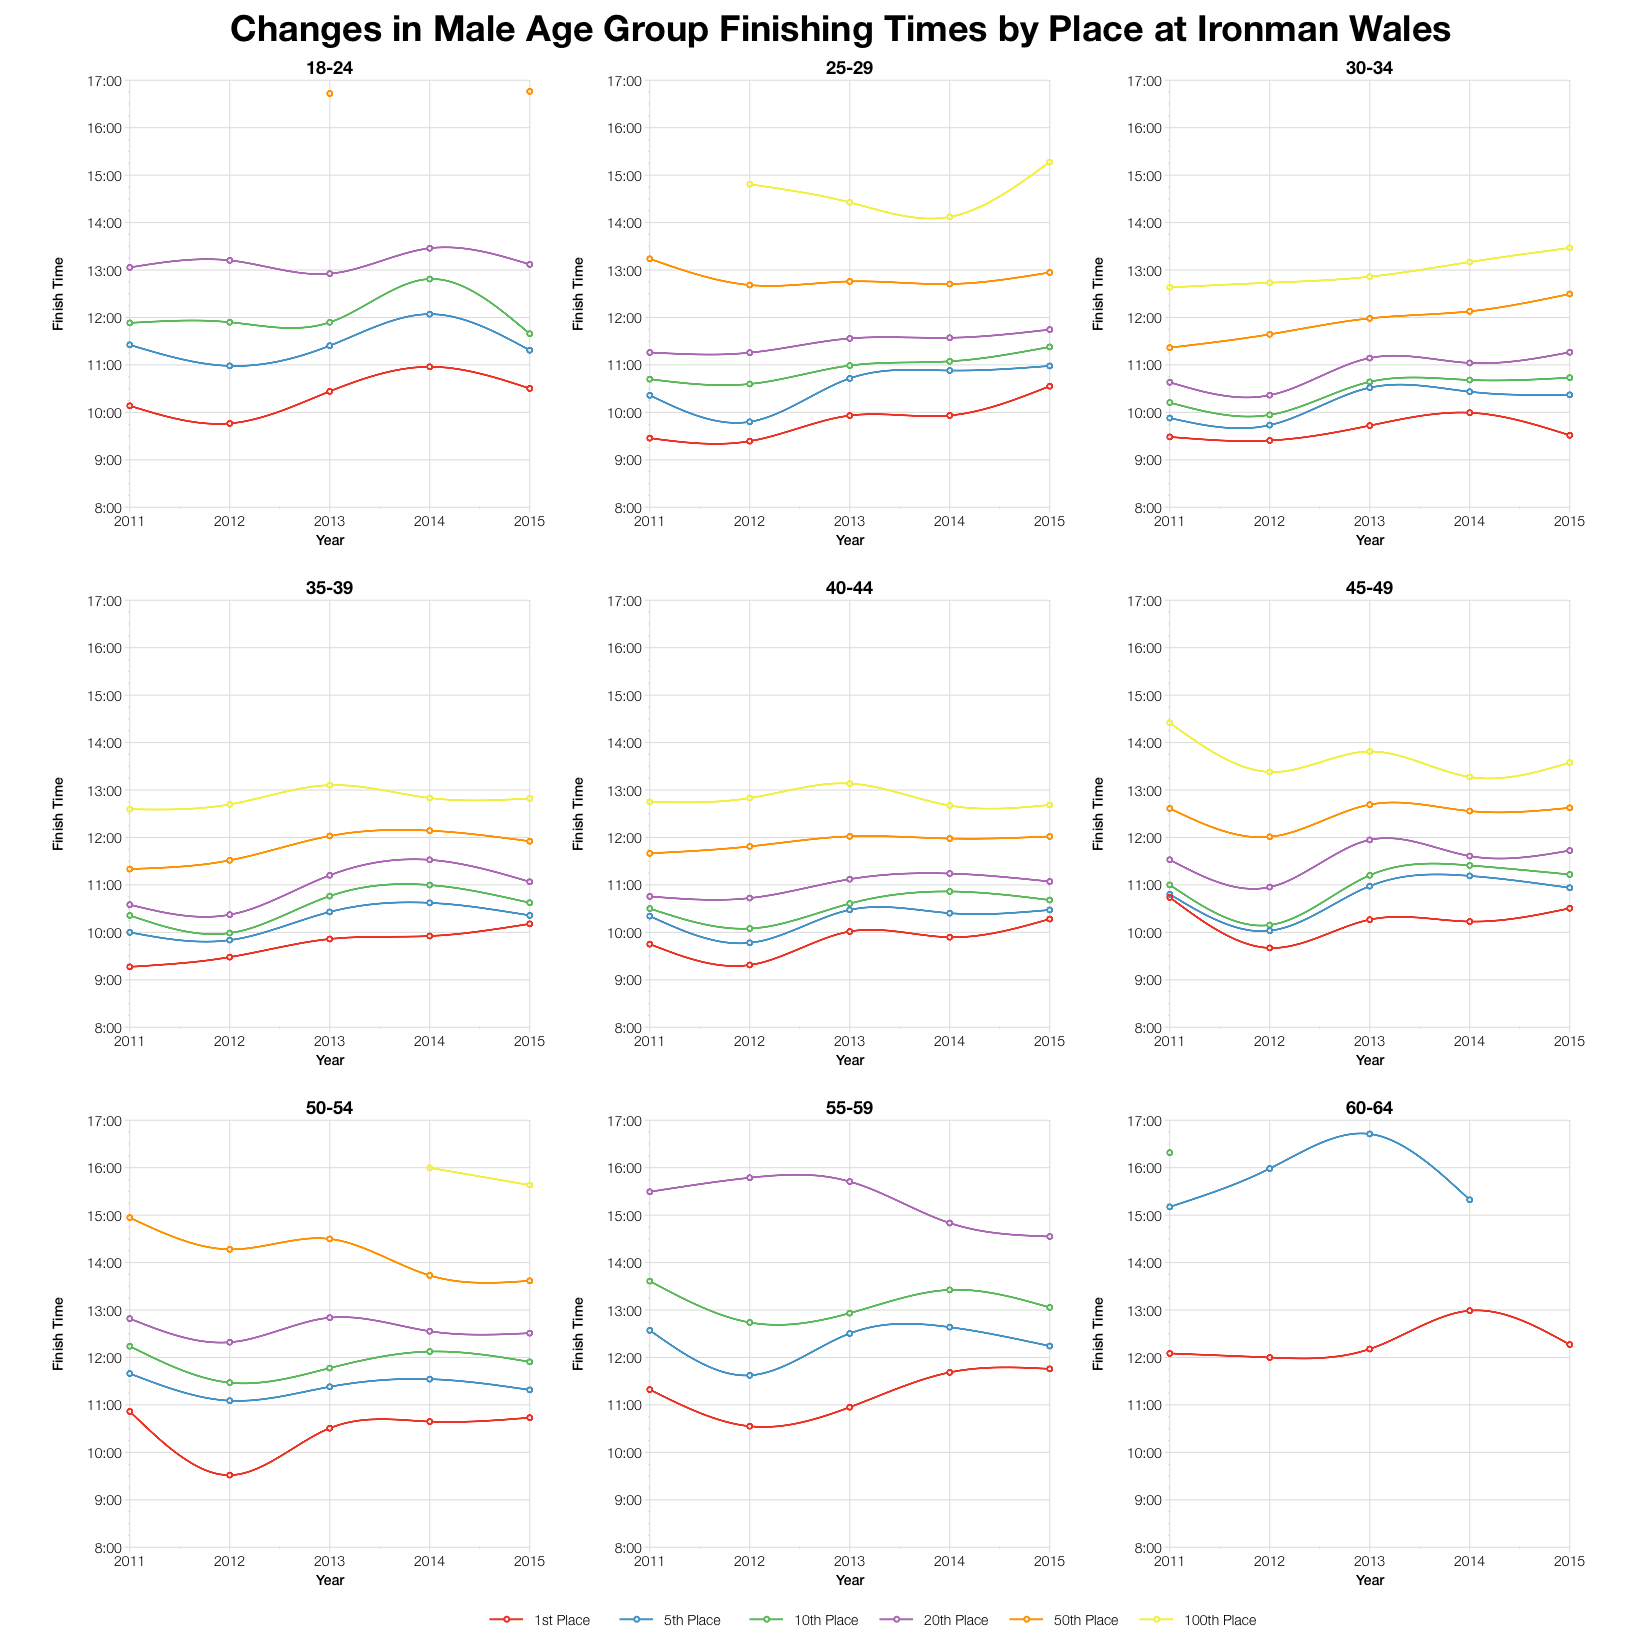
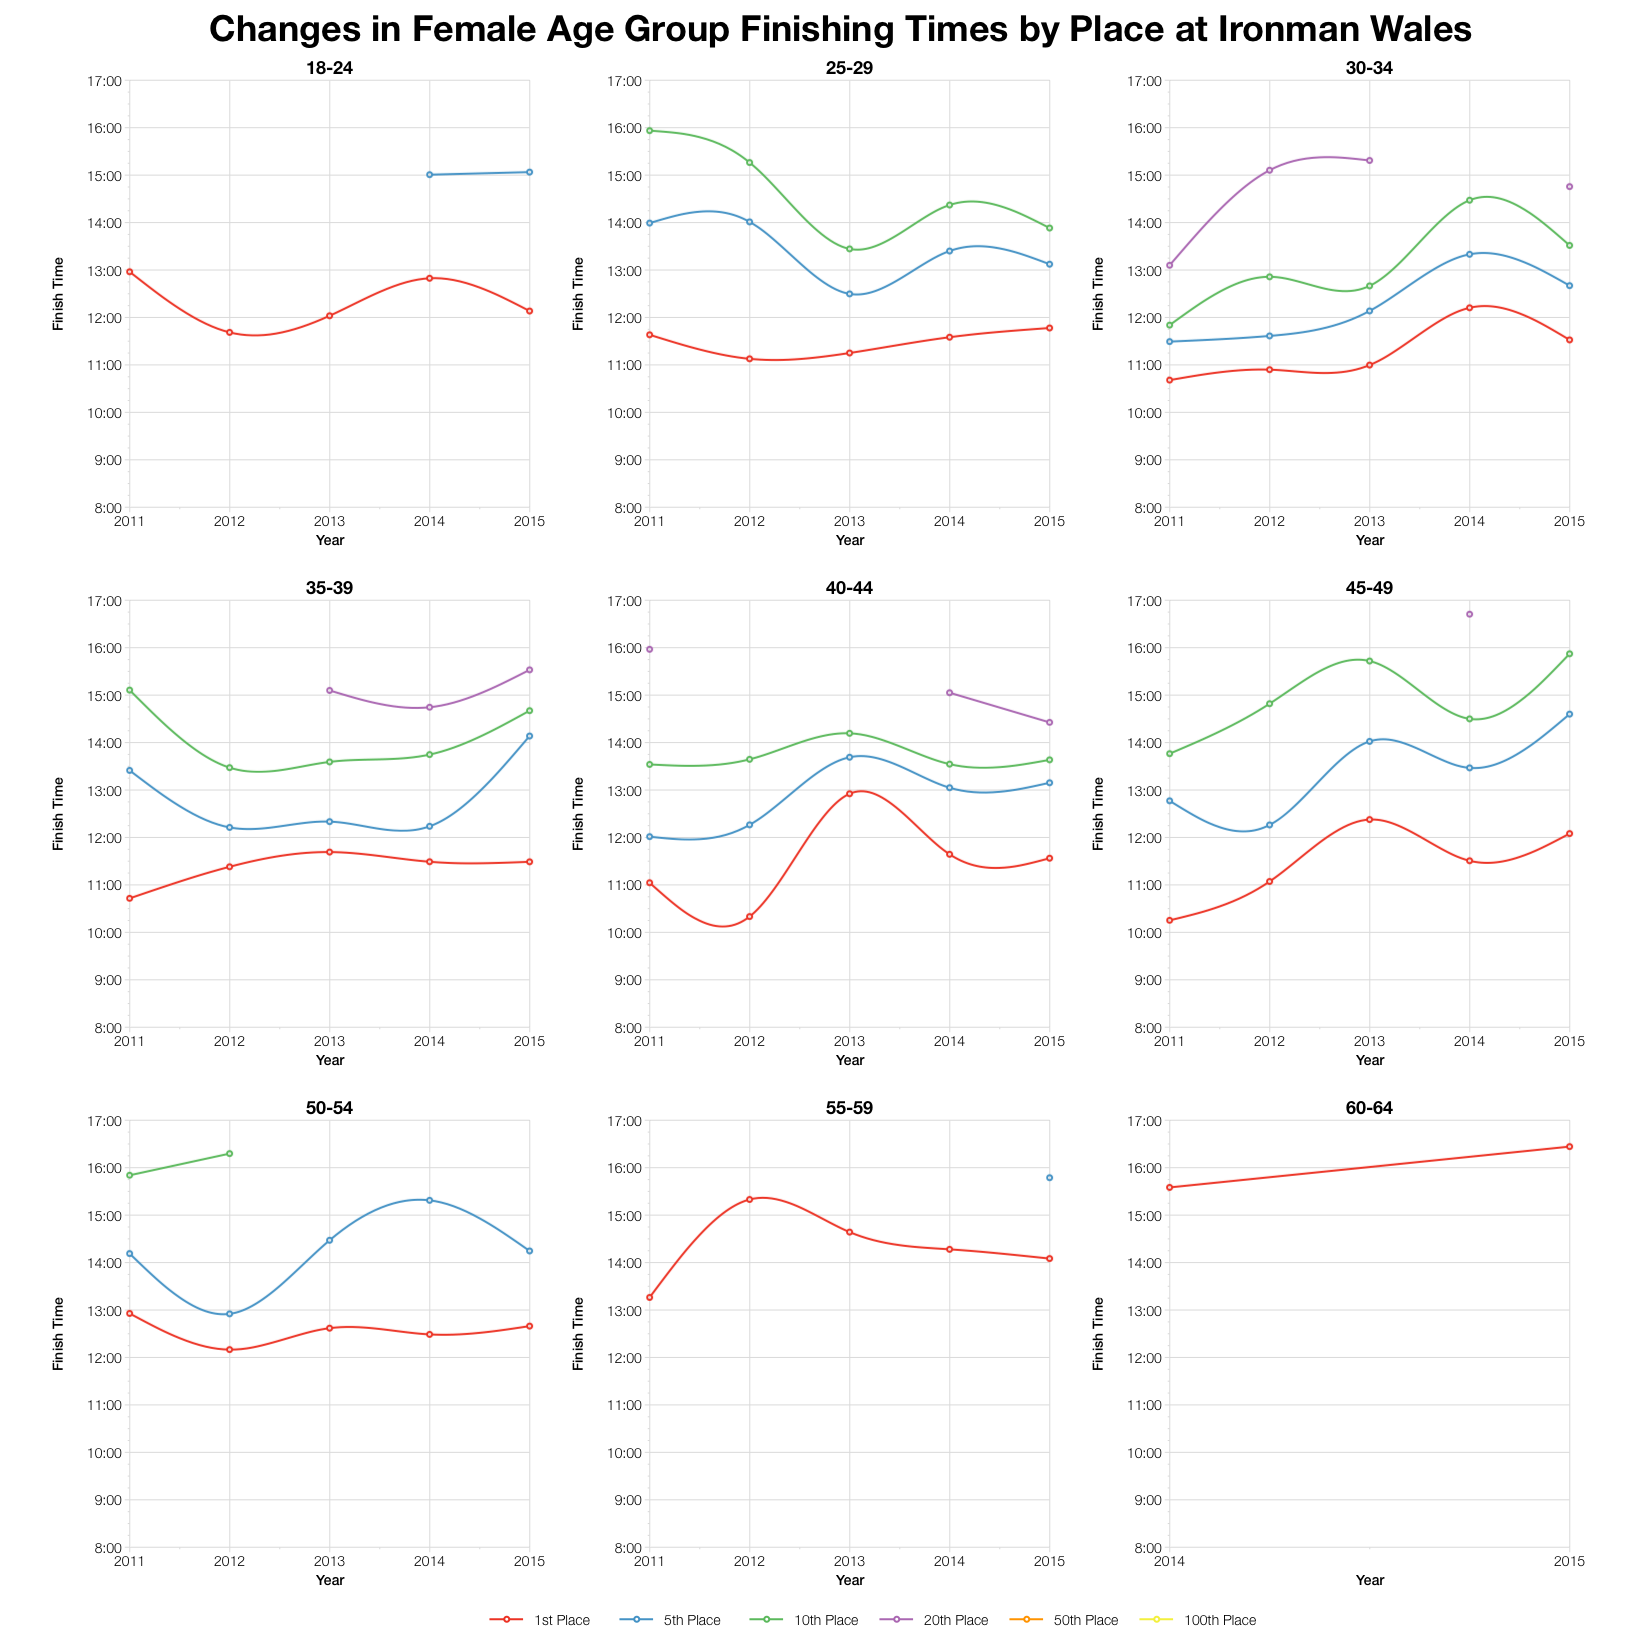
If we look at the times required by position within an age group over the last 5 years then this year doesn’t appear to be quite so slow. There’s actually not much to choose between the last three years of results. It was enough to make me double check that 2012’s faster results weren’t unduly influencing these charts, but removing them has little impact. While it’s safe to say 2015 was a slow year for Wales, it wasn’t an exceptionally slow year.
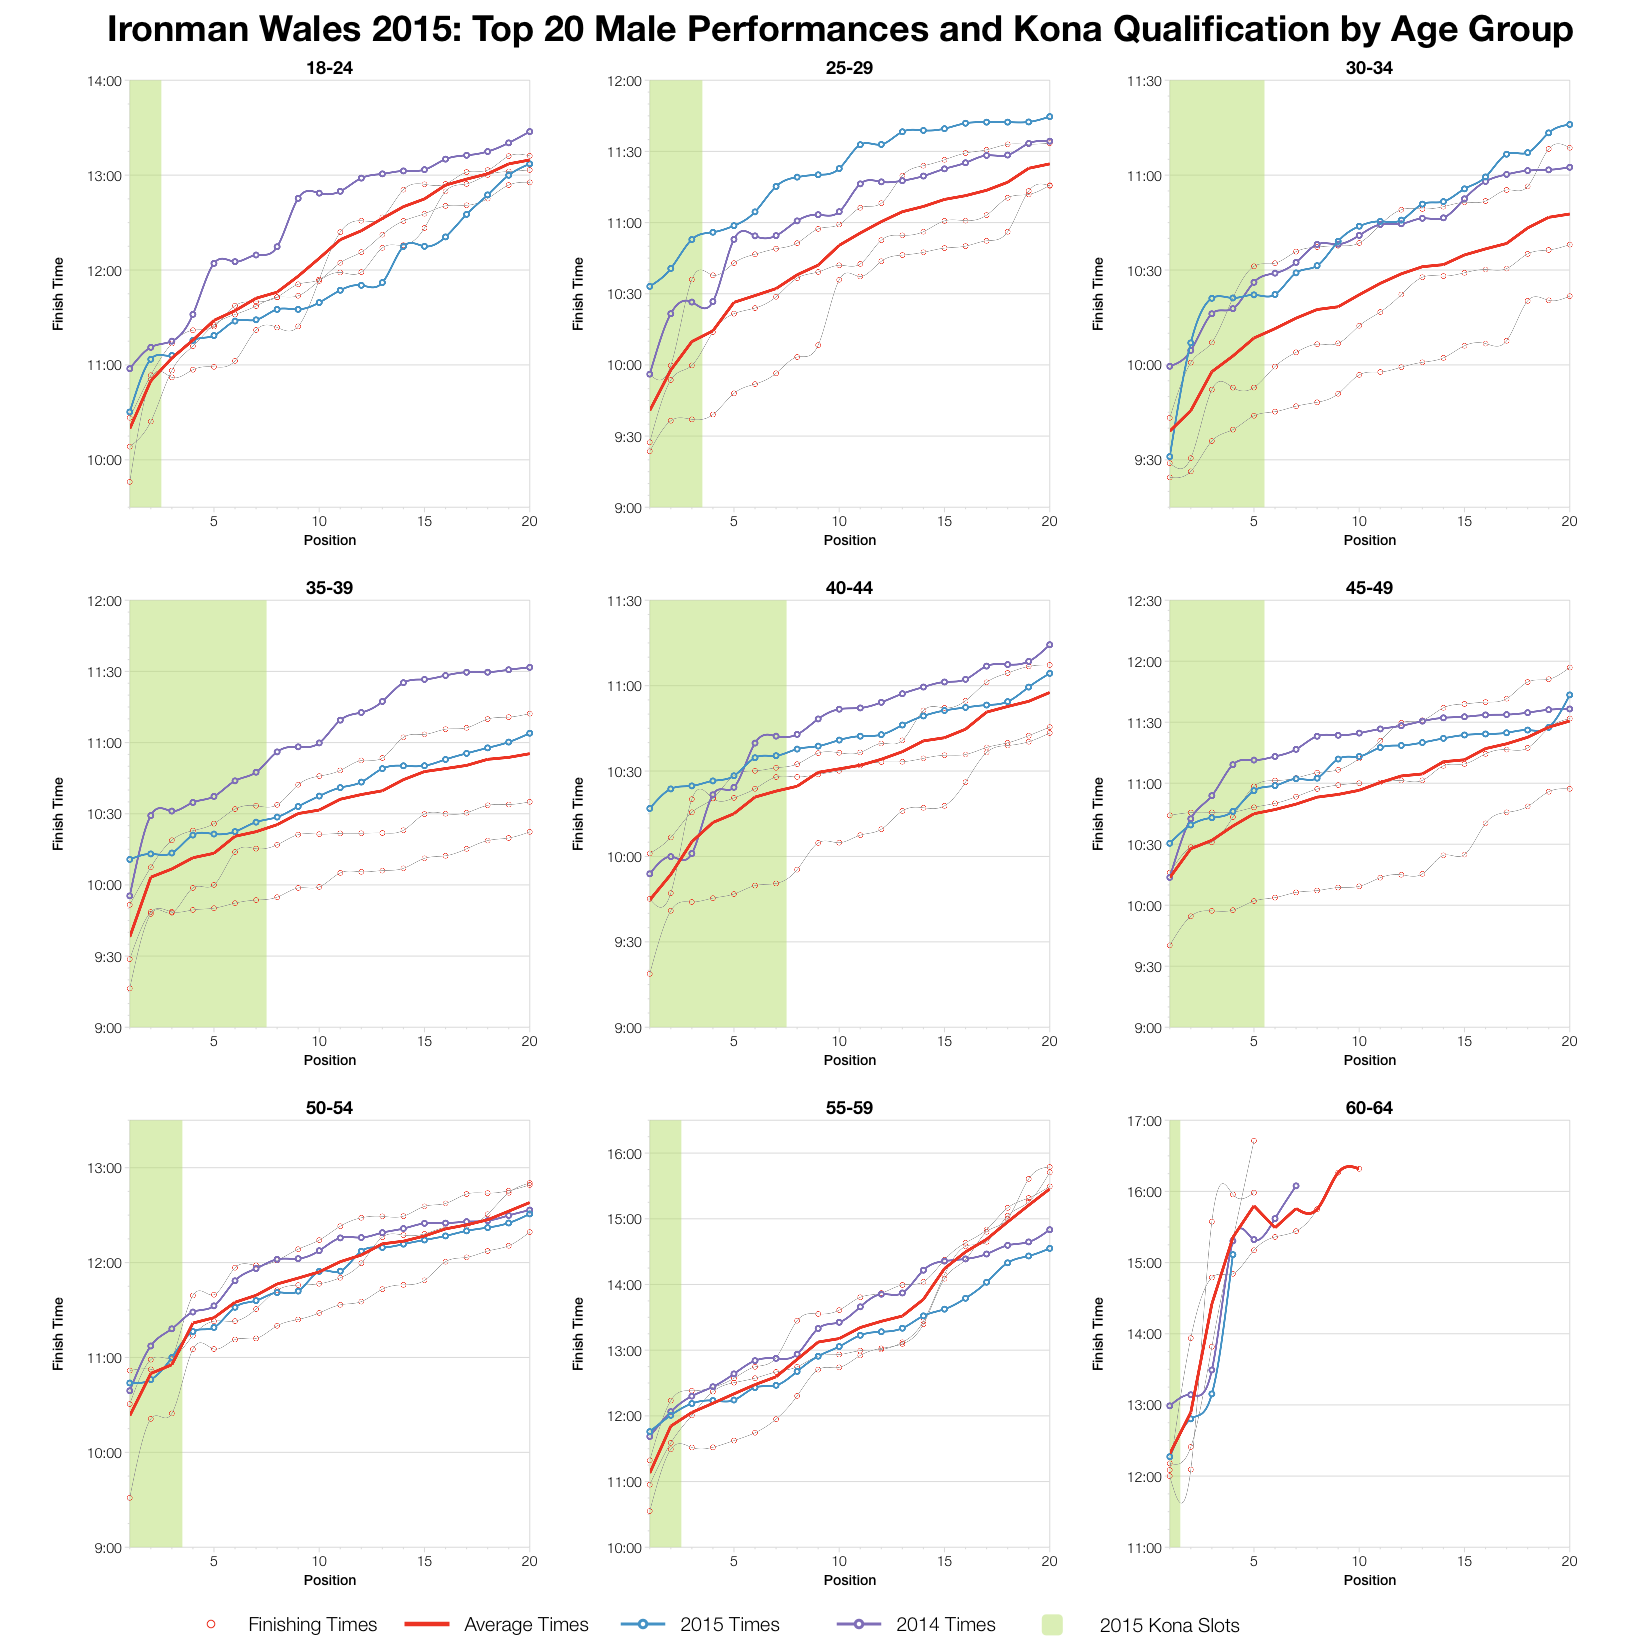
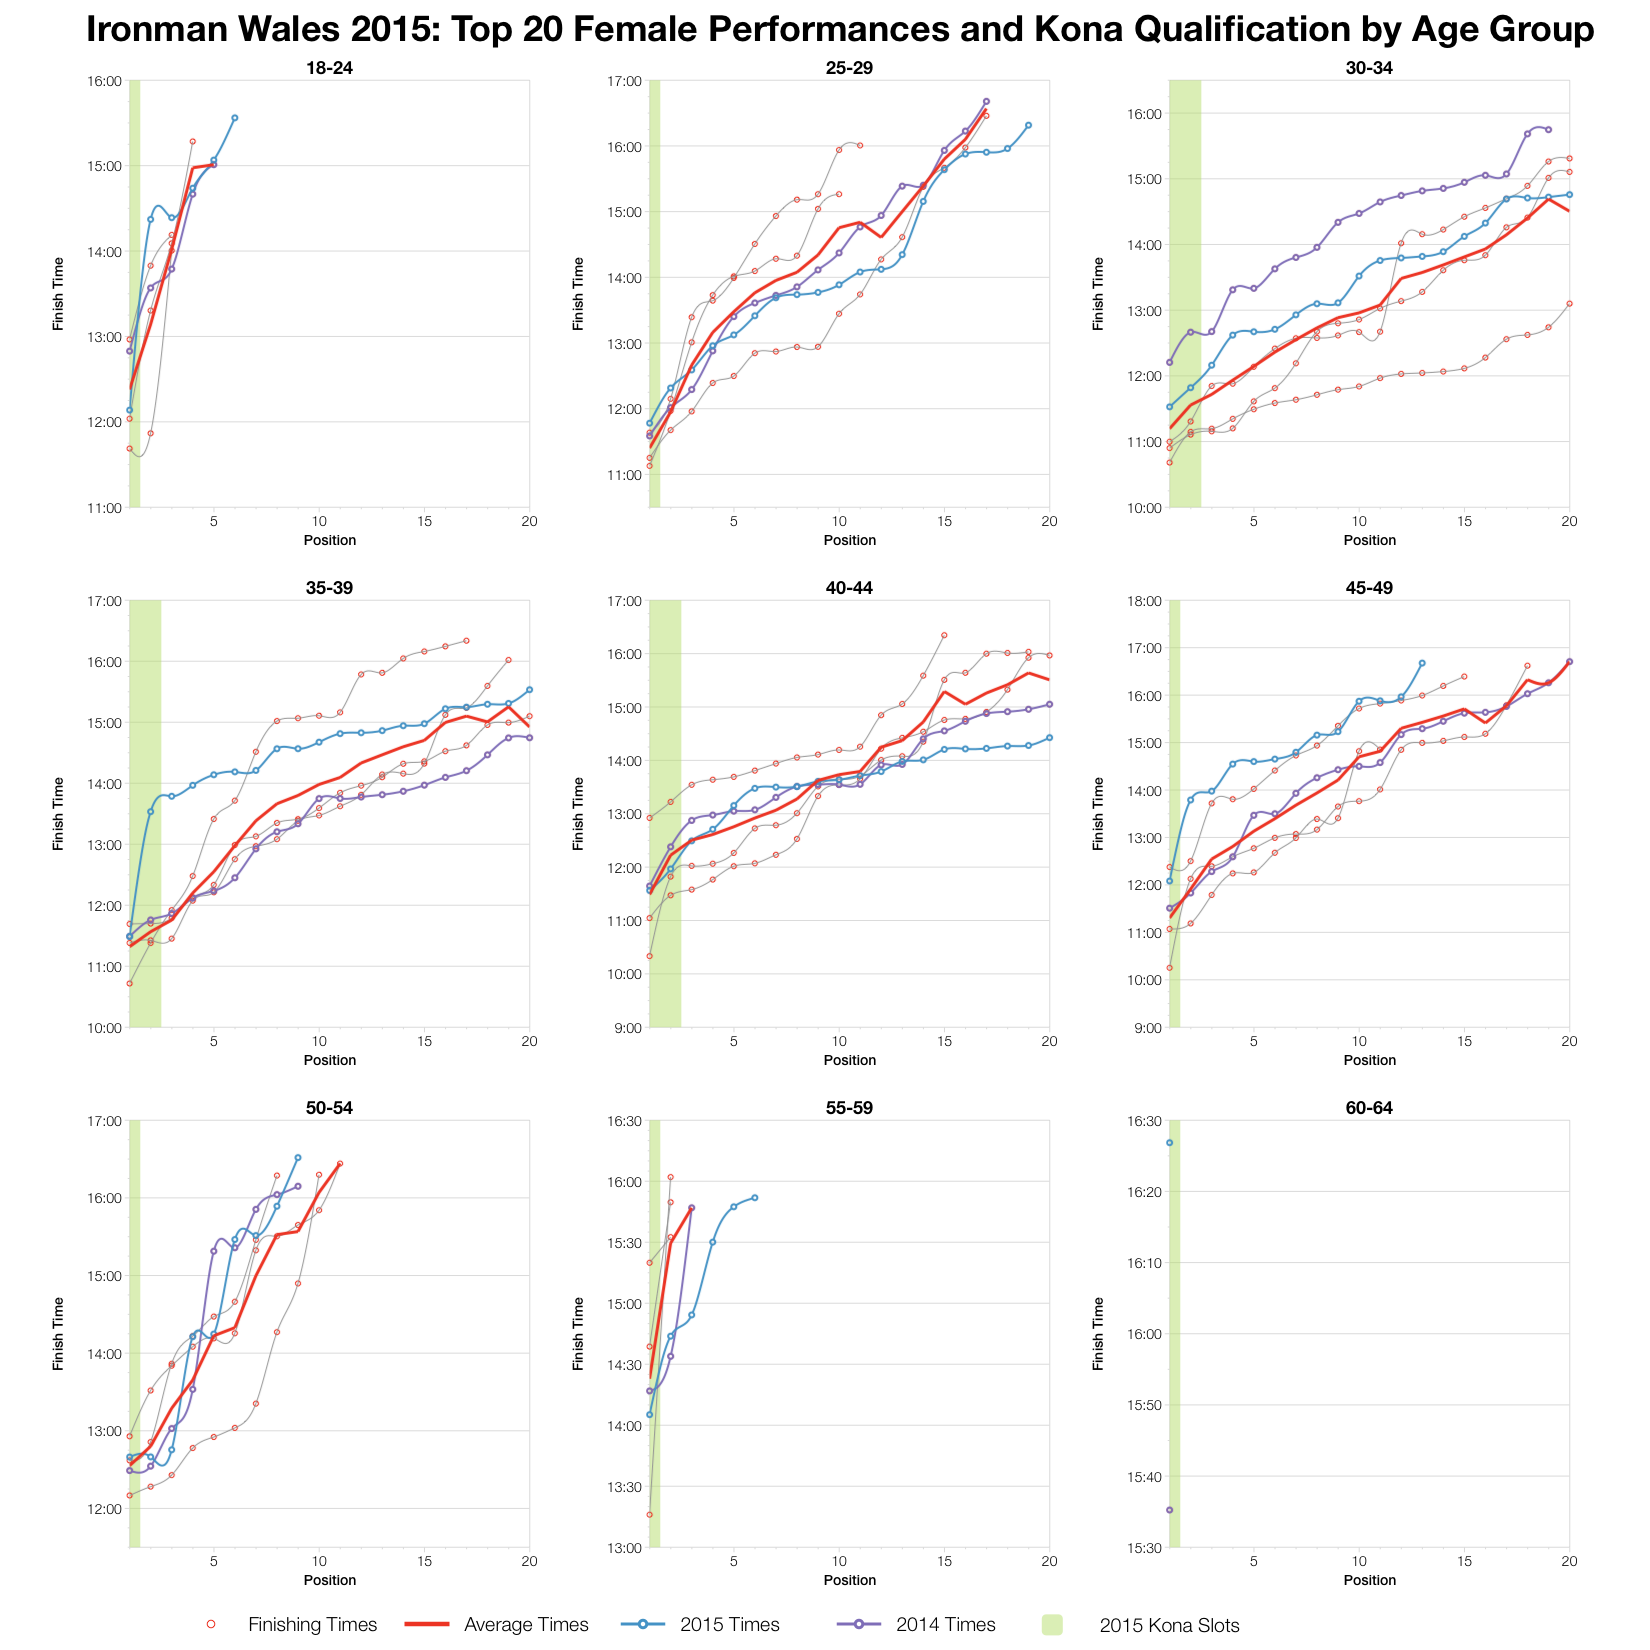
Looking over the top 20 in each age group we can say that, in most cases, 2015 results are slower than average and that, in many cases, they lie among the slowest. It’s a close battle with 2014 though. Kona qualification times are broadly slower than average, but there are a few exceptional results that buck this trend. In most, but not all, age groups the 2014 results proved a decent guide to this year’s likely qualifying times.
You can access a spreadsheet of the full results and splits from Ironman Wales 2015 on my Google Drive.


