Stats time again, with the Ironman African Championship (Ironman South Africa) taking place on Sunday. As a championship event, South Africa offer a large pool of 75 Kona slots to age group athletes and is usually one of my favoured qualifying spots. It’s never been a fast race, but changes to this year’s bike course have brought splits and overall results down. 2016 was a faster year in Port Elizabeth.
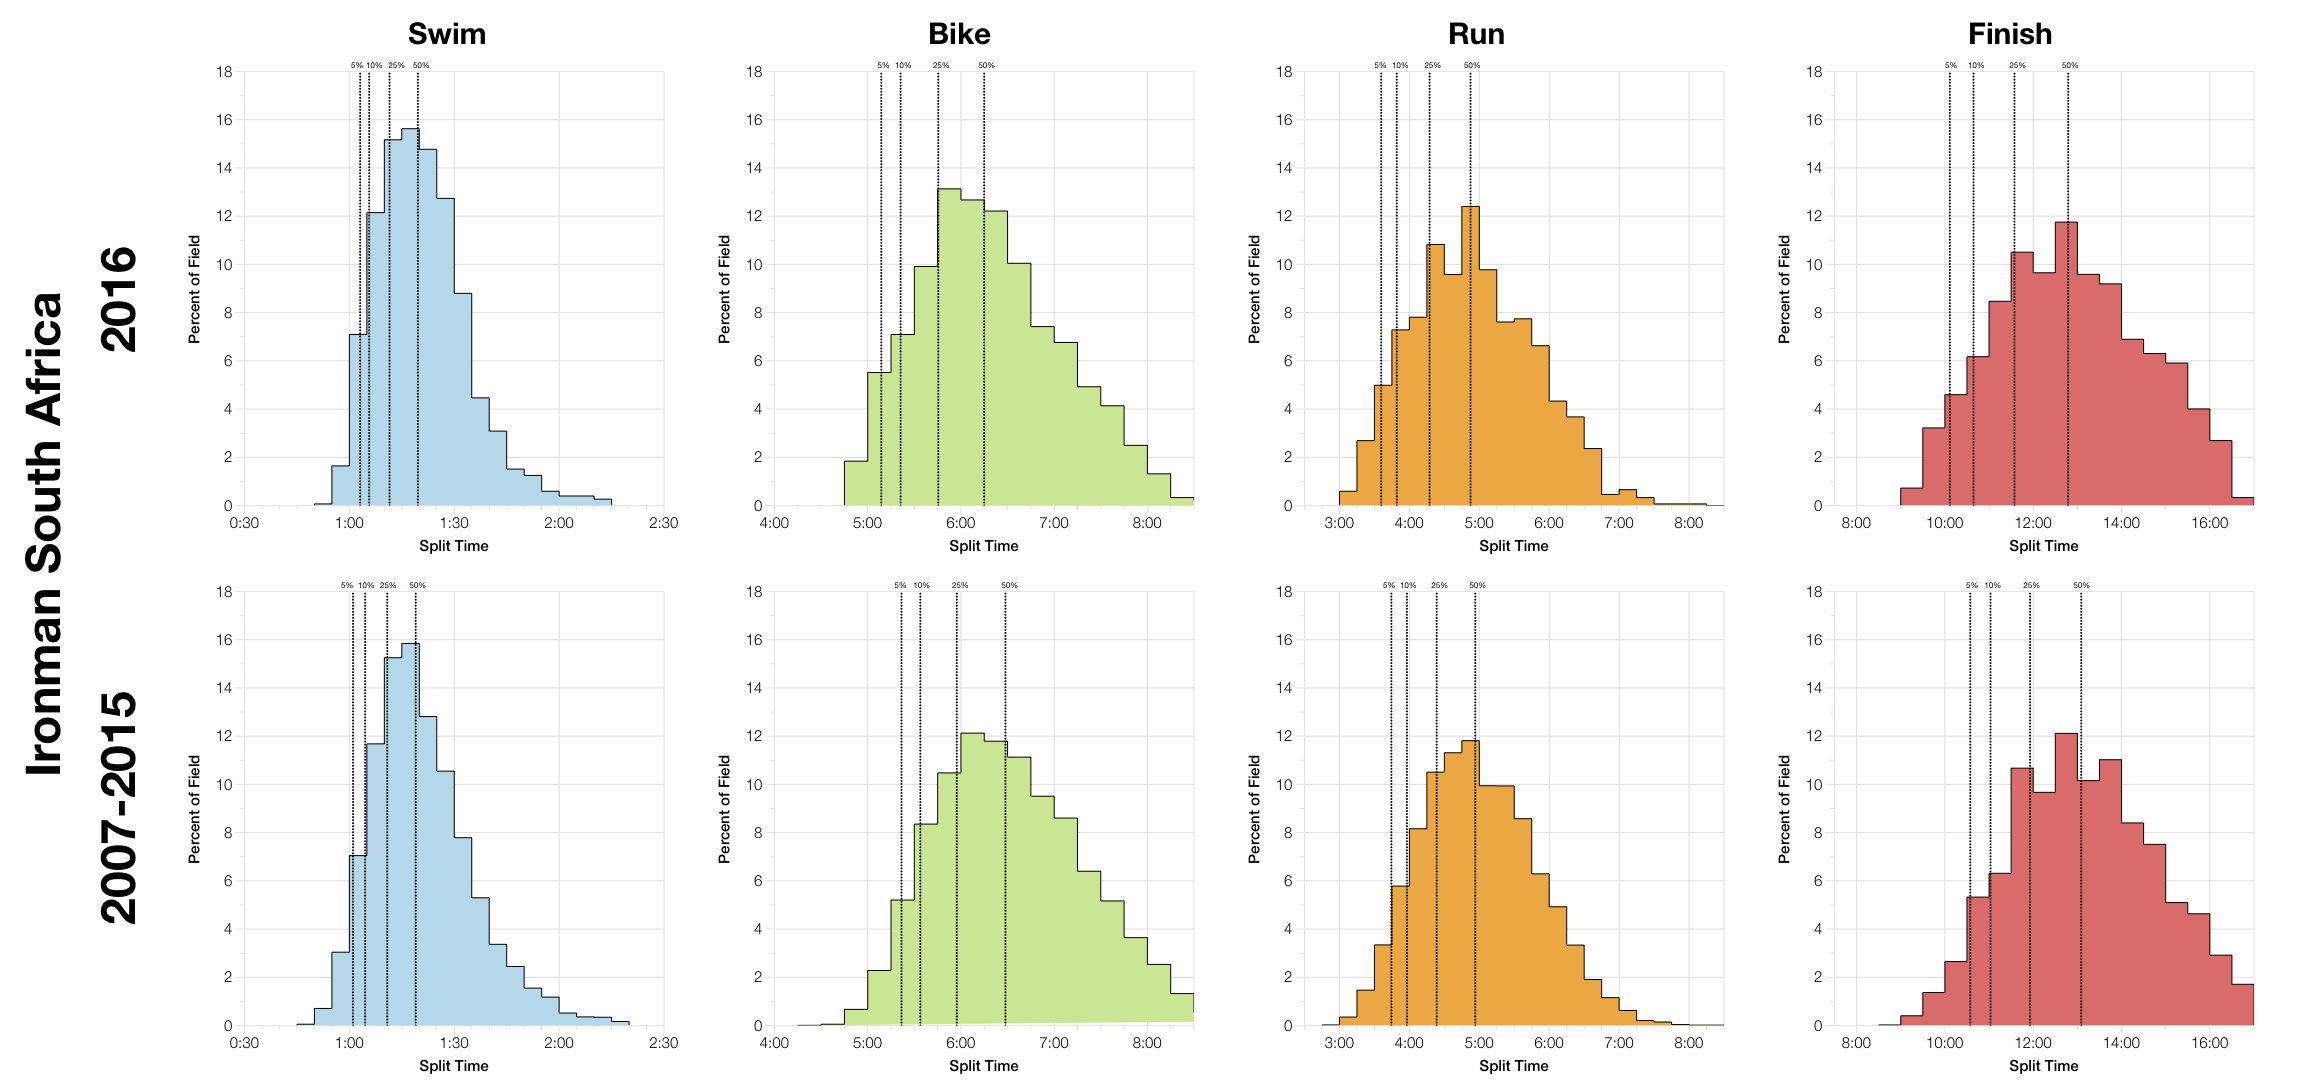
It’s quite clear from the split distributions that the 2016 swim was par for the course. It’s equally clear that there was a jump in bike times with the new bike route. The shift is consistent from front to mid pack athletes although there’s less noticeable change as you move further back. There were also benefits on the run with a small improvement in times probably brought on by lower bike fatigue from the new course. With bike and run splits trending faster the overall results naturally do the same.
| Listed Athletes | Swim Finish | Swim DNS/DNF | Bike Finish | Bike DNF | Run Finish | Run DNF | Overall DNS/DNF | |
|---|---|---|---|---|---|---|---|---|
| 2007 | 1572 | 1366 | 13.1% | 1324 | 3.1% | 1305 | 1.4% | 17% |
| 2008 | 1567 | 1432 | 8.6% | 1420 | 0.8% | 1403 | 1.2% | 10.5% |
| 2009 | 1520 | 1408 | 7.4% | 1390 | 1.3% | 1305 | 6.1% | 14.2% |
| 2010 | 1654 | 1614 | 2.4% | 1590 | 1.5% | 1548 | 2.6% | 6.4% |
| 2011 | 1733 | 1584 | 8.6% | 1553 | 2% | 1505 | 3.1% | 13.2% |
| 2012 | 1635 | 1580 | 3.4% | 1429 | 9.6% | 1384 | 3.1% | 15.4% |
| 2013 | 1784 | 1615 | 9.5% | 1592 | 1.4% | 1541 | 3.2% | 13.6% |
| 2014 | 2374 | 2084 | 12.2% | 2012 | 3.5% | 1883 | 6.4% | 20.6% |
| 2015 | 2032 | 1741 | 14.3% | 1690 | 2.9% | 1586 | 6.2% | 21.9% |
| 2016 | 1856 | 1664 | 10.3% | 1638 | 1.6% | 1566 | 4.4% | 15.6% |
Allowing for inaccuracies in recording and reporting in the results, Ironman South Africa has been consistent in it’s DNF and DNS rates. While the previous two years have been at the high end of the range this year showed a more average rate of attrition over the course.
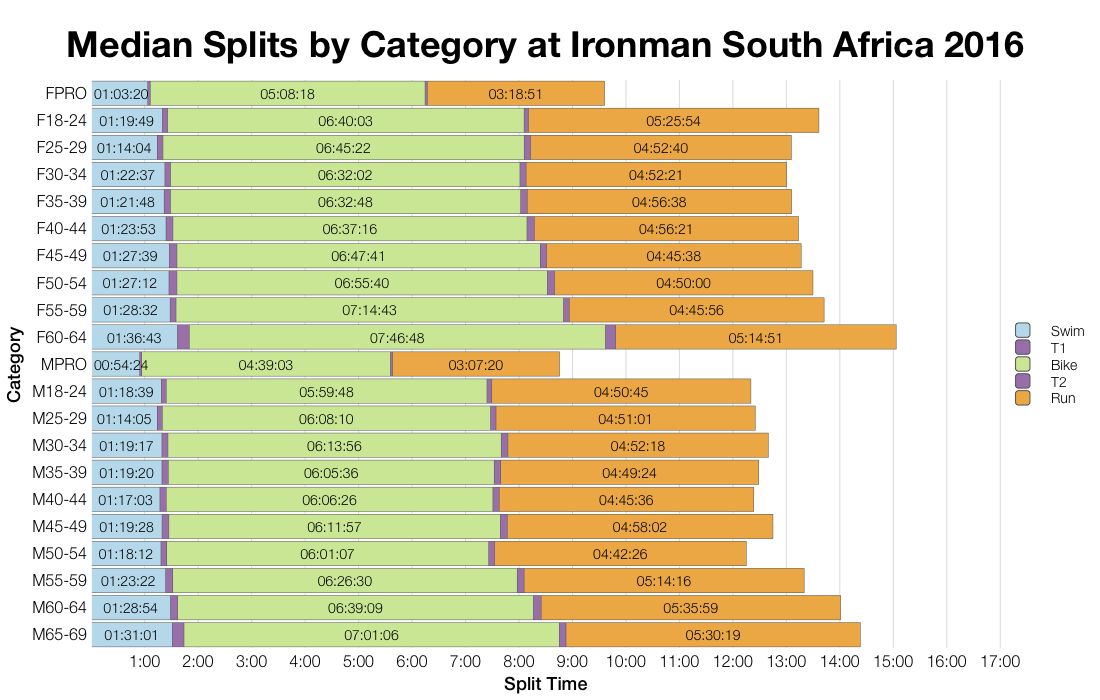
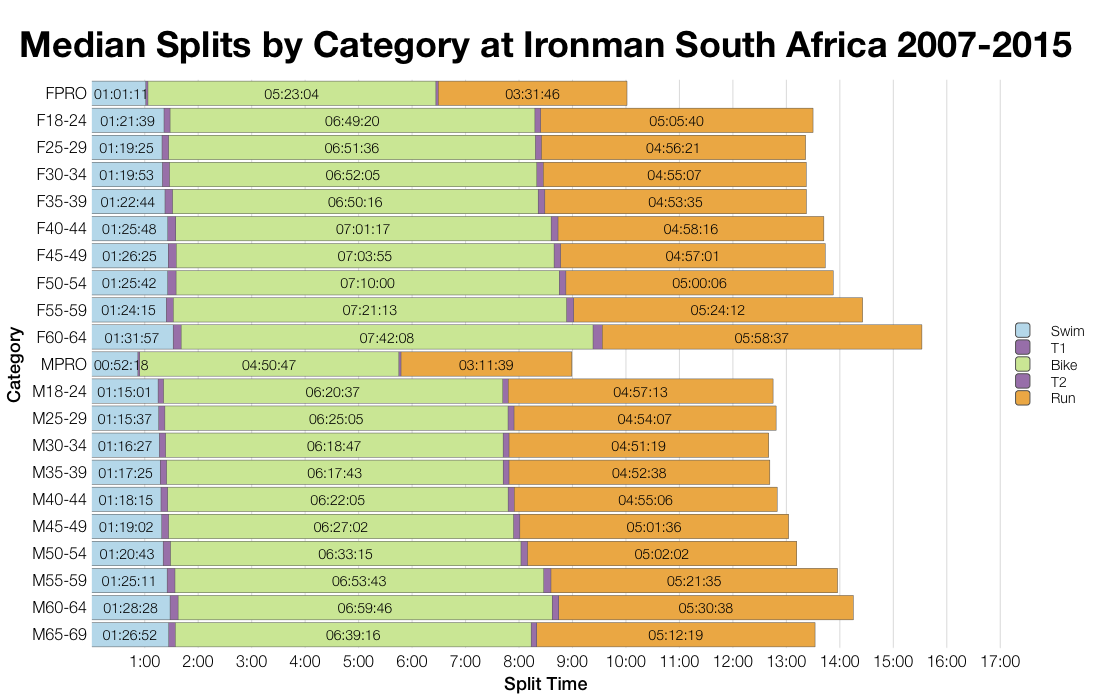
We also largely see improved times when looking at age group median splits. As we might expect the bike is the major element of these changes, we see the biggest shift in those splits. The swim remains largely the same and the run shows smaller and less consistent improvements. Still there is a clear shift in results with the new bike course.
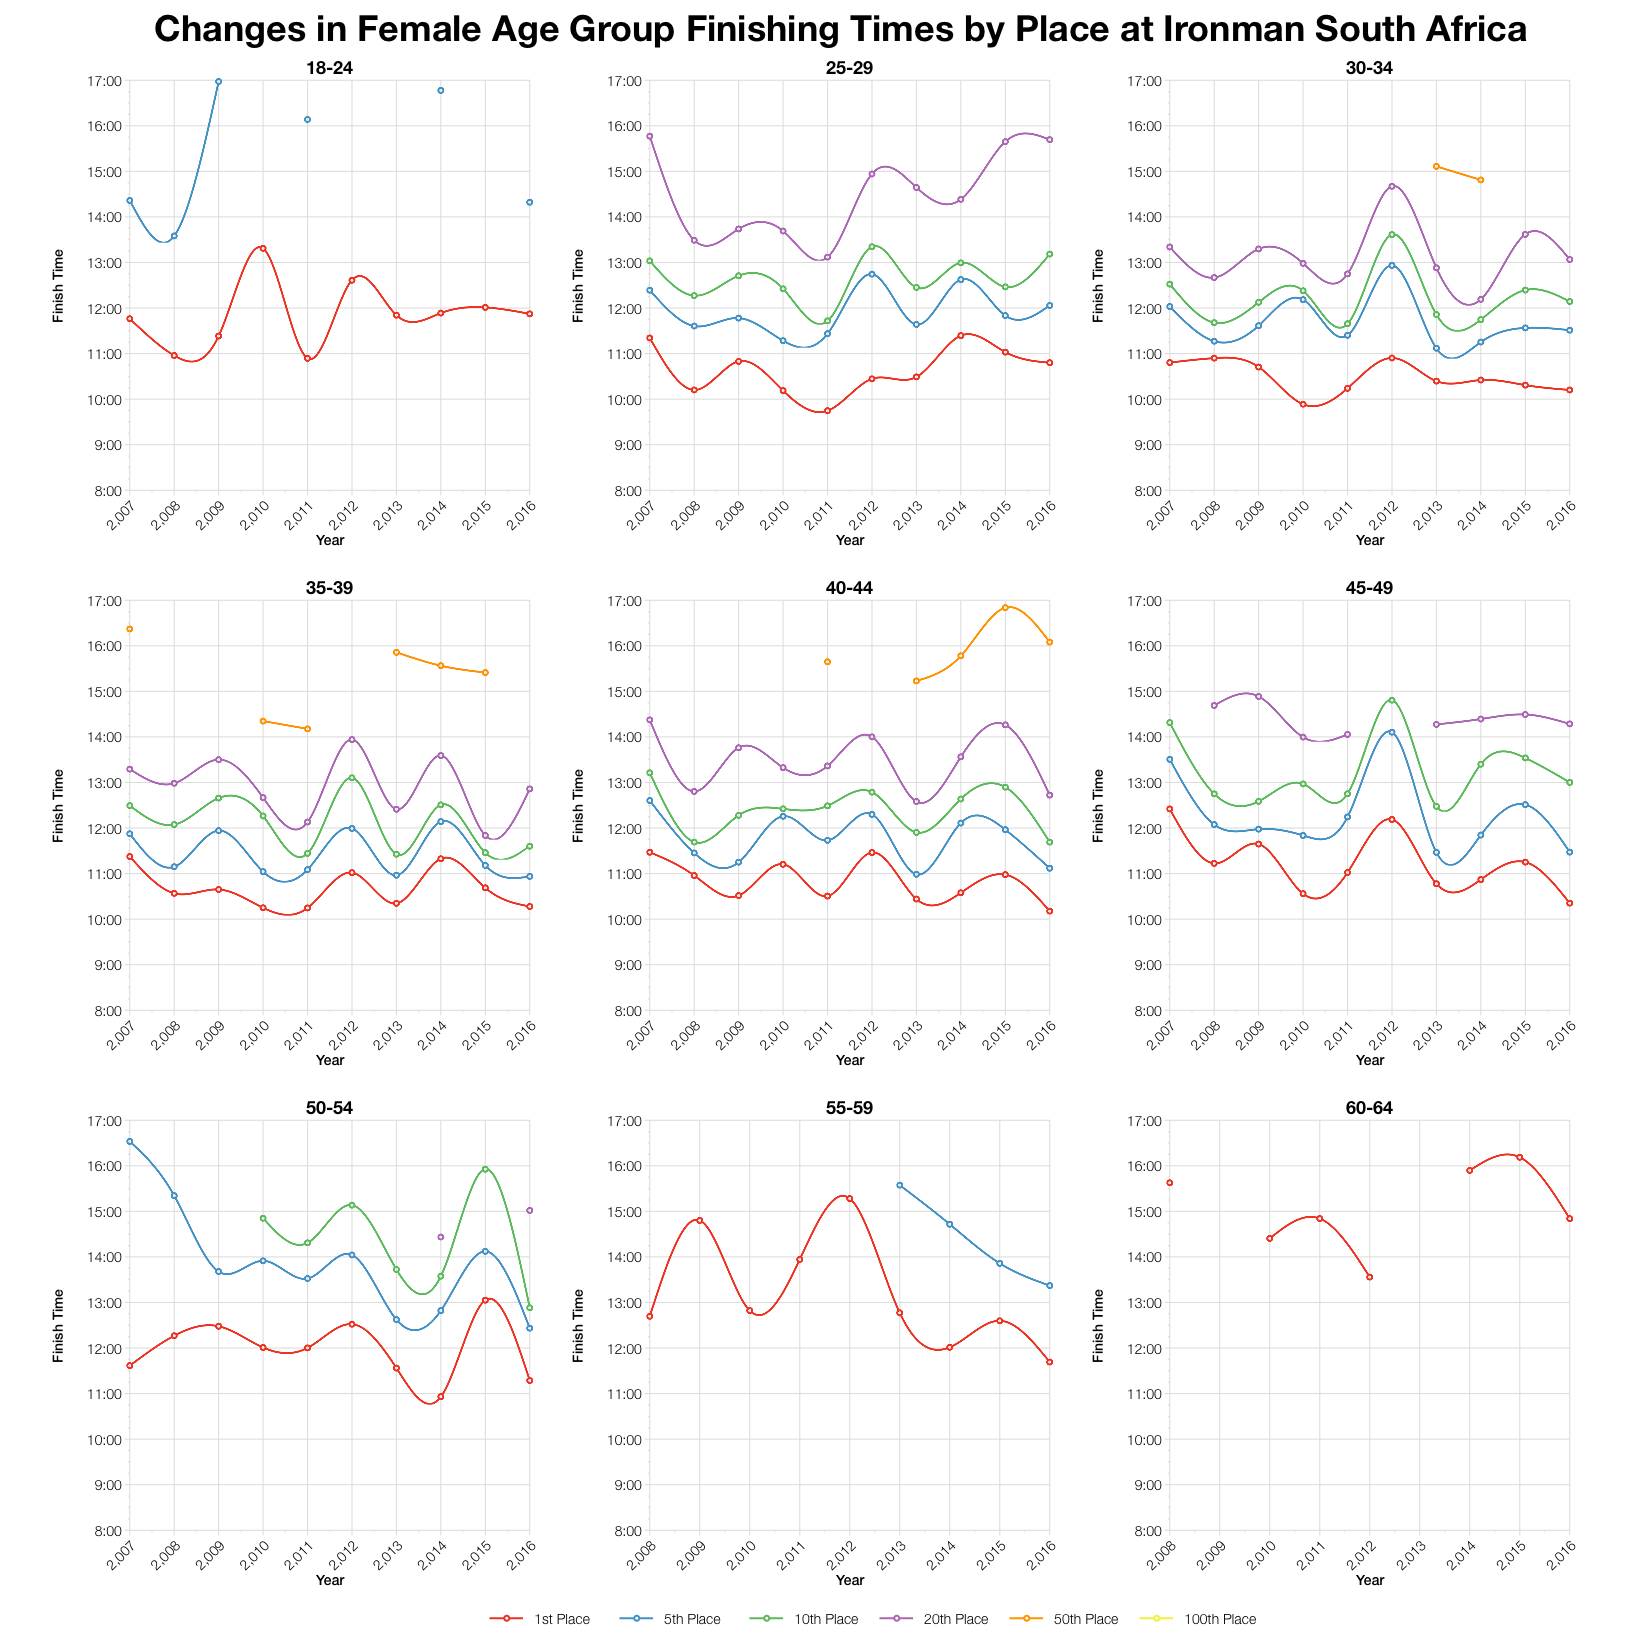
The last time we saw comparable results in South Africa was in a 2013 where favourable conditions helped deliver a good day of racing. The bike course was changed after that yielding slower times in 2014 and 2015. It’s close run, but this year’s course changes may have delivered the fastest race yet for the age group field.
| Slots | Winner | Average Kona Qualifier | Final Qualifier | |
|---|---|---|---|---|
| M18-24 | 2 | 9:36:07 | 9:39:18 | 9:42:29 |
| M25-29 | 4 | 9:53:48 | 9:58:40 | 10:05:30 |
| M30-34 | 8 | 9:17:13 | 9:30:09 | 9:39:12 |
| M35-39 | 9 | 9:17:00 | 9:33:43 | 9:44:10 |
| M40-44 | 12 | 9:05:58 | 9:35:20 | 9:51:16 |
| M45-49 | 10 | 9:28:25 | 9:54:16 | 10:03:36 |
| M50-54 | 5 | 9:52:07 | 10:10:49 | 10:24:44 |
| M55-59 | 3 | 10:22:49 | 10:33:07 | 10:43:11 |
| M60-64 | 2 | 11:00:03 | 11:22:09 | 11:44:16 |
| M65-69 | 1 | 13:21:29 | 13:21:29 | 13:21:29 |
| F18-24 | 1 | 11:52:18 | 11:52:18 | 11:52:18 |
| F25-29 | 2 | 10:47:58 | 11:00:03 | 11:12:08 |
| F30-34 | 2 | 10:12:04 | 10:28:57 | 10:45:51 |
| F35-39 | 3 | 10:16:38 | 10:22:39 | 10:28:07 |
| F40-44 | 3 | 10:10:32 | 10:39:32 | 11:01:29 |
| F45-49 | 2 | 10:21:00 | 10:29:56 | 10:38:53 |
| F50-54 | 2 | 11:17:12 | 11:27:17 | 11:37:23 |
| F55-59 | 1 | 11:41:31 | 11:41:31 | 11:41:31 |
| F60-64 | 1 | 14:50:24 | 14:50:24 | 14:50:24 |
The table above summarises my estimates for Kona slot allocation in South Africa and times that were required to achieve automatic qualification at the event. You can compare it with previous year’s results at my 2016 Ironman World Championship Qualification page.
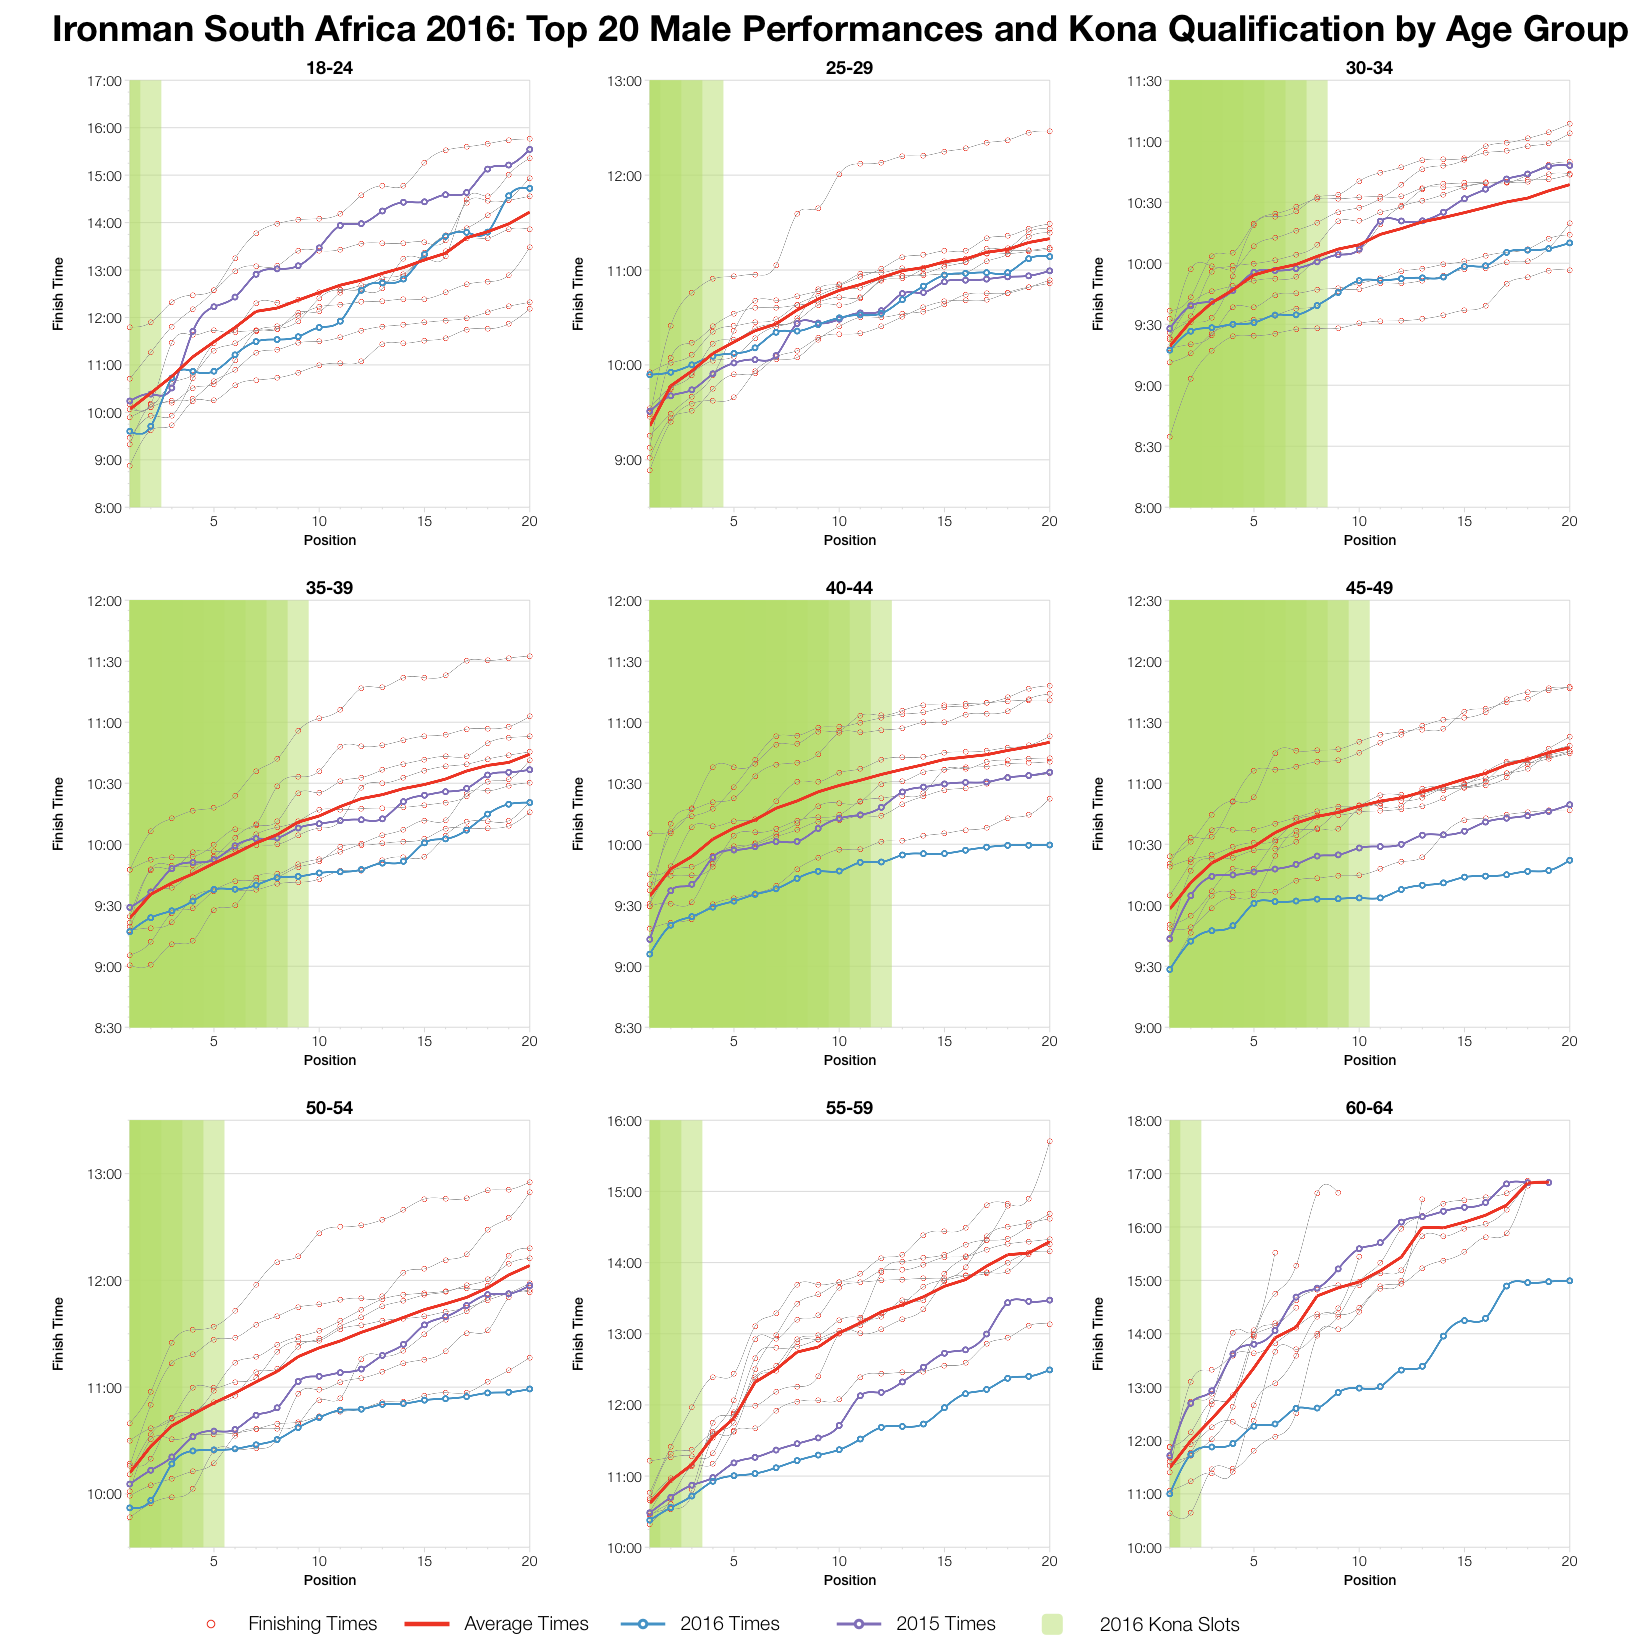
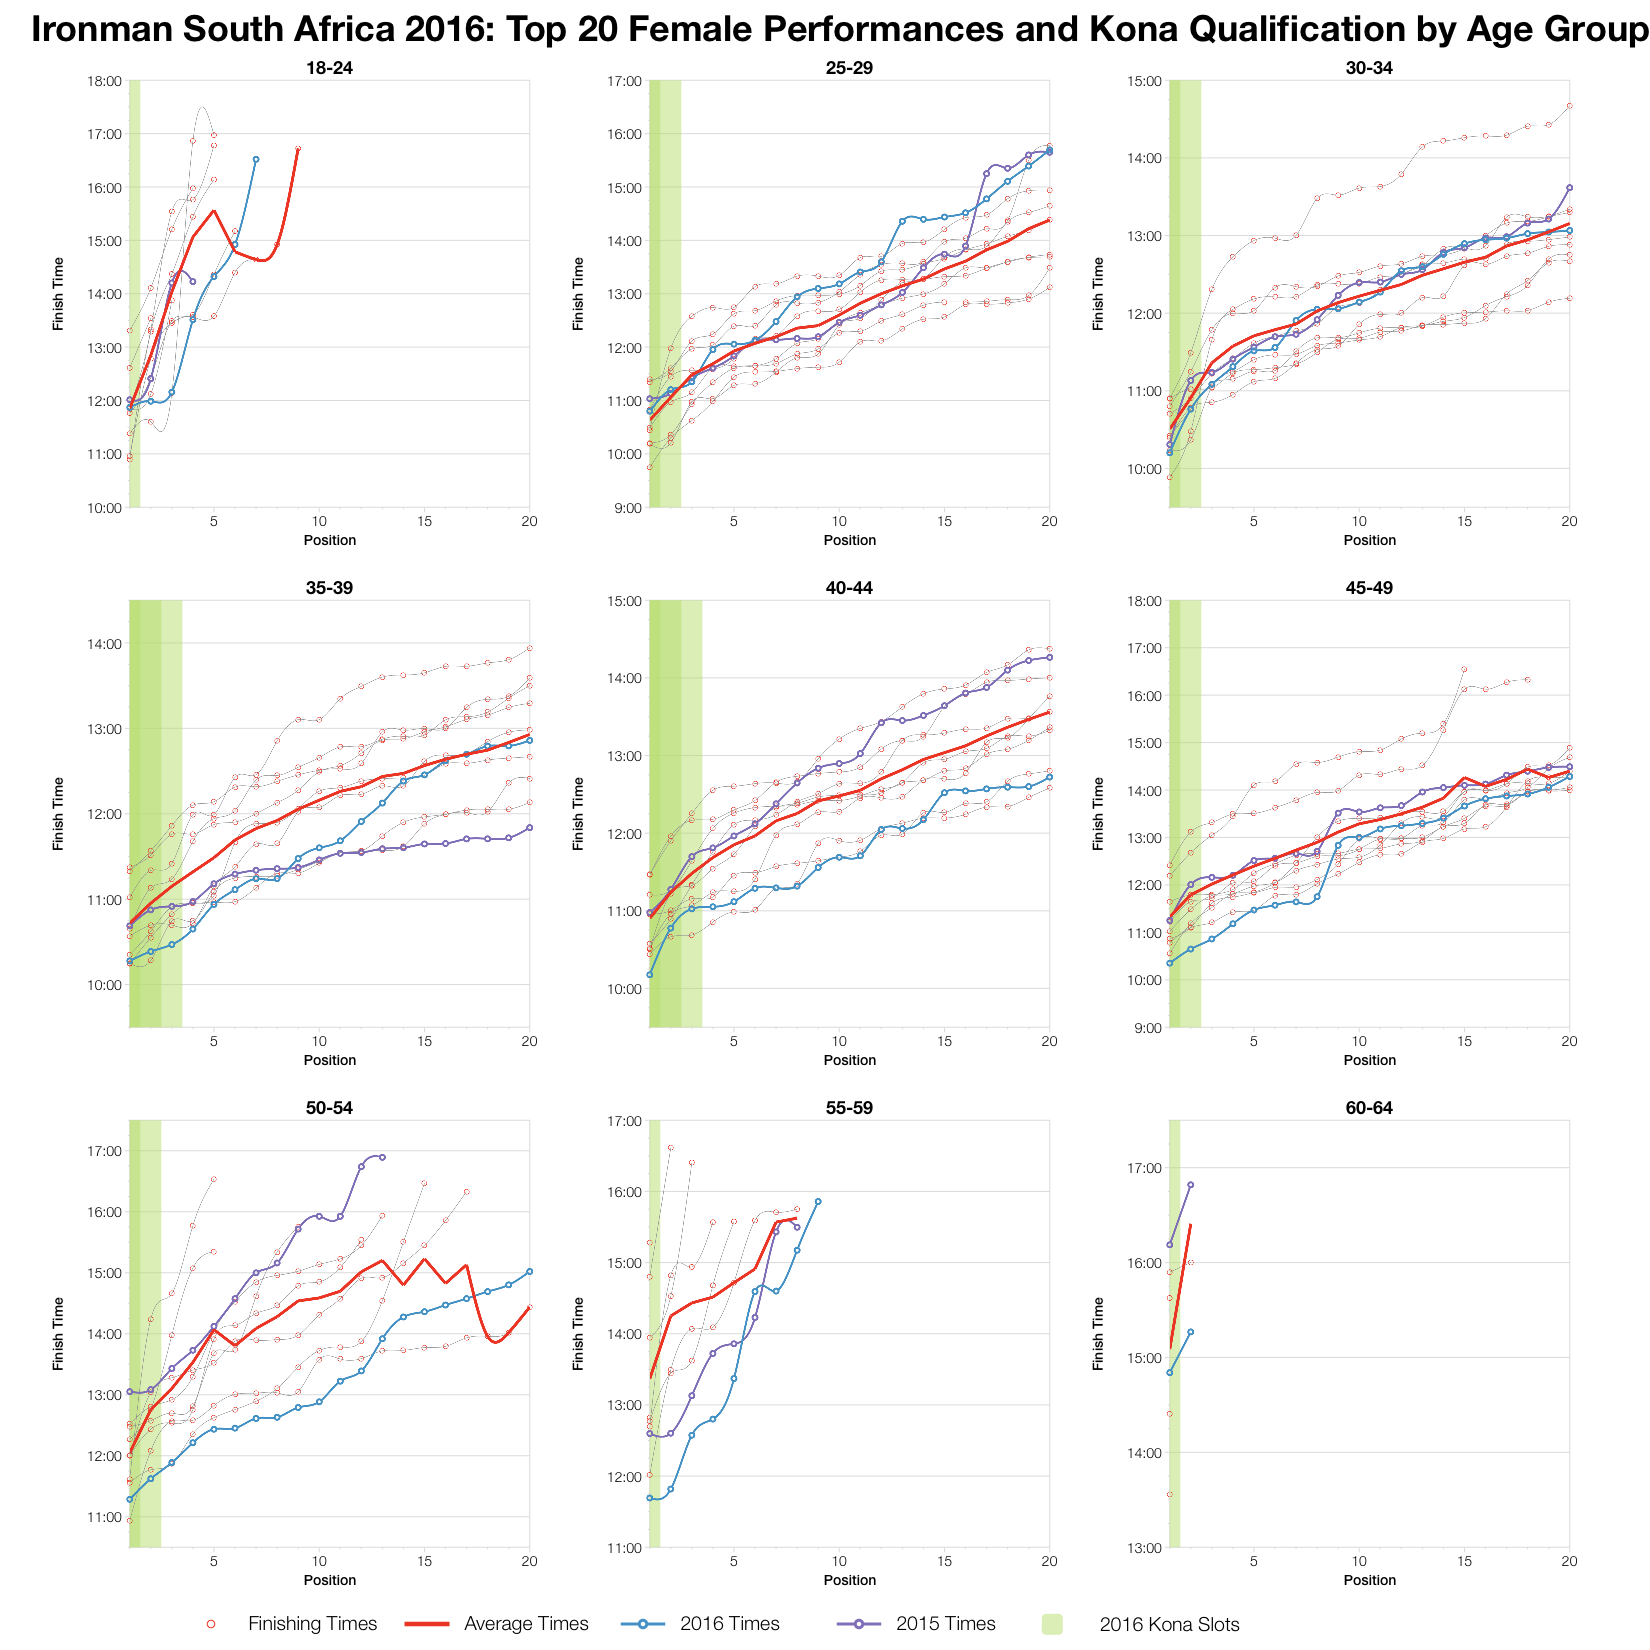
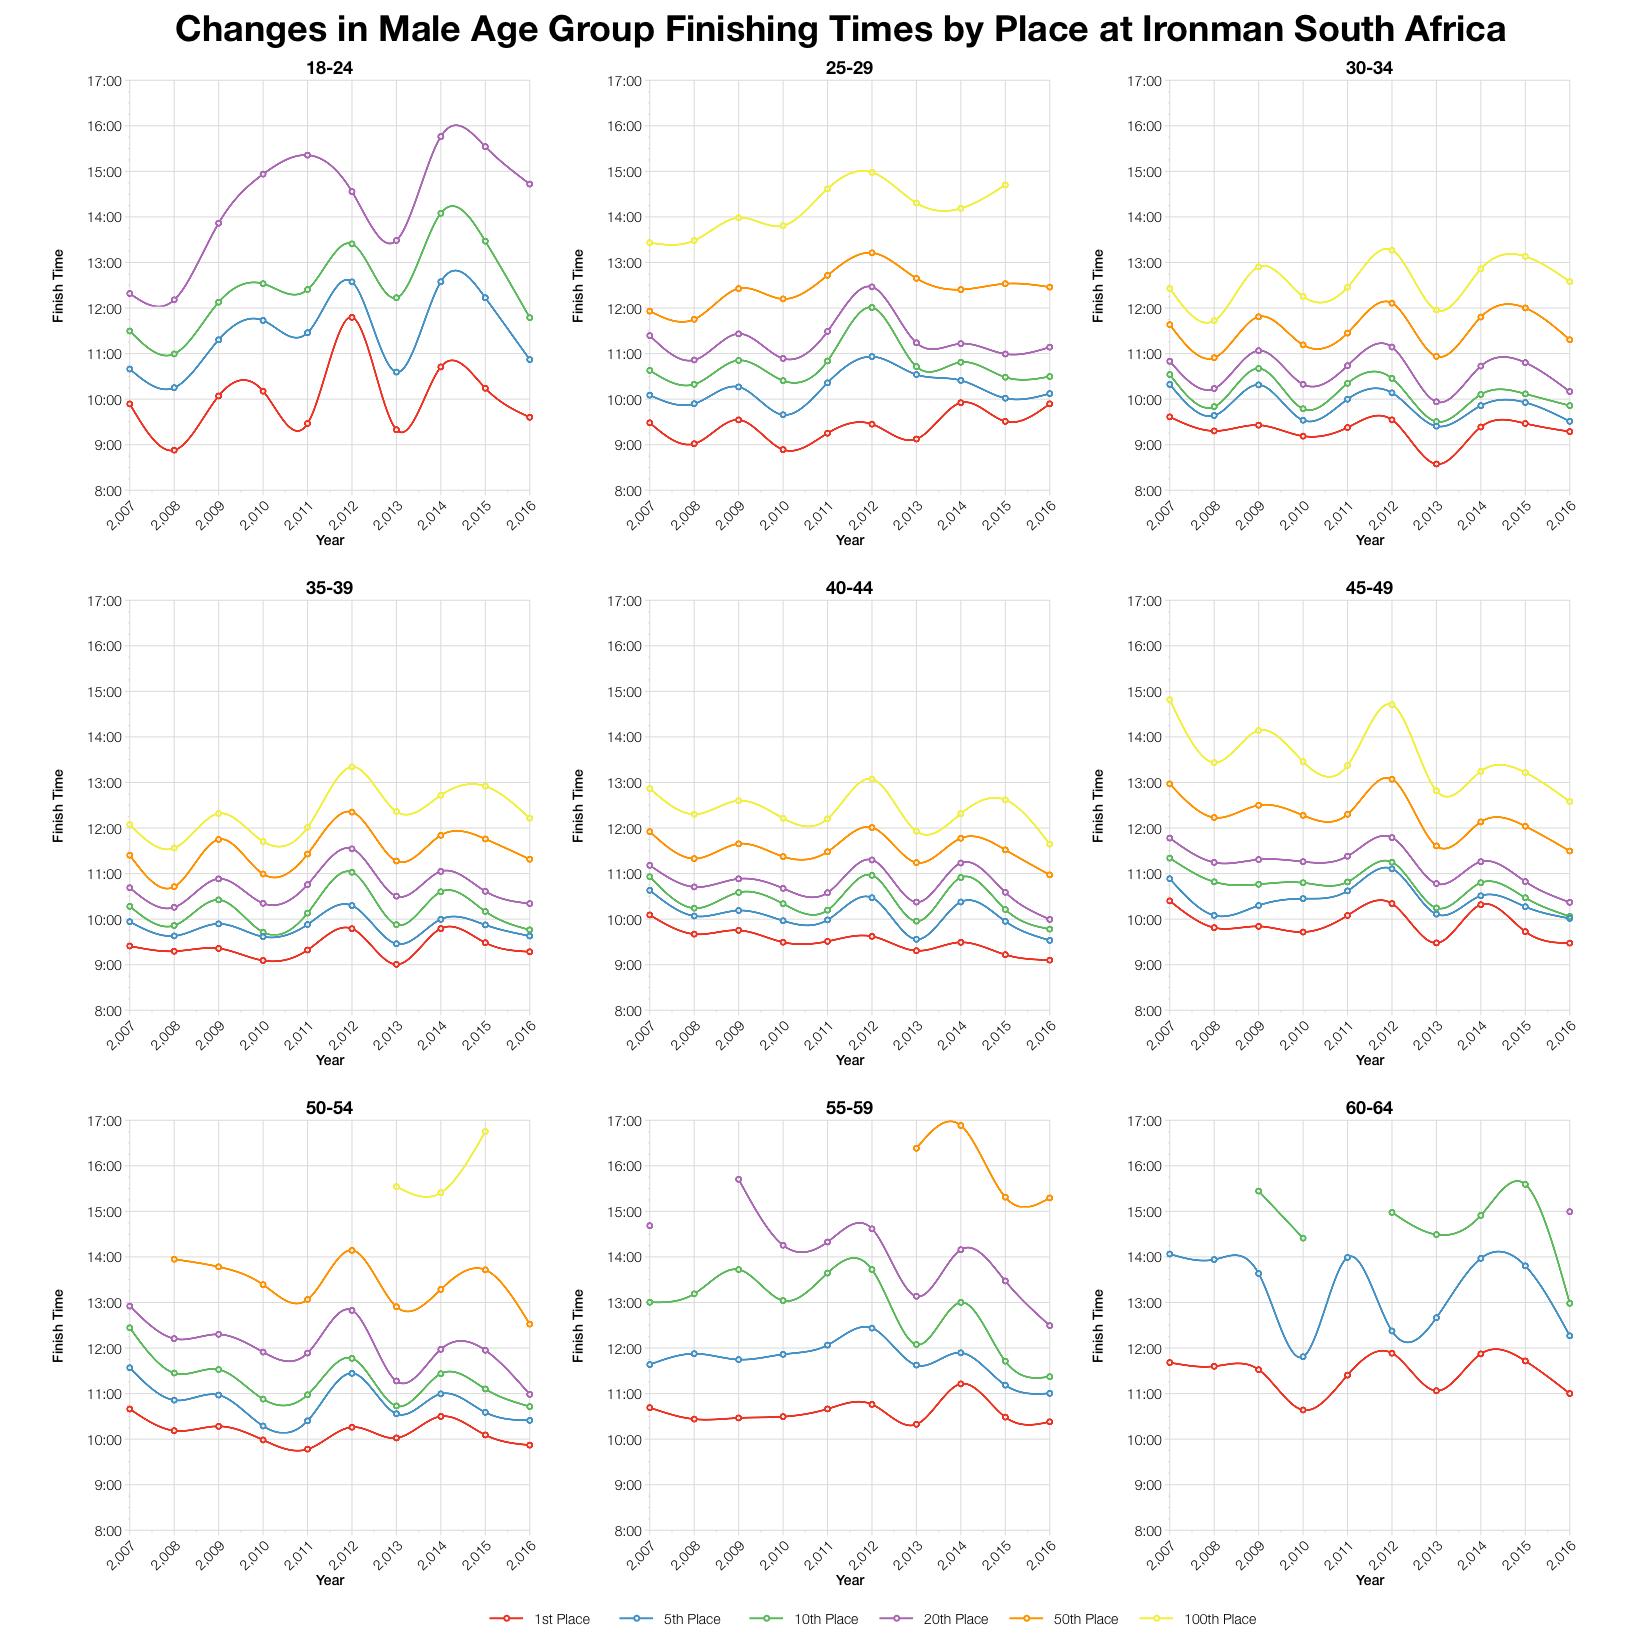
If we focus on the largest male and female age groups, those ranging between 30 and 50, then this year’s Kona qualifying times were in advance of previous years. Those age groups are always competitive, this year is no different. Outside of that, while the picture is more mixed, results still tend towards average or better at the front of the age group field. This can largely be explained by the updates to the bike course. The difference between first, tenth and twentieth times follows similar trends to previous years in most of the age groups suggesting levels of competition were broadly comparable.
You can access a spreadsheet of the full results and splits from Ironman South Africa 2016 on my Google Drive.


