The other major race this weekend (from my perspective) was Wimbleball, or Ironman Exmoor 70.3 as it’s now called. A long running half Ironman, known for the challenge of its course and the slower 70.3 times it produces. I don’t analyse World Champs qualification for 70.3 so this quick review will focus on the trends in finishing times.
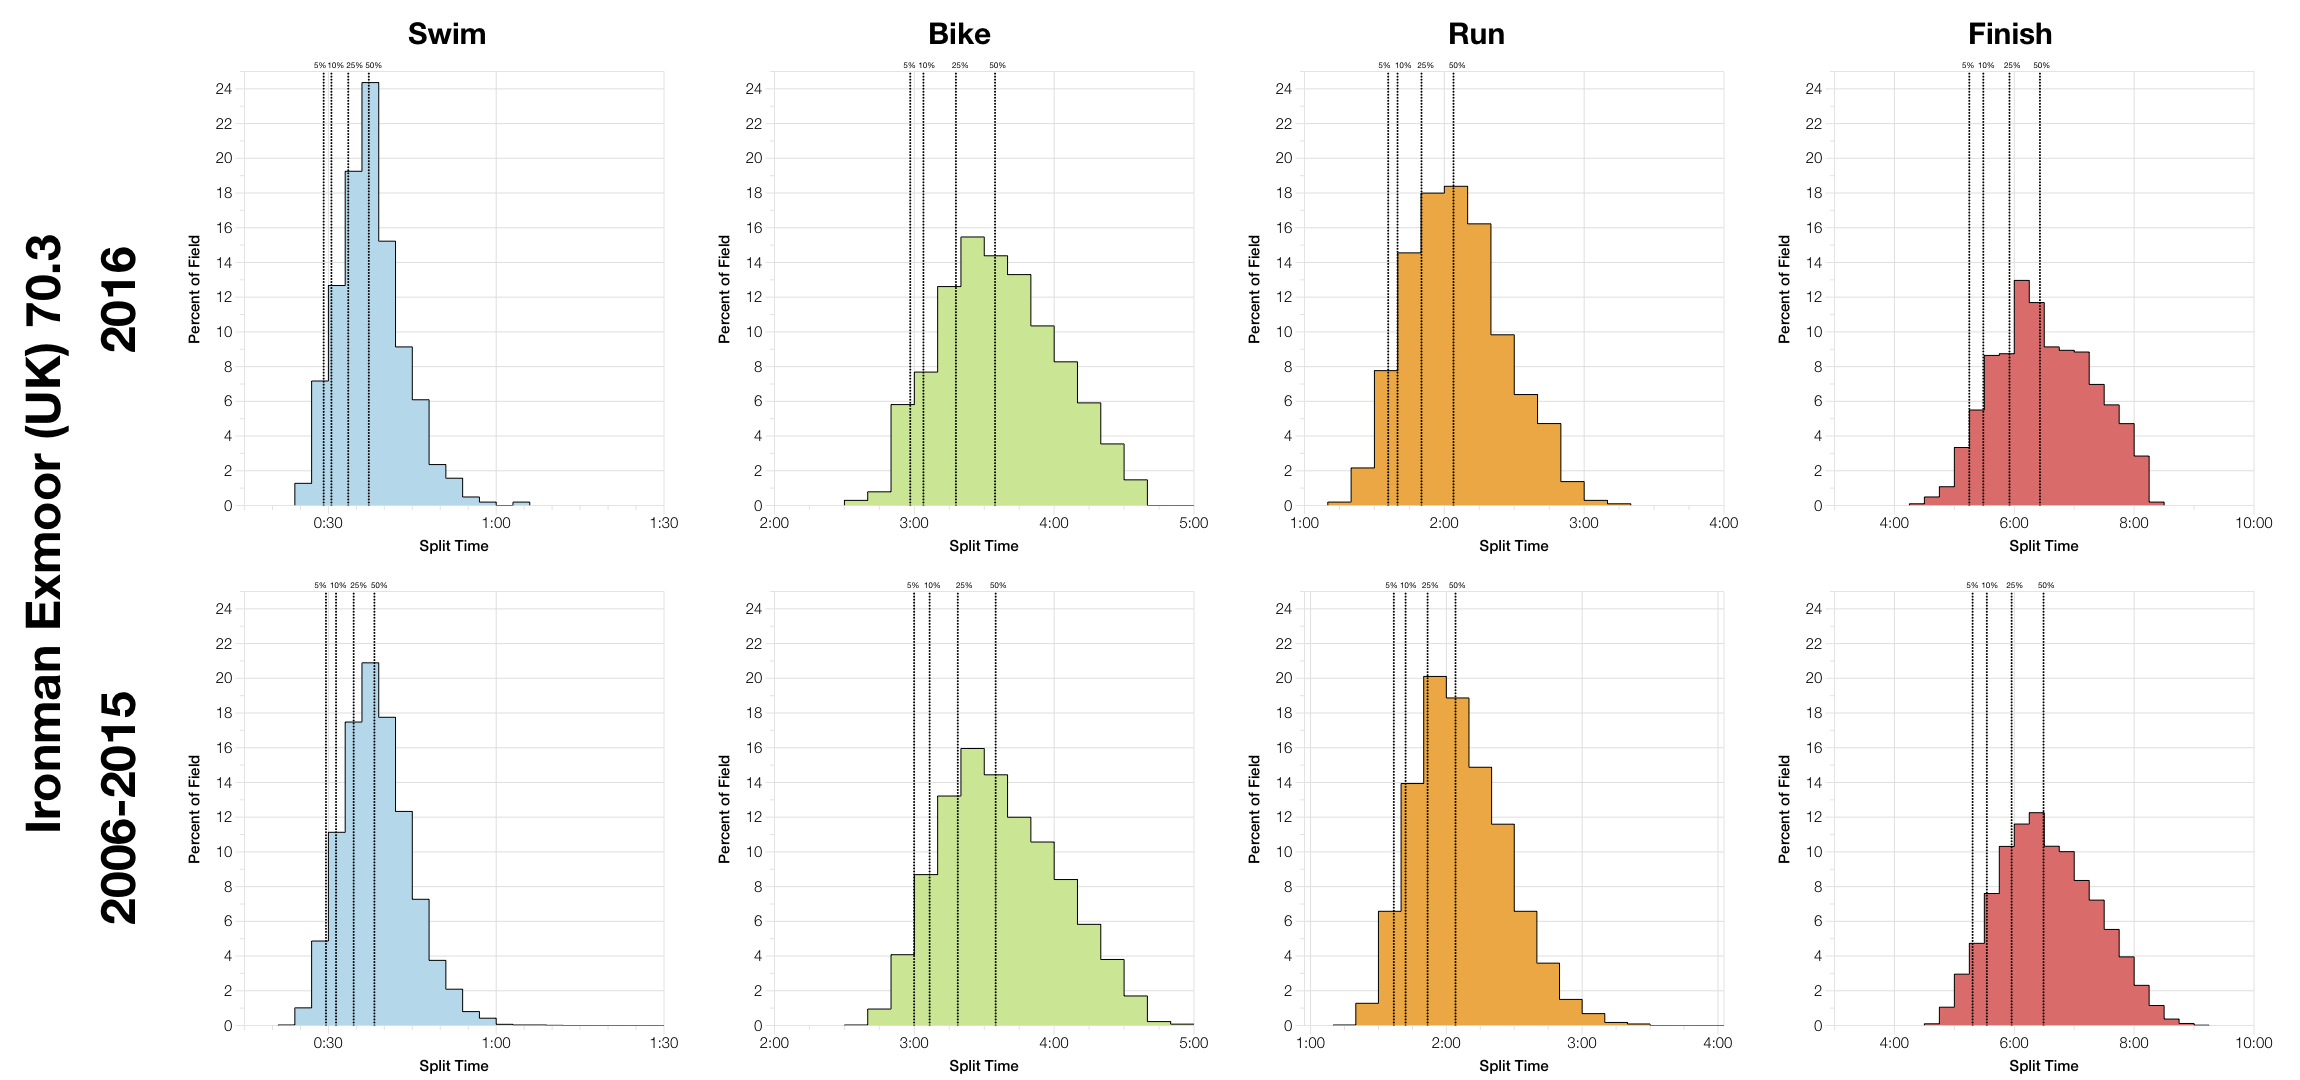
There aren’t really any major differences in the distribution of this year’s splits when compared with the last ten years of racing at Wimbleball. Small variations in the shape of each histogram don’t yield significant differences in percentile finish times. Median points look to be very similar as do fifth and tenth percentile. This year’s results fall close to course norms.
| Listed Athletes | Swim Finish | Swim DNS/DNF | Bike Finish | Bike DNF | Run Finish | Run DNF | Overall DNS/DNF | |
|---|---|---|---|---|---|---|---|---|
| 2006 | 848 | 848 | 0% | 811 | 4.4% | 804 | 0.9% | 5.2% |
| 2007 | 916 | 916 | 0% | 909 | 0.8% | 856 | 5.8% | 6.6% |
| 2008 | 896 | 894 | 0.2% | 818 | 8.5% | 799 | 2.3% | 10.8% |
| 2009 | 966 | 961 | 0.5% | 918 | 4.5% | 902 | 1.7% | 6.6% |
| 2010 | 1515 | 1174 | 22.5% | 1104 | 6% | 1089 | 1.4% | 28.1% |
| 2011 | 1235 | 1227 | 0.6% | 1123 | 8.5% | 1110 | 1.2% | 10.5% |
| 2012 | 1784 | 1375 | 22.9% | 1317 | 4.2% | 1265 | 3.9% | 29.1% |
| 2013 | 1666 | 1340 | 19.6% | 1312 | 2.1% | 1191 | 9.2% | 28.5% |
| 2014 | 1672 | 1337 | 20% | 1274 | 4.7% | 1243 | 2.4% | 25.7% |
| 2015 | 1594 | 1270 | 20.3% | 1200 | 5.5% | 1166 | 2.8% | 26.9% |
| 2016 | 1336 | 1084 | 18.9% | 1055 | 2.7% | 1018 | 3.5% | 23.8% |
DNF and DNS data is broadly comparable, perhaps a little more favourable than other years with fewer apparent DNFs. Although, it’s also worth noting there’s a drop off in entrants too – perhaps and effect of greater 70.3 and half ironman options?
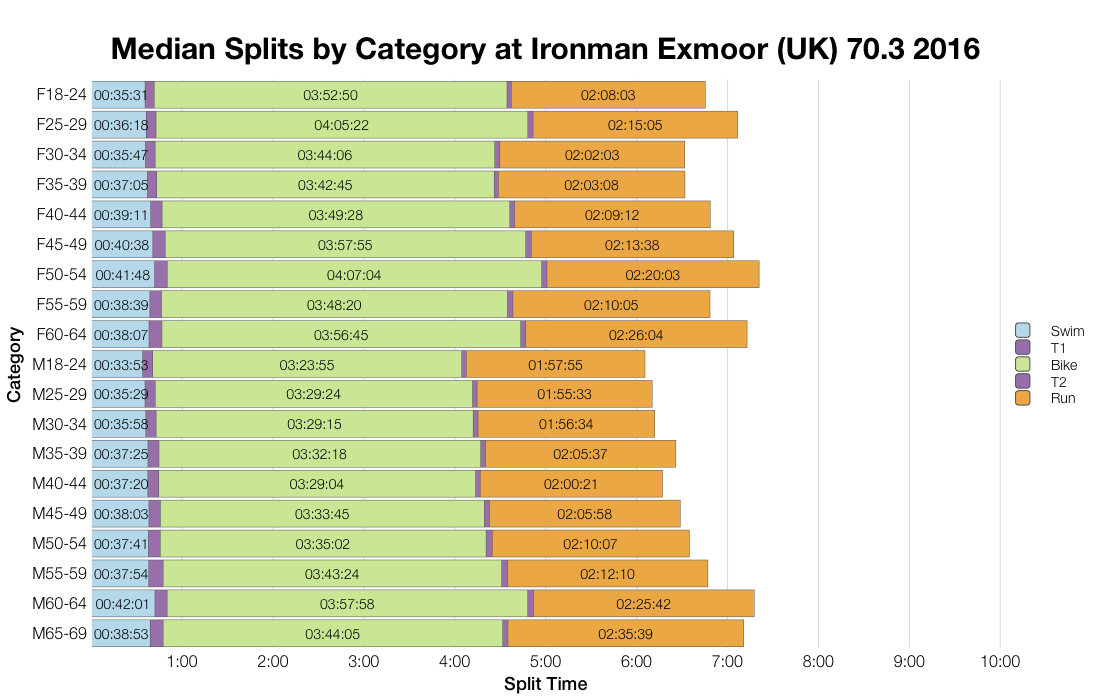
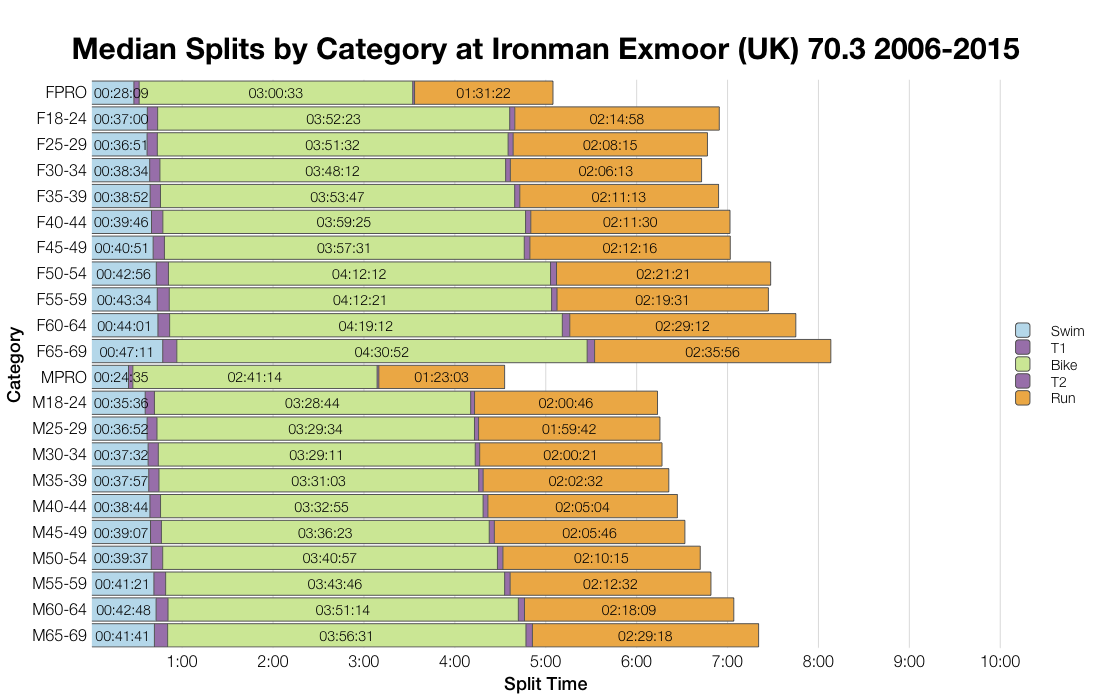
Sure enough, breaking down median data by age group shows the results to be comparable with those collected over the last 10 years of racing at Wimbleball. The only potential trend I’ll note is of a slightly faster swim at this years event.
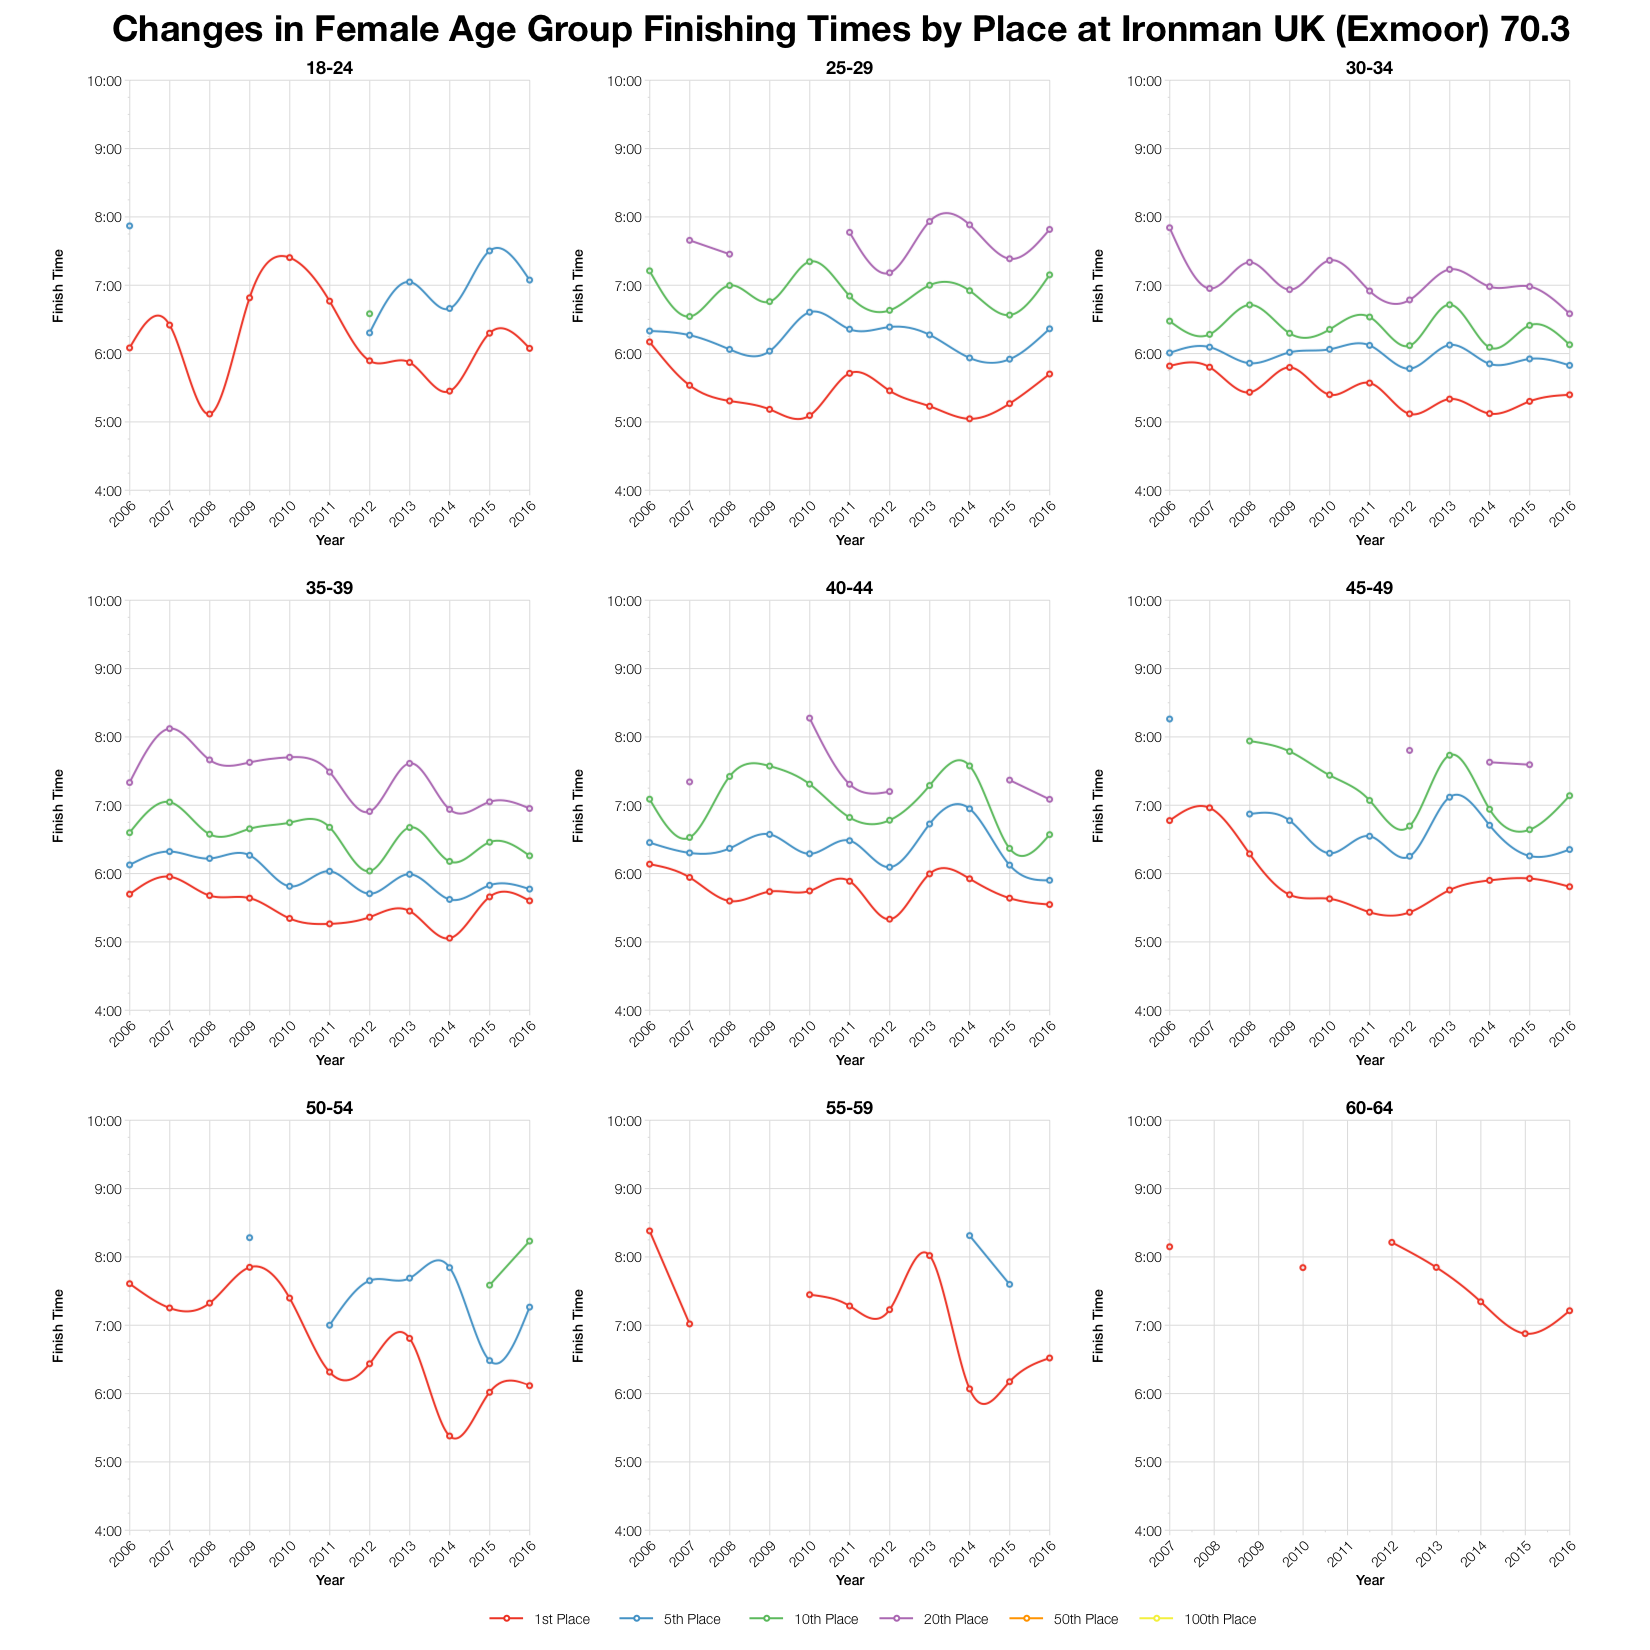
Over the eleven year’s of race data I’ve gathered there have been small variation in performances as we’d expect. Times have been quite consistent though and this year’s race falls inline with the past – not the fastest seen on the course, nor the slowest.
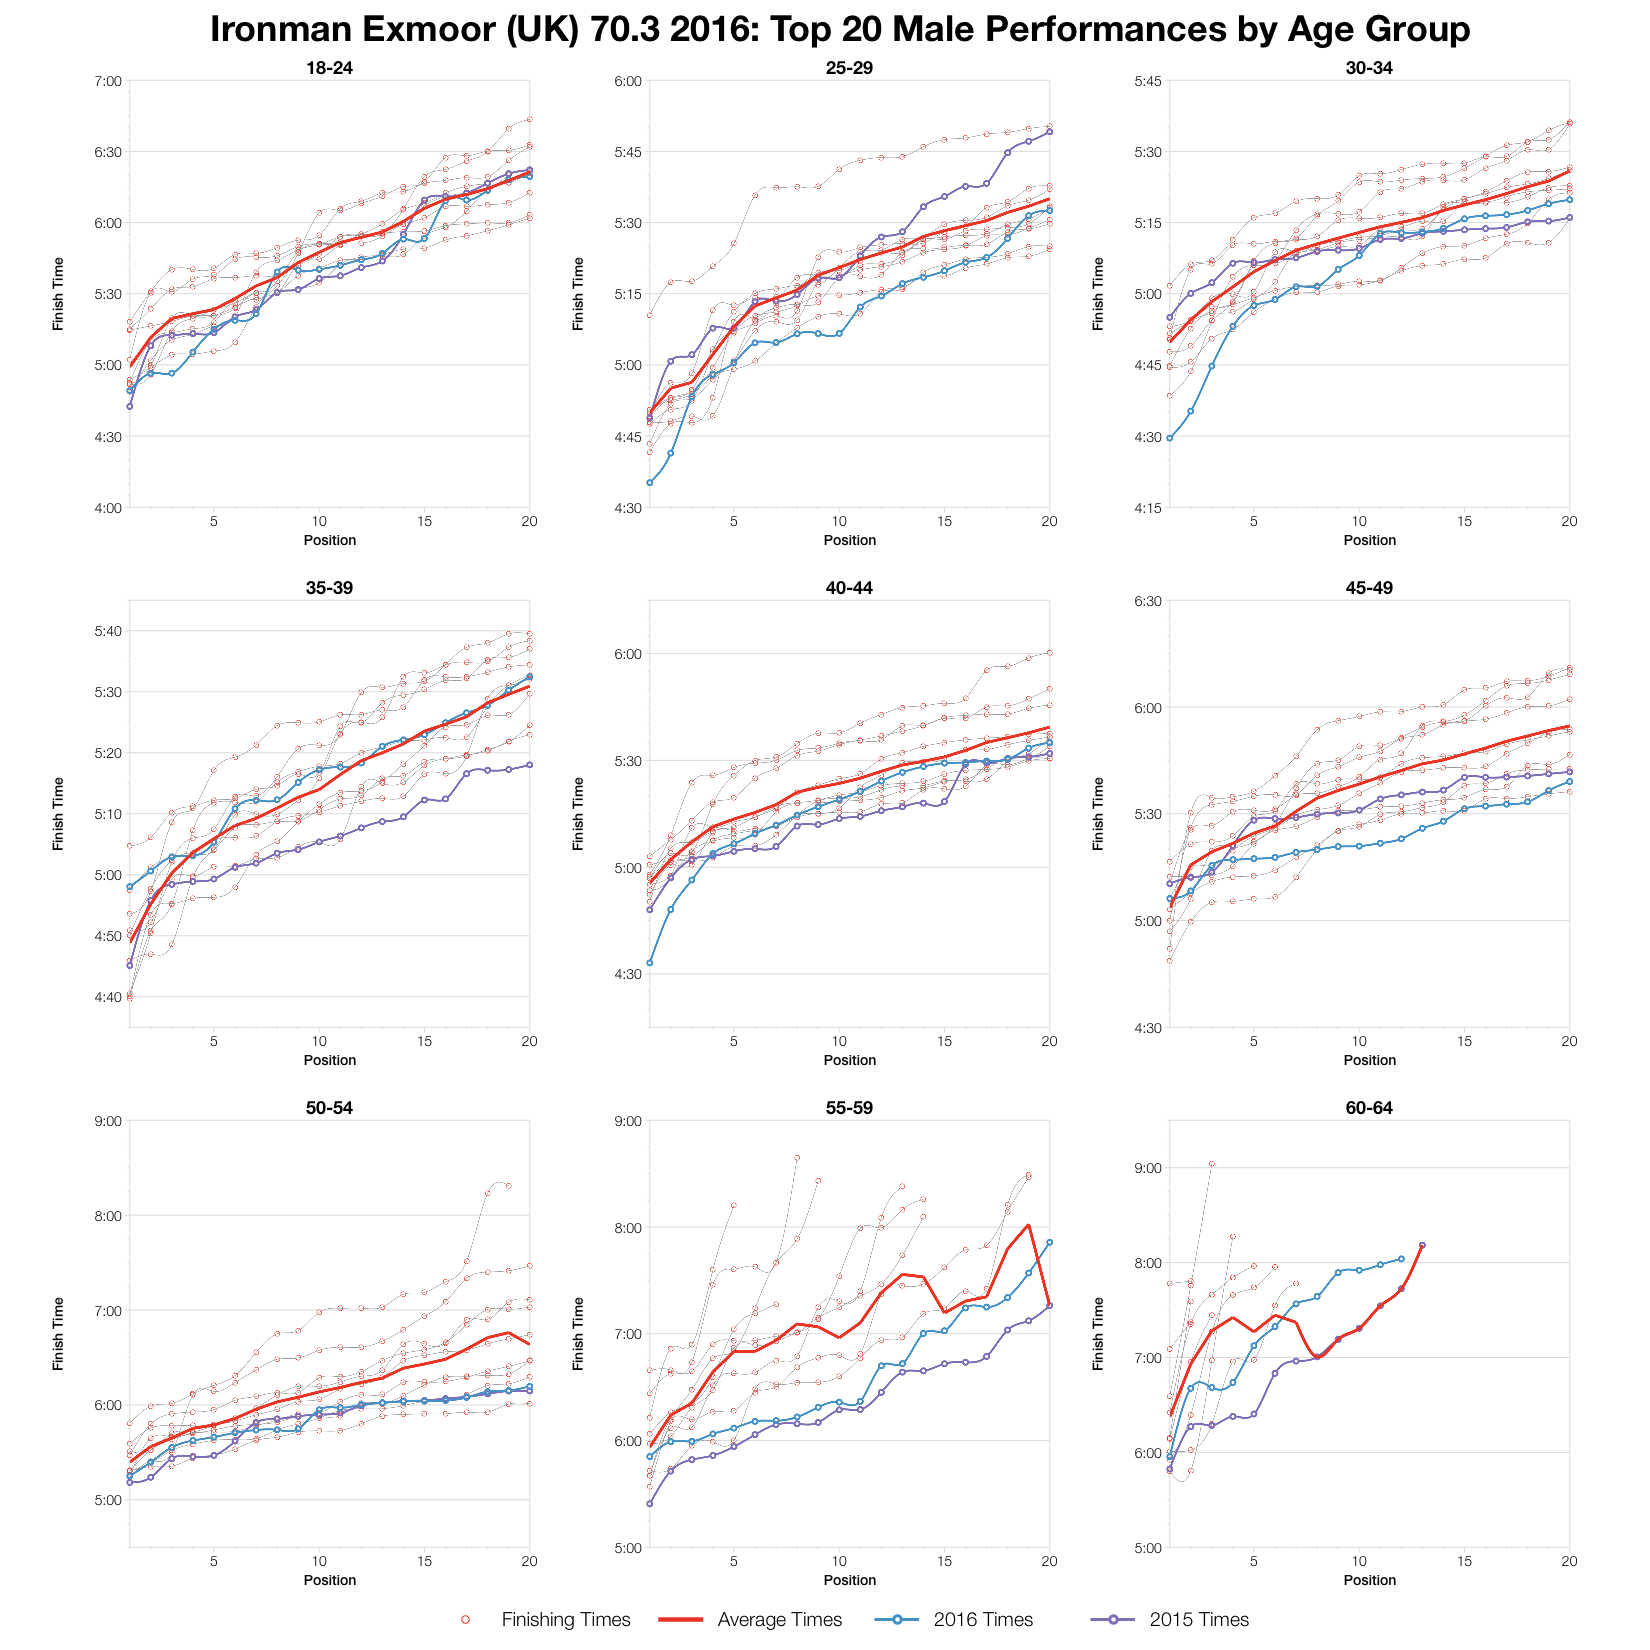
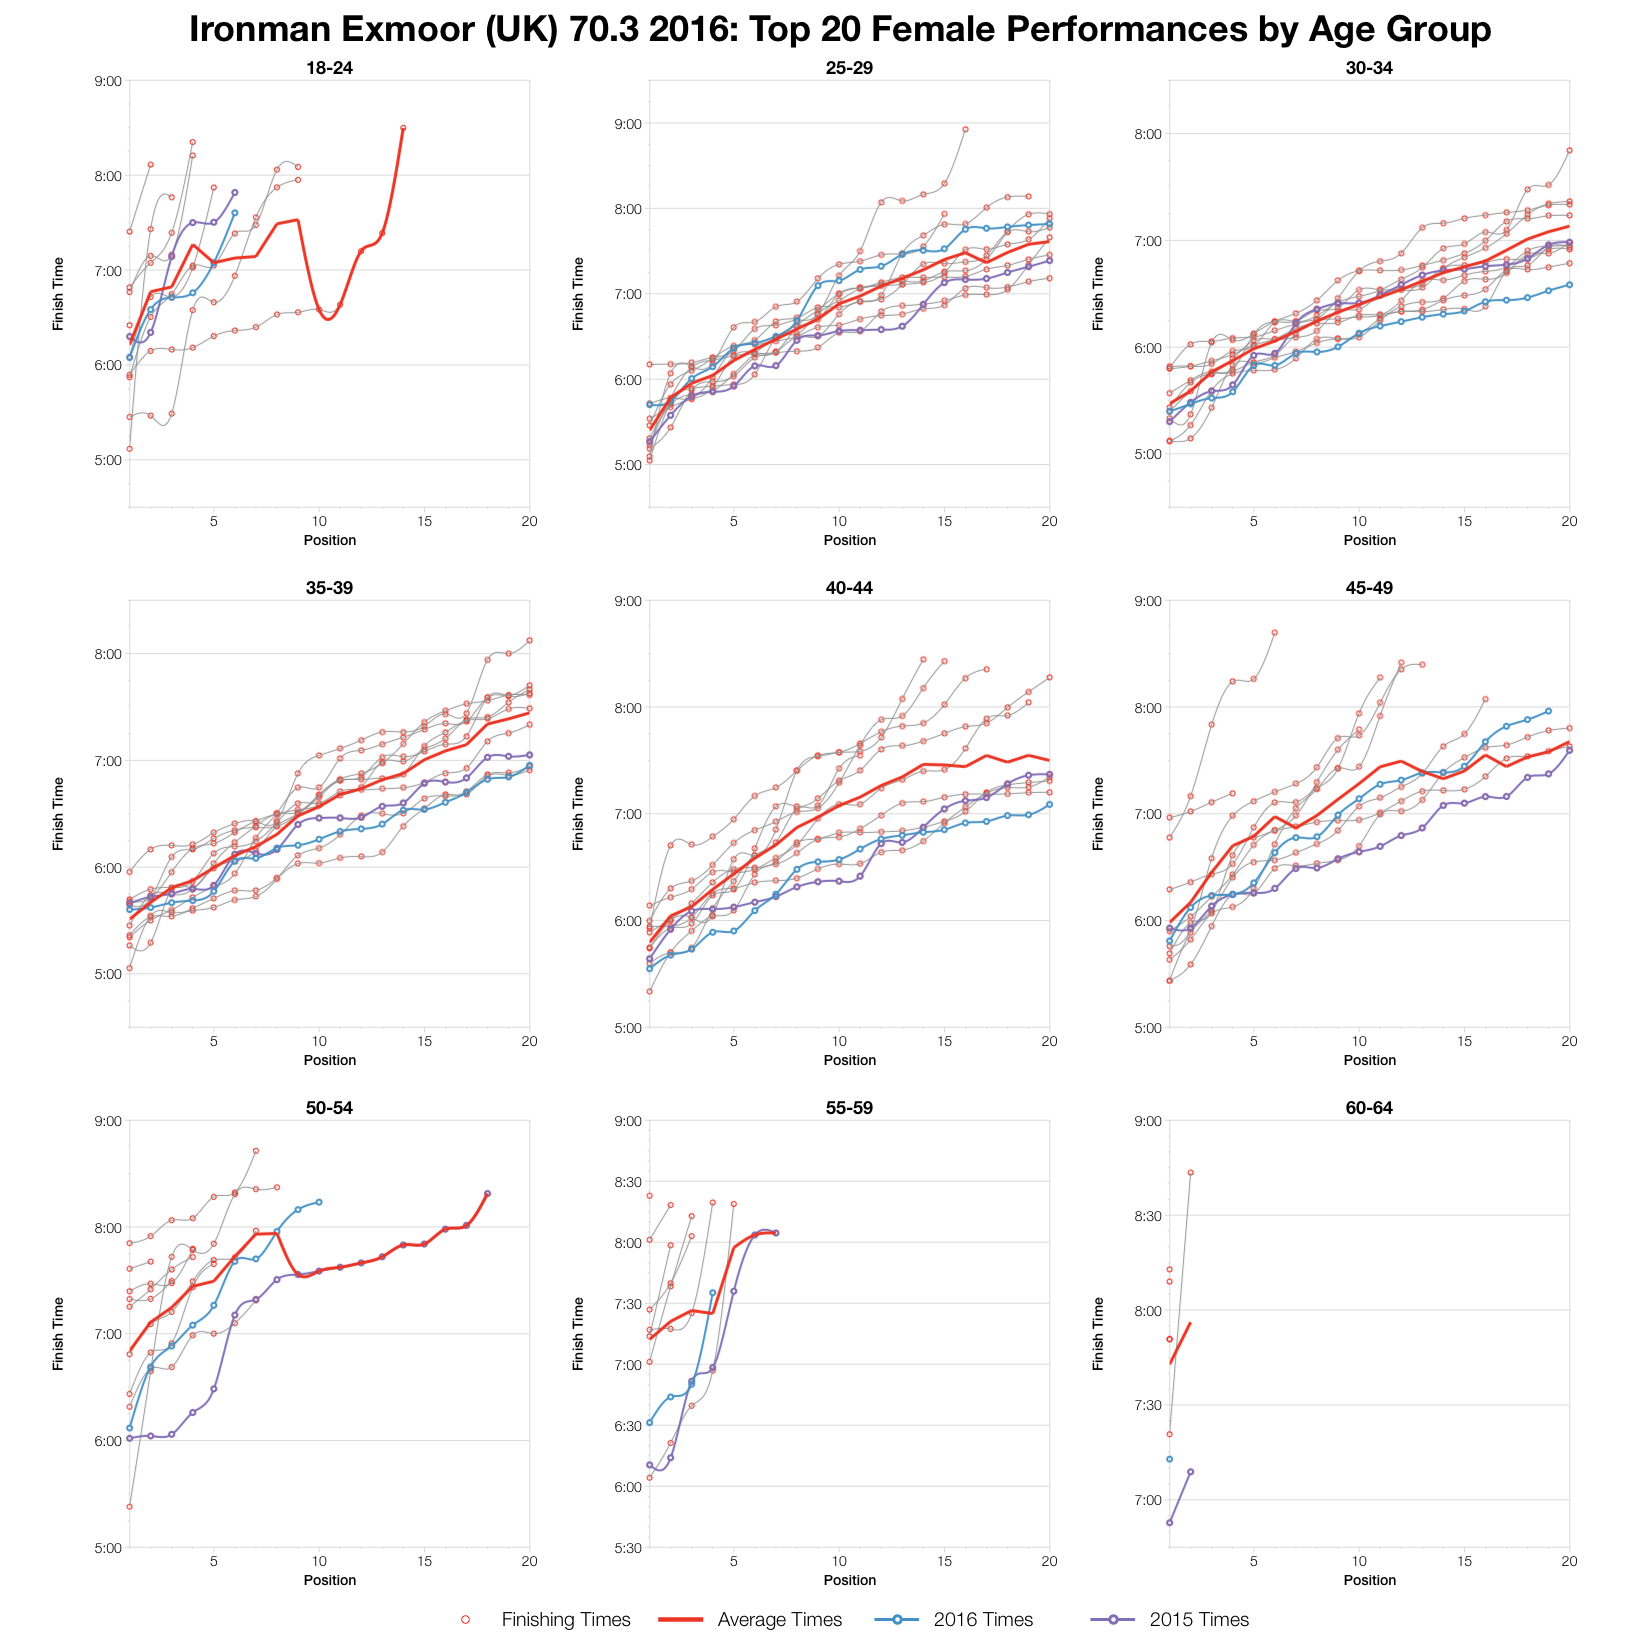
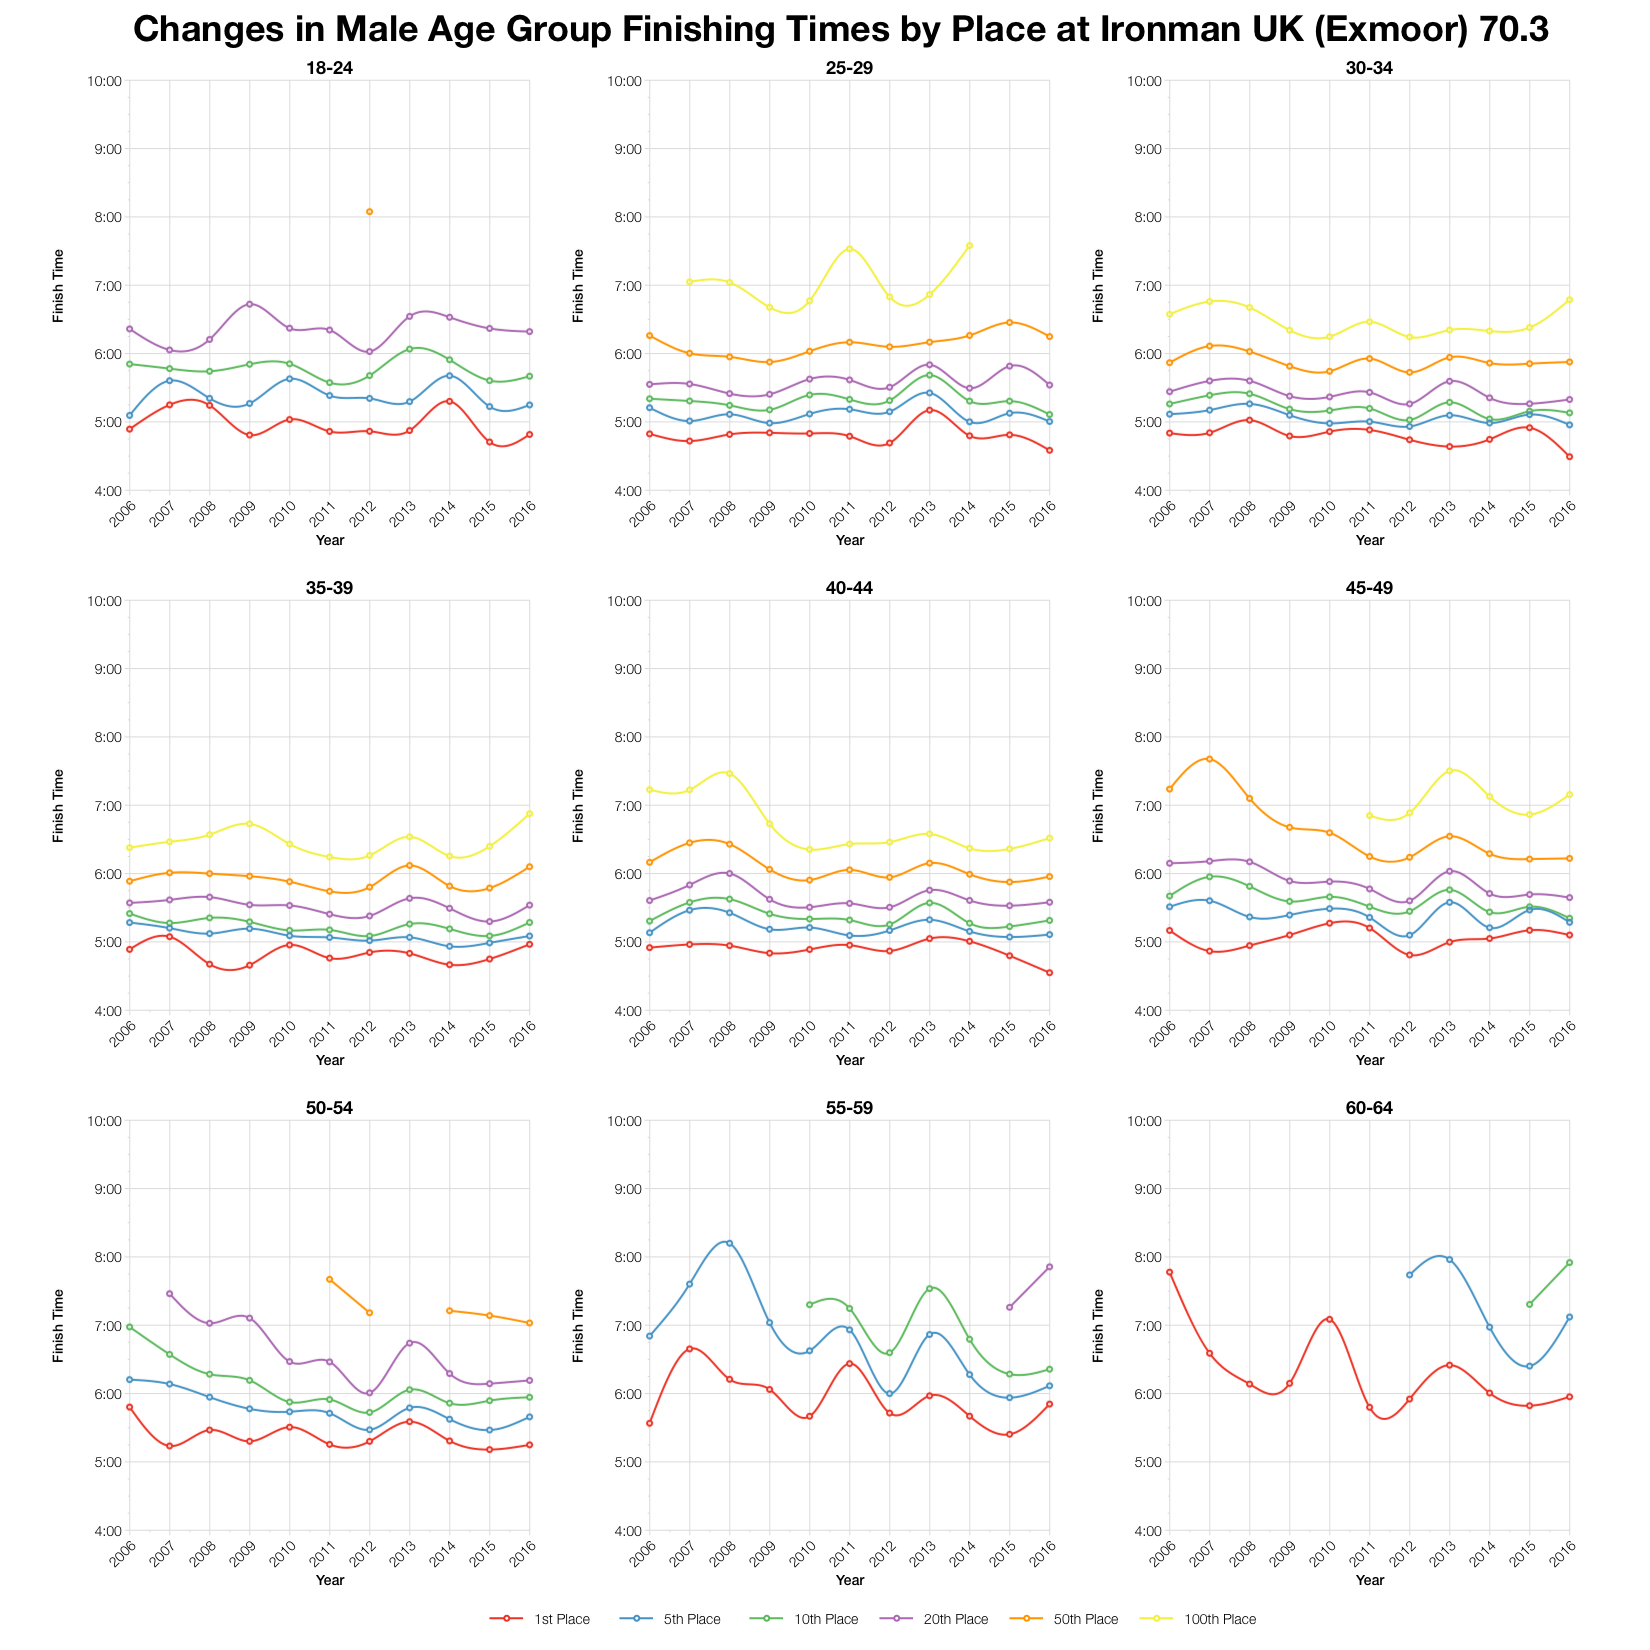
Again this is true when considering the times of the top twenty in each age group. There are divisions where times were well ahead of the averages, but for most they fall much closer to those means. There is no set pattern, although there certainly are some age groups that outperformed others. Overall it looks to have been a typical year of racing at Wimbleball.
You can view a spreadsheet of the full results and splits from Ironman Exmoor 70.3 2016 on my Google Drive.

