This week’s Ironman results and analysis come from Bolton, hosting its eighth Ironman UK. The course in Bolton should be considered challenging; even under the best conditions results are relatively slow with few athletes breaking 10 hours. Qualification times for the 40 Kona slots available tend to be at the slower end of the scale, but Ironman UK still remains a good qualification choice for a well prepared athlete.
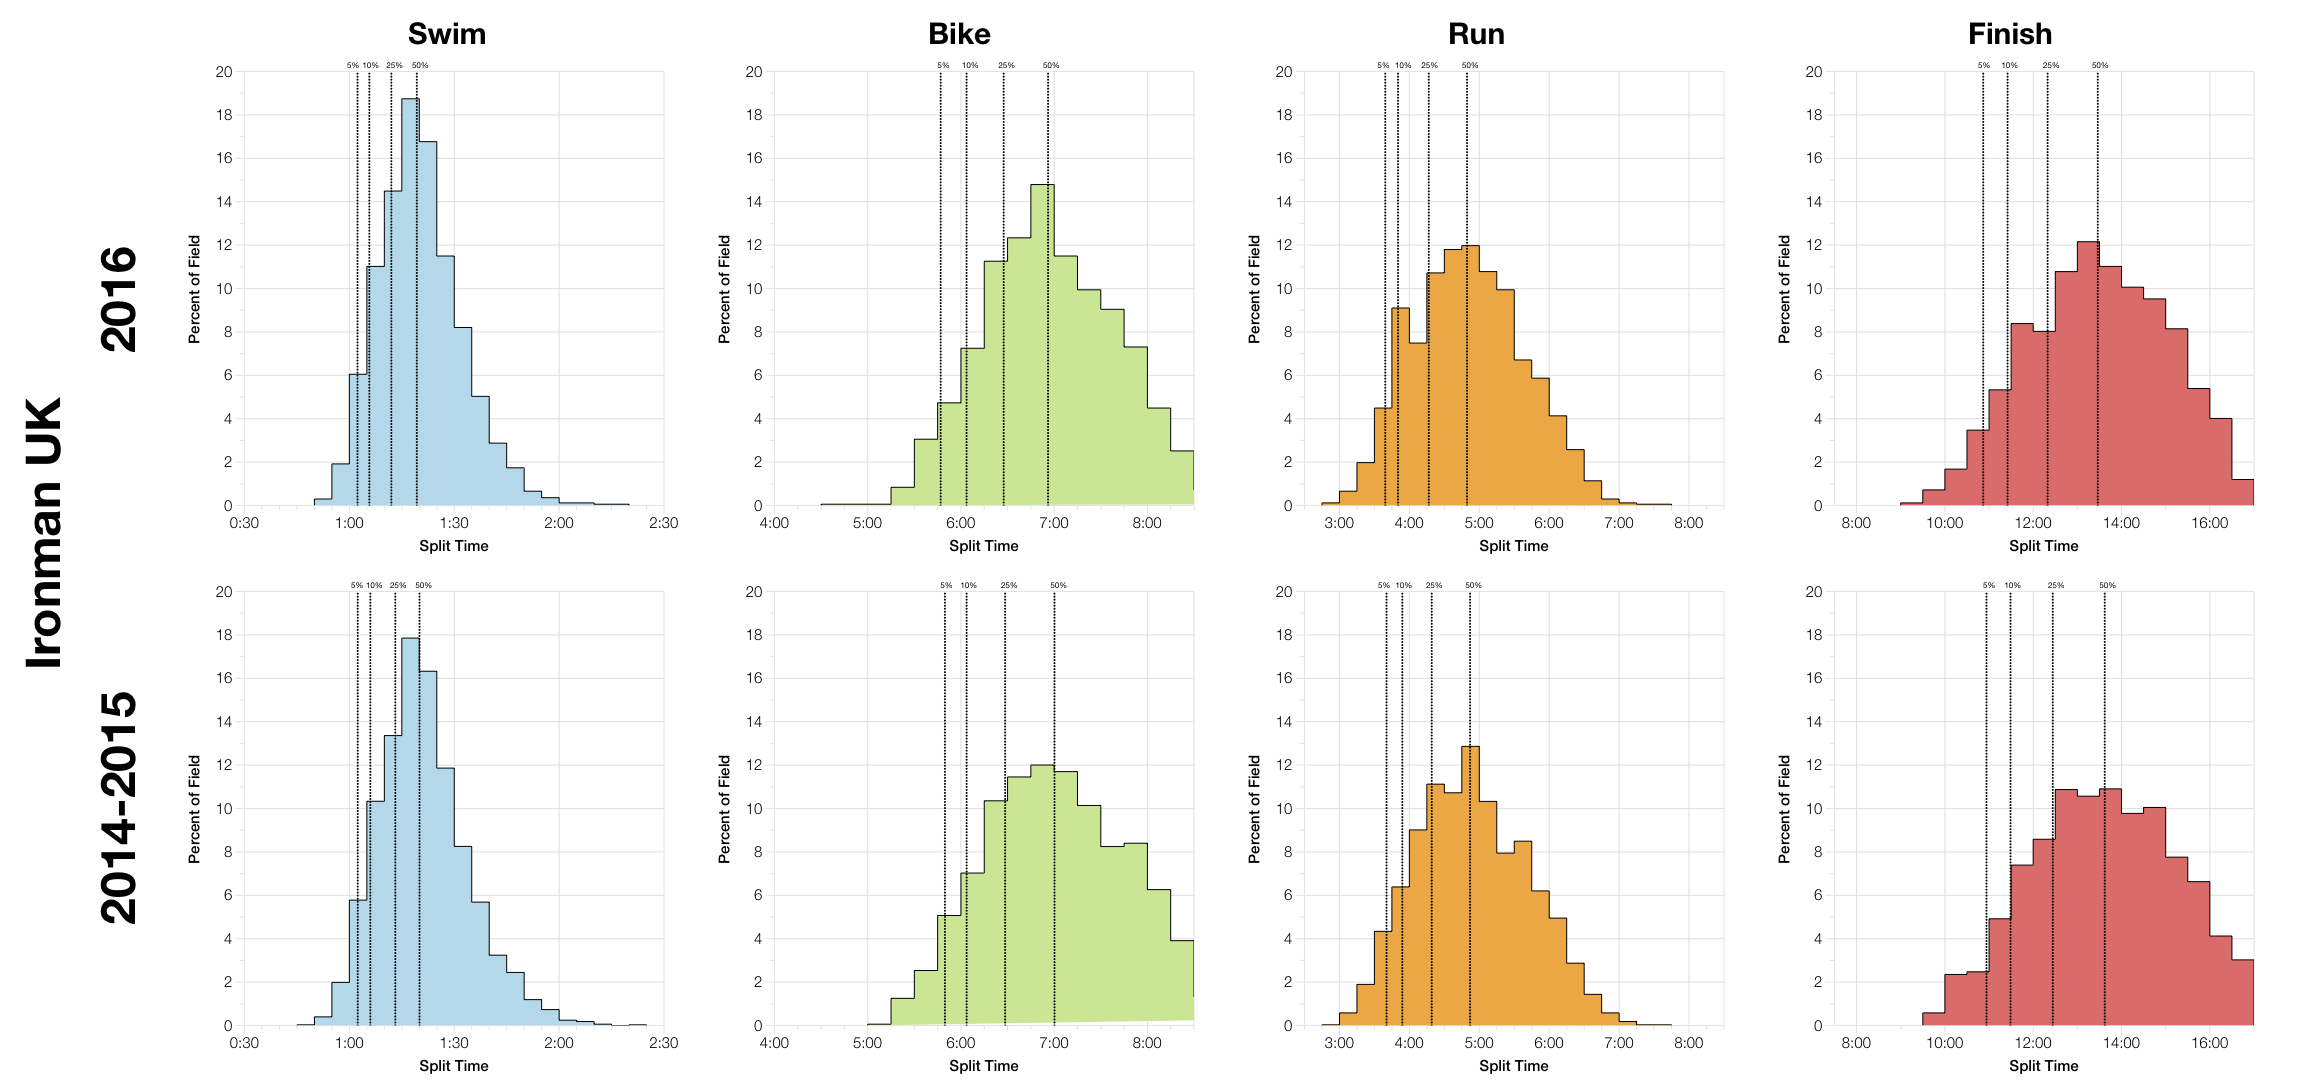
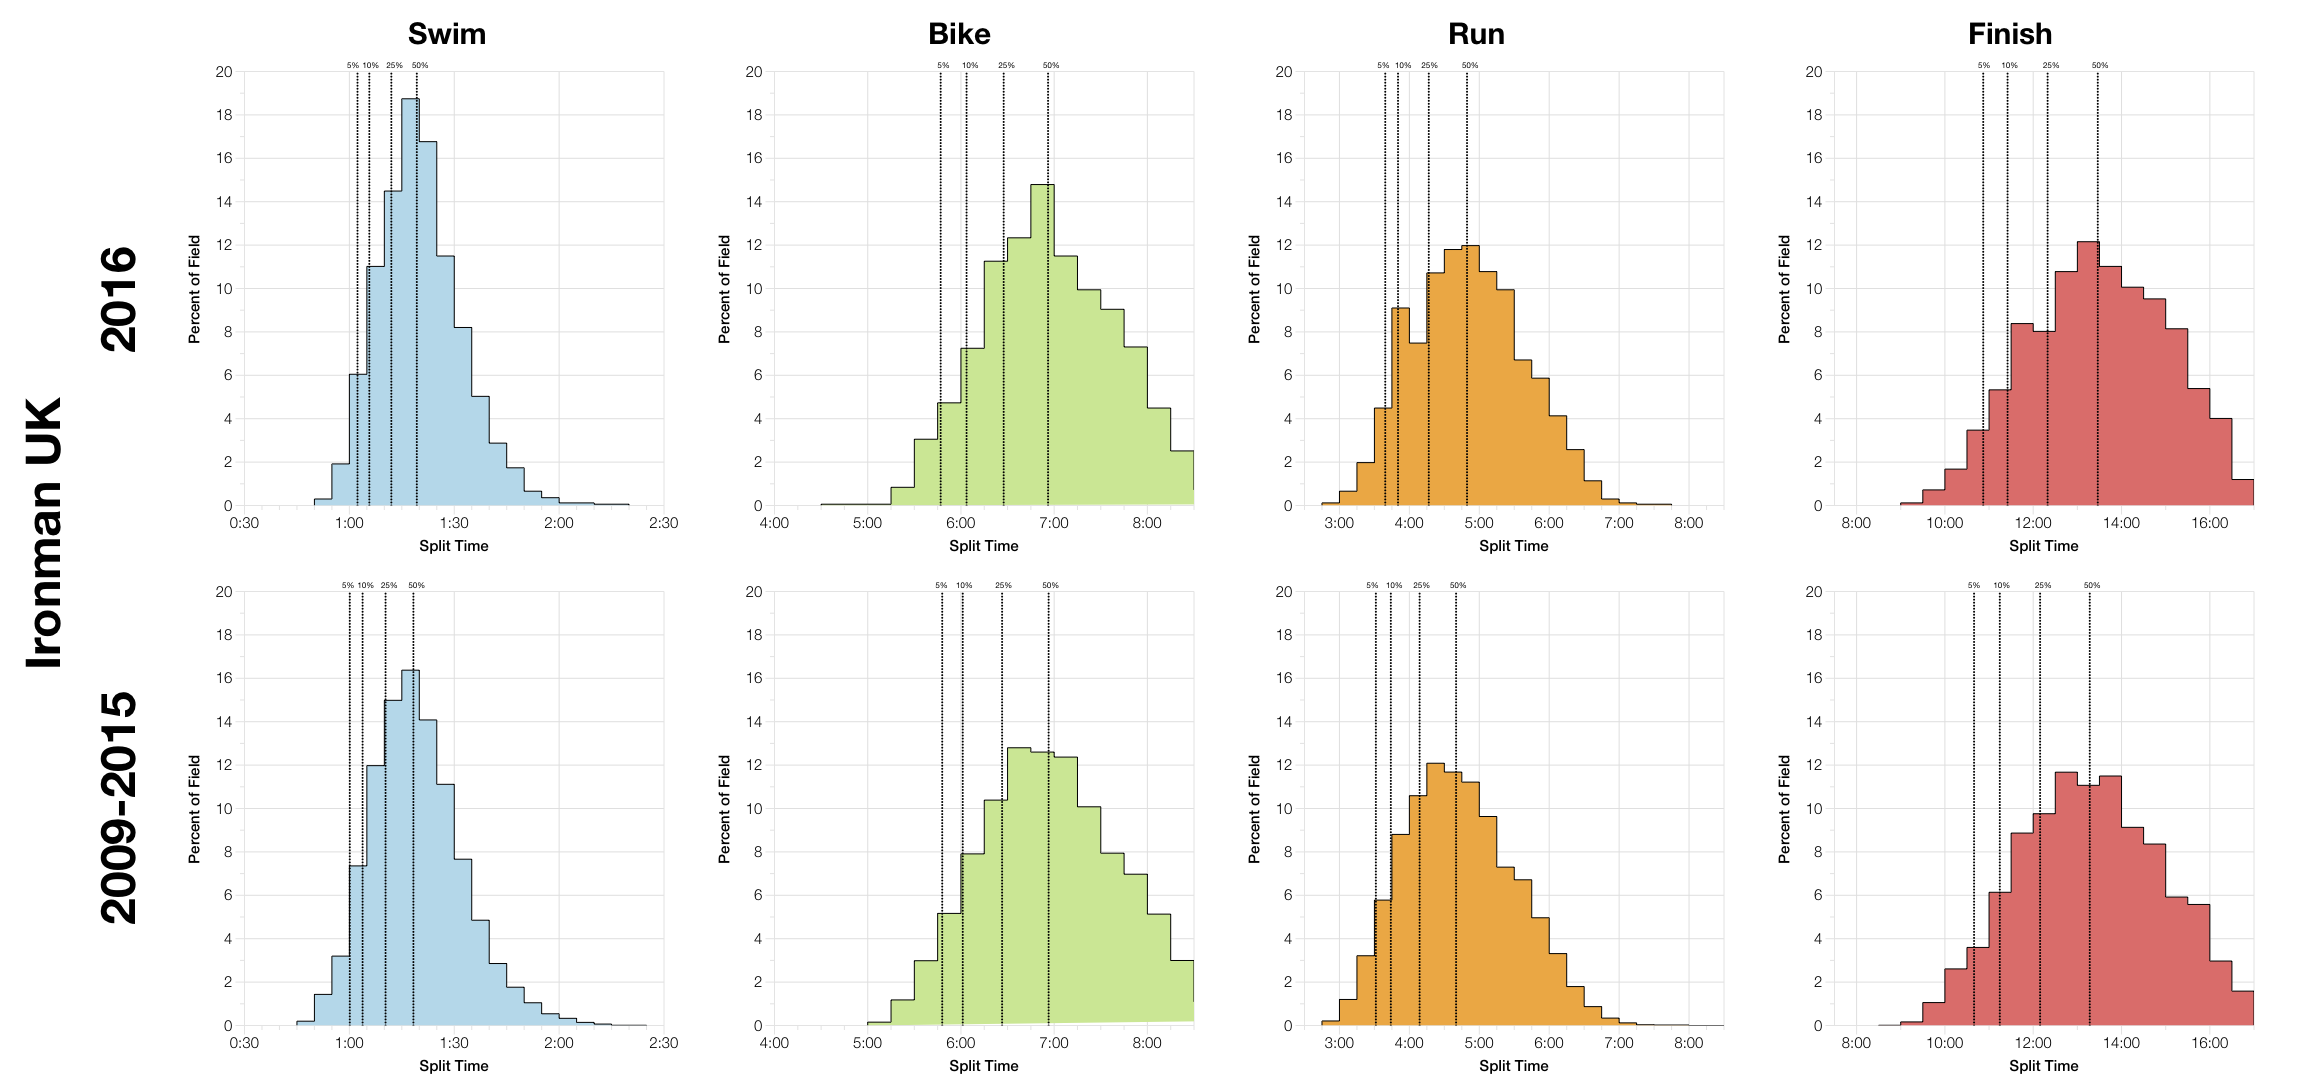
I’ve split the distribution comparison into two charts – the first focussing on results since bike course changes in 2014 and the second looking at results since the race moved to Bolton. The change in bike course resulted in slower bike splits, although none of the differences are that significant. This year’s race trends slightly faster than the previous two years, but remains distinctly slower than Bolton results as a whole. Although it is worth noting a lot of this change comes from the run and there were discrepancies in course length in the early years of this race.
In general this years race looks comparable with previous results on this course. Performances appear to be favourable, but the margins are small and not likely to represent any significant change.
| Listed Athletes | Swim Finish | Swim DNS/DNF | Bike Finish | Bike DNF | Run Finish | Run DNF | Overall DNS/DNF | |
|---|---|---|---|---|---|---|---|---|
| 2007 | 1560 | 1232 | 21% | 1169 | 5.1% | 1129 | 3.4% | 27.5% |
| 2008 | 1650 | 1281 | 22.4% | 1223 | 4.5% | 1193 | 2.5% | 27.6% |
| 2009 | 1652 | 1371 | 17% | 1285 | 6.3% | 1260 | 1.9% | 23.7% |
| 2010 | 1371 | 1104 | 19.5% | 1067 | 3.4% | 1050 | 1.6% | 23.3% |
| 2011 | 1276 | 1080 | 15.4% | 1061 | 1.8% | 1037 | 2.3% | 18.7% |
| 2012 | 1279 | 1274 | 0.4% | 1236 | 3% | 1180 | 4.5% | 7.7% |
| 2013 | 1600 | 1429 | 10.7% | 1393 | 2.5% | 1355 | 2.7% | 15.3% |
| 2014 | 1982 | 1735 | 12.5% | 1643 | 5.3% | 1602 | 2.5% | 19.1% |
| 2015 | 2157 | 1856 | 14% | 1758 | 5.3% | 1707 | 2.9% | 20.9% |
| 2016 | 2094 | 1817 | 13.2% | 1741 | 4.2% | 1685 | 3.2% | 19.5% |
This year also appears to fall in line with DNS and DNF rates for the current course. DNFs were a touch higher on the run this year and slightly lower on the bike, but overall the figures are comparable.
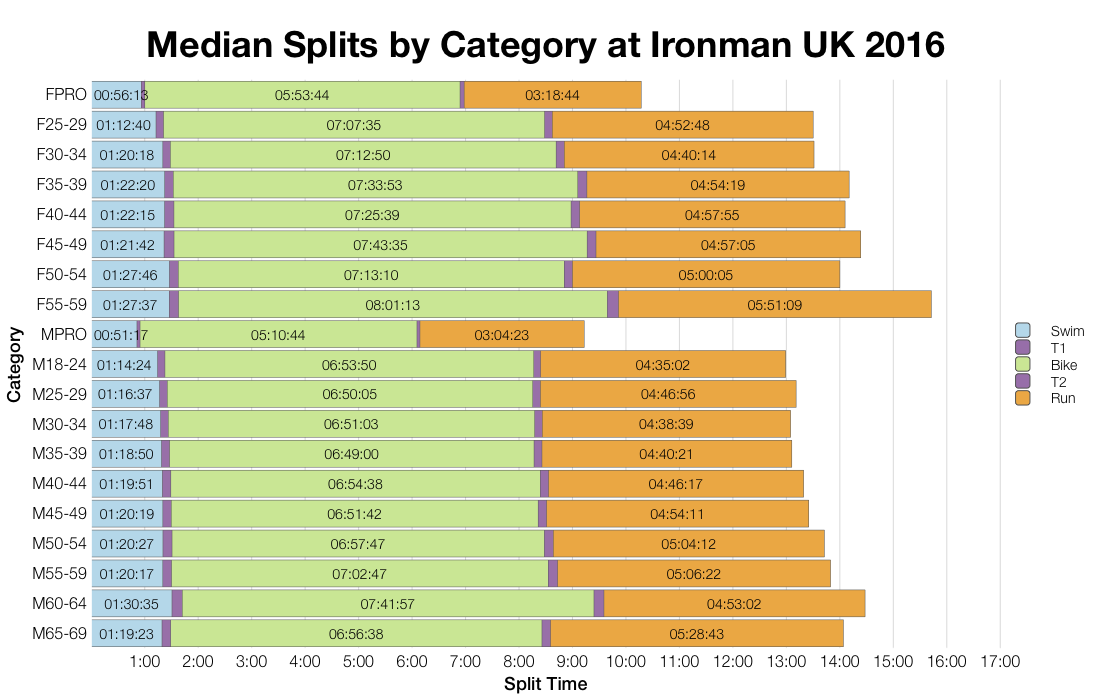
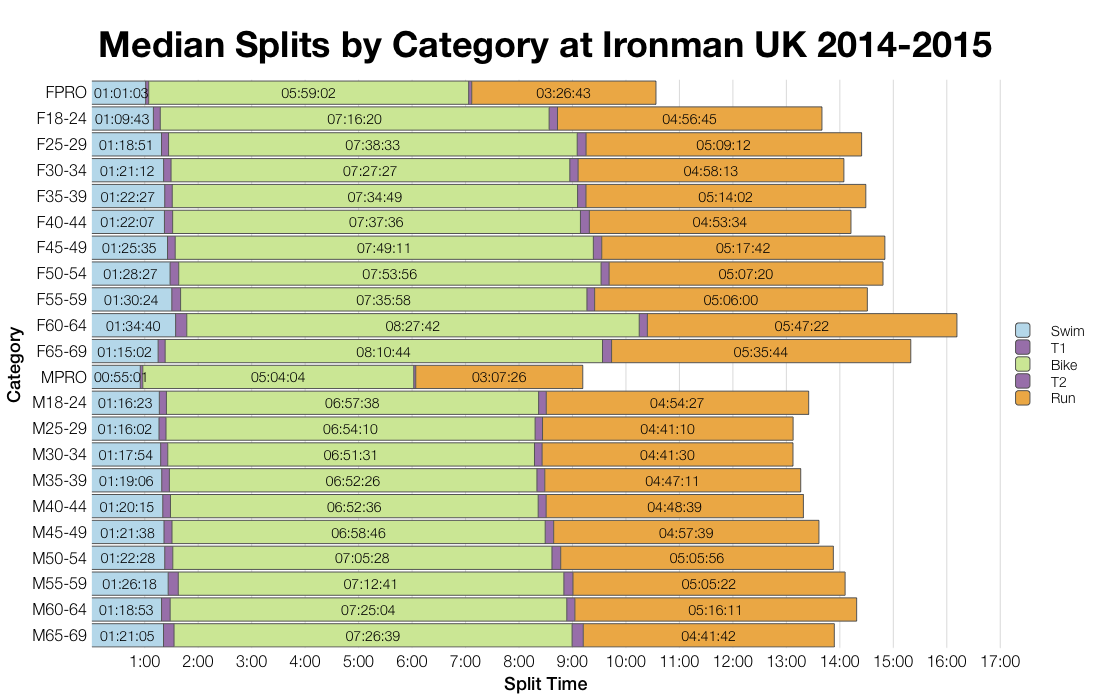
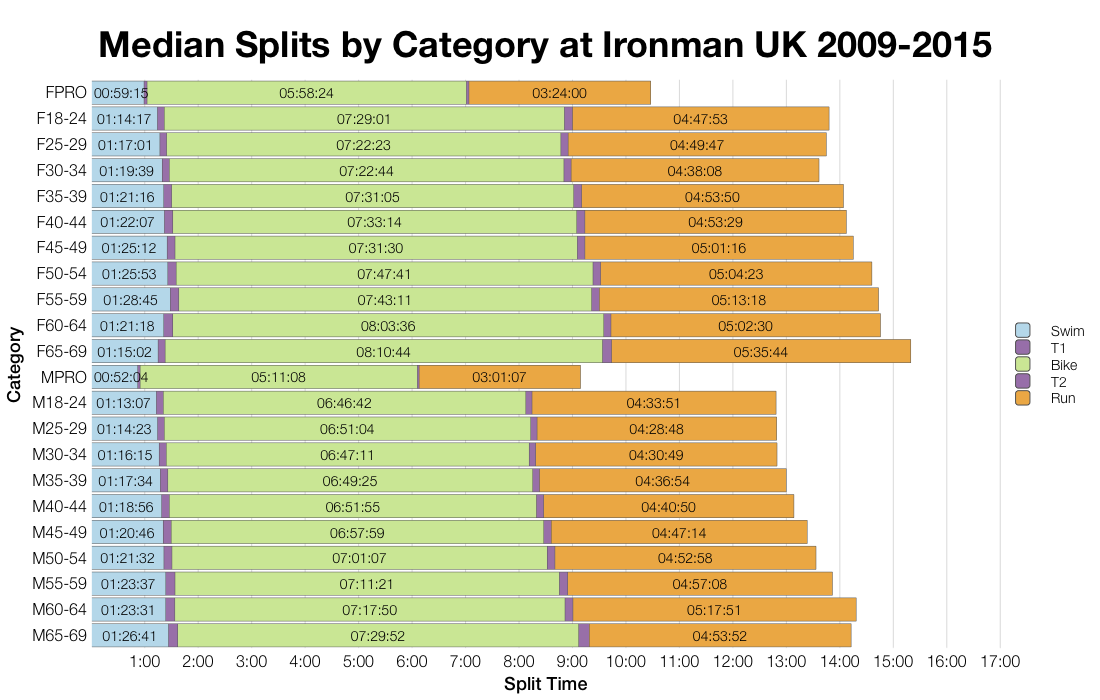
Again, I’ve separated median charts for the most recent bike course and for the race as a whole. You can pick out specific detail for age groups here, but the trends seen in the distribution charts tend to hold true. Variations between this year and the last 2 years in Bolton are small and while 2016 appears to trend slightly faster, it’s not by much.
| Count | Percentage | |
|---|---|---|
| United Kingdom | 1846 | 88.2 |
| Ireland | 64 | 3.1 |
| United States | 22 | 1.1 |
| France | 17 | 0.8 |
| Belgium | 14 | 0.7 |
| Germany | 13 | 0.6 |
| Italy | 12 | 0.6 |
| Sweden | 12 | 0.6 |
| Australia | 9 | 0.4 |
| Poland | 7 | 0.3 |
Ironman UK is very much a local race with the vast majority of the field being drawn from the UK.
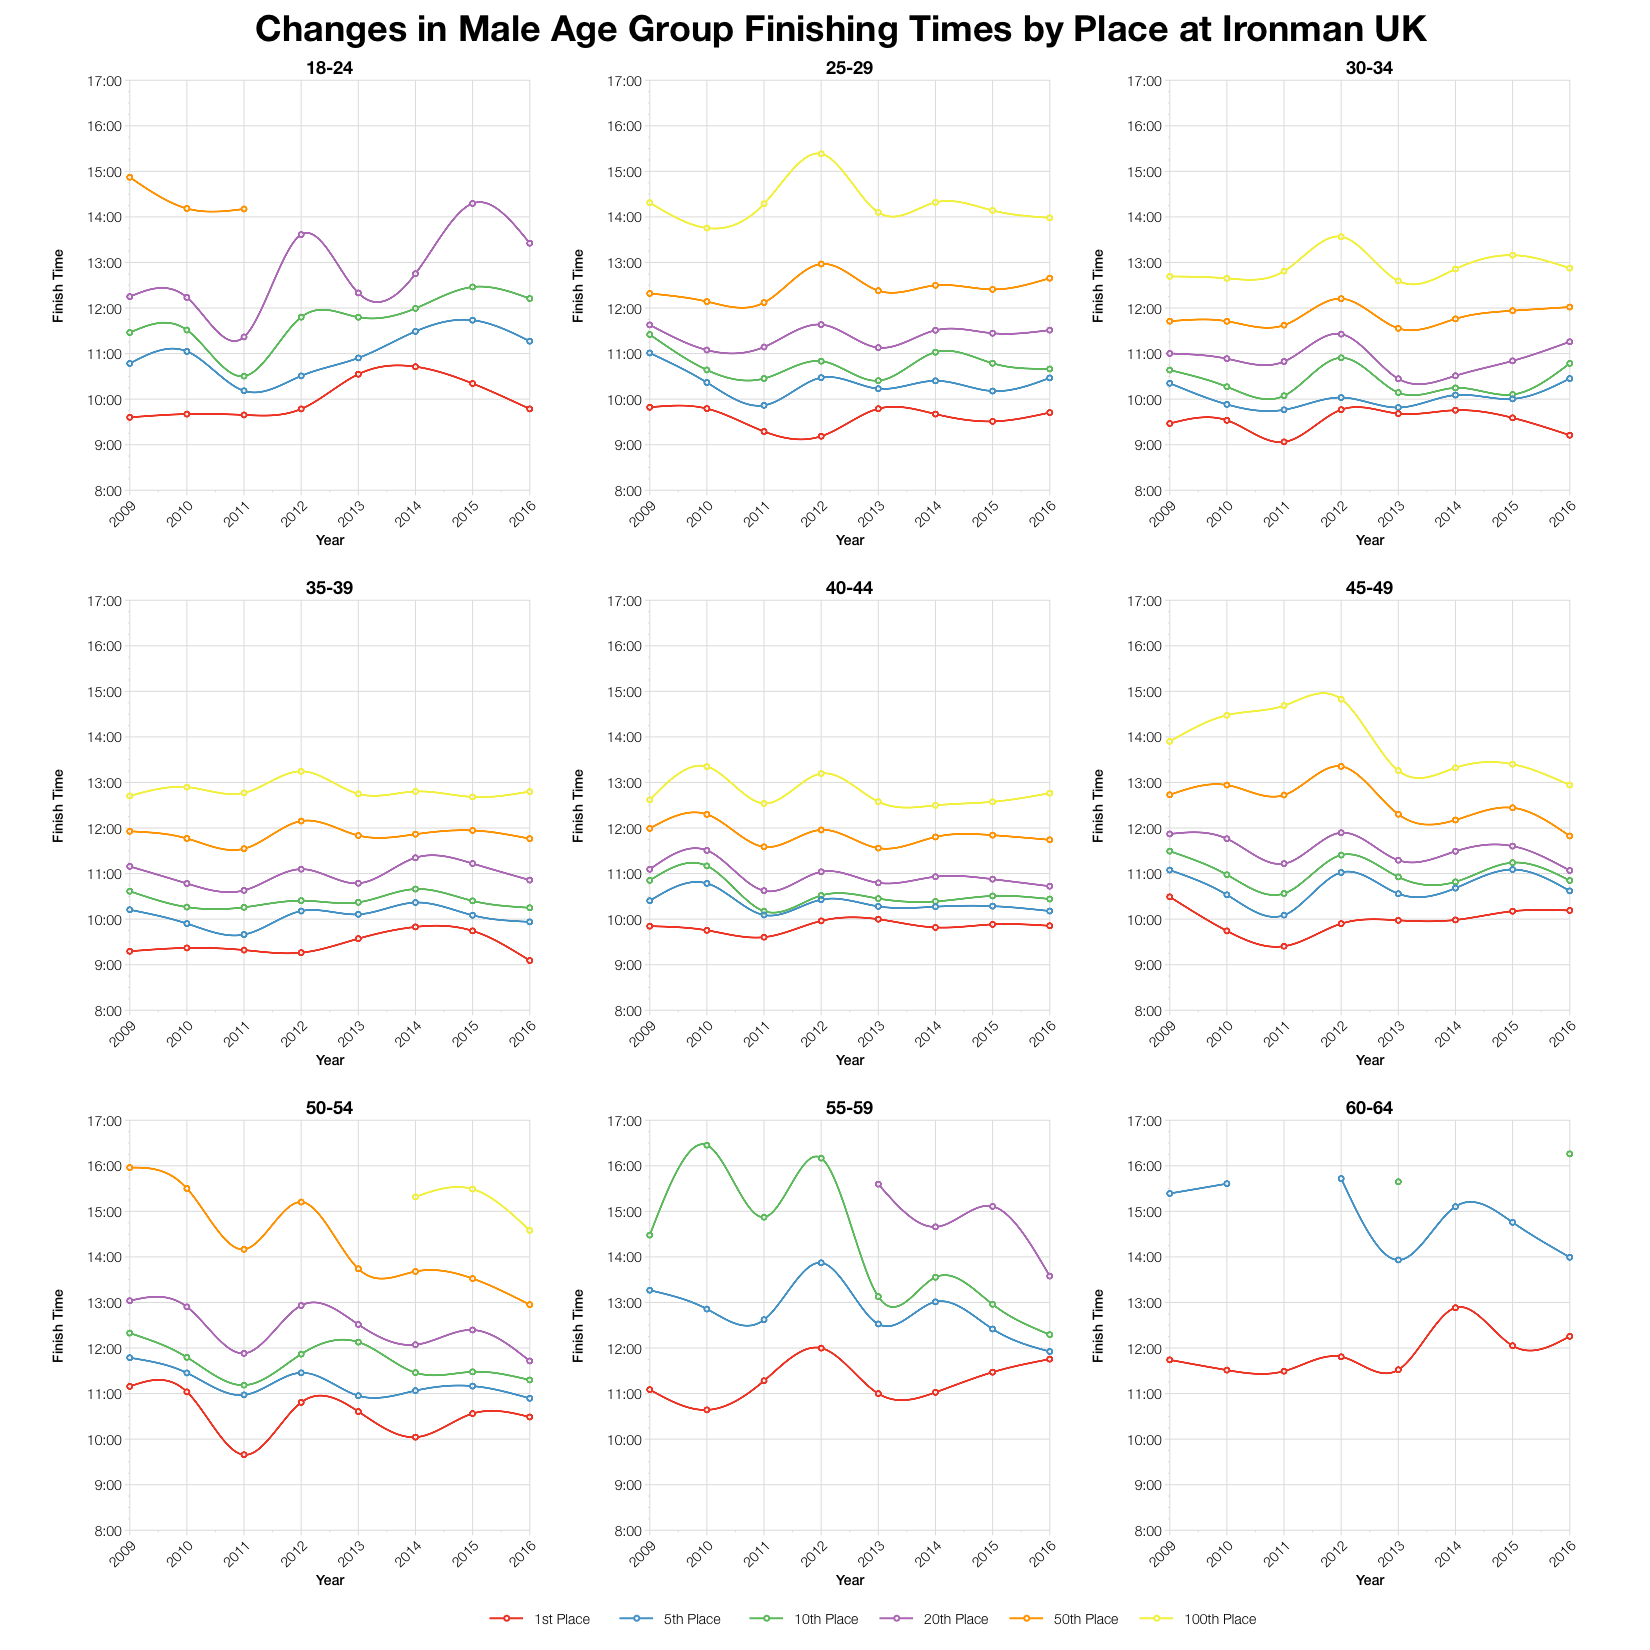
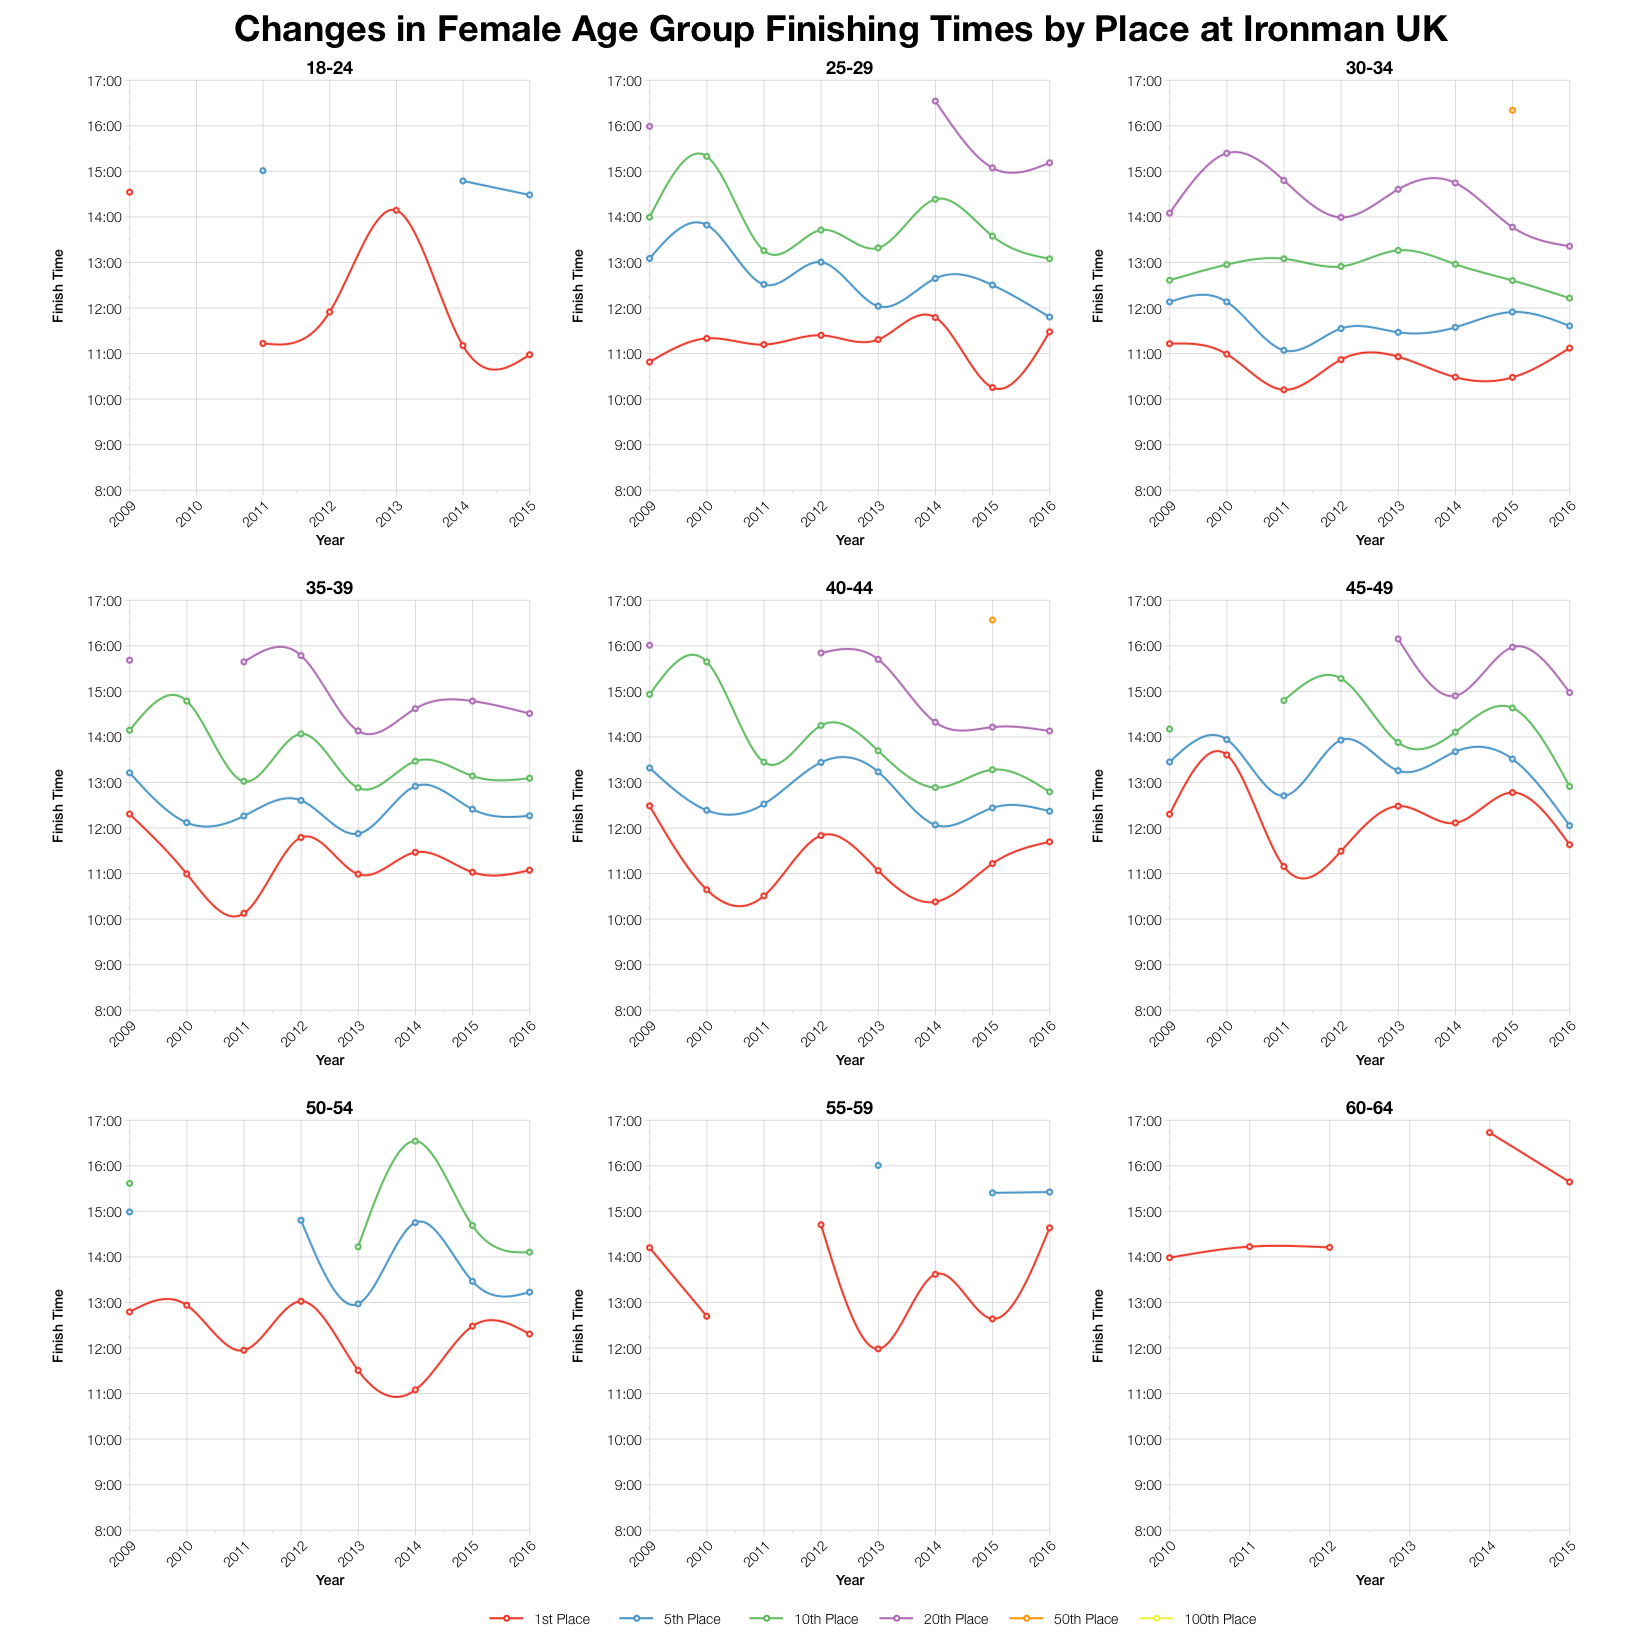
There are no obvious trends in times over the last 8 years of racing in Bolton. Naturally, there’s variation year-on-year, but no significant shift in any direction for final results. This year’s race is again largely comparable with the last couple.
| Slots | Winner | Average Kona Qualifier | Final Qualifier | |
|---|---|---|---|---|
| M18-24 | 1 | 9:47:07 | 9:47:07 | 9:47:07 |
| M25-29 | 3 | 9:42:17 | 9:49:27 | 9:55:45 |
| M30-34 | 4 | 9:12:30 | 9:45:00 | 10:19:42 |
| M35-39 | 4 | 9:05:28 | 9:35:48 | 9:50:48 |
| M40-44 | 5 | 9:51:15 | 10:05:23 | 10:10:40 |
| M45-49 | 4 | 10:11:26 | 10:22:46 | 10:35:15 |
| M50-54 | 3 | 10:29:09 | 10:32:58 | 10:35:52 |
| M55-59 | 2 | 11:45:25 | 11:45:55 | 11:46:25 |
| M60-64 | 1 | 12:15:25 | 12:15:25 | 12:15:25 |
| M65-69 | 1 | 12:50:45 | 12:50:45 | 12:50:45 |
| M70-74 | 1 | 15:29:43 | 15:29:43 | 15:29:43 |
| F25-29 | 1 | 11:28:50 | 11:28:50 | 11:28:50 |
| F30-34 | 2 | 11:07:26 | 11:13:13 | 11:19:01 |
| F35-39 | 1 | 11:04:41 | 11:04:41 | 11:04:41 |
| F40-44 | 2 | 11:42:02 | 11:46:29 | 11:50:57 |
| F45-49 | 1 | 11:38:13 | 11:38:13 | 11:38:13 |
| F50-54 | 1 | 12:18:33 | 12:18:33 | 12:18:33 |
| F55-59 | 1 | 14:38:30 | 14:38:30 | 14:38:30 |
Based on the entry list I’ve estimated the number of Kona slots each age group should receive and used this to calculate the likely times for automatic qualification. Variation in start and finisher numbers may impact this and roll down is always a possibility. You can compare these figures with previous years and other races on my Kona Qualification page.
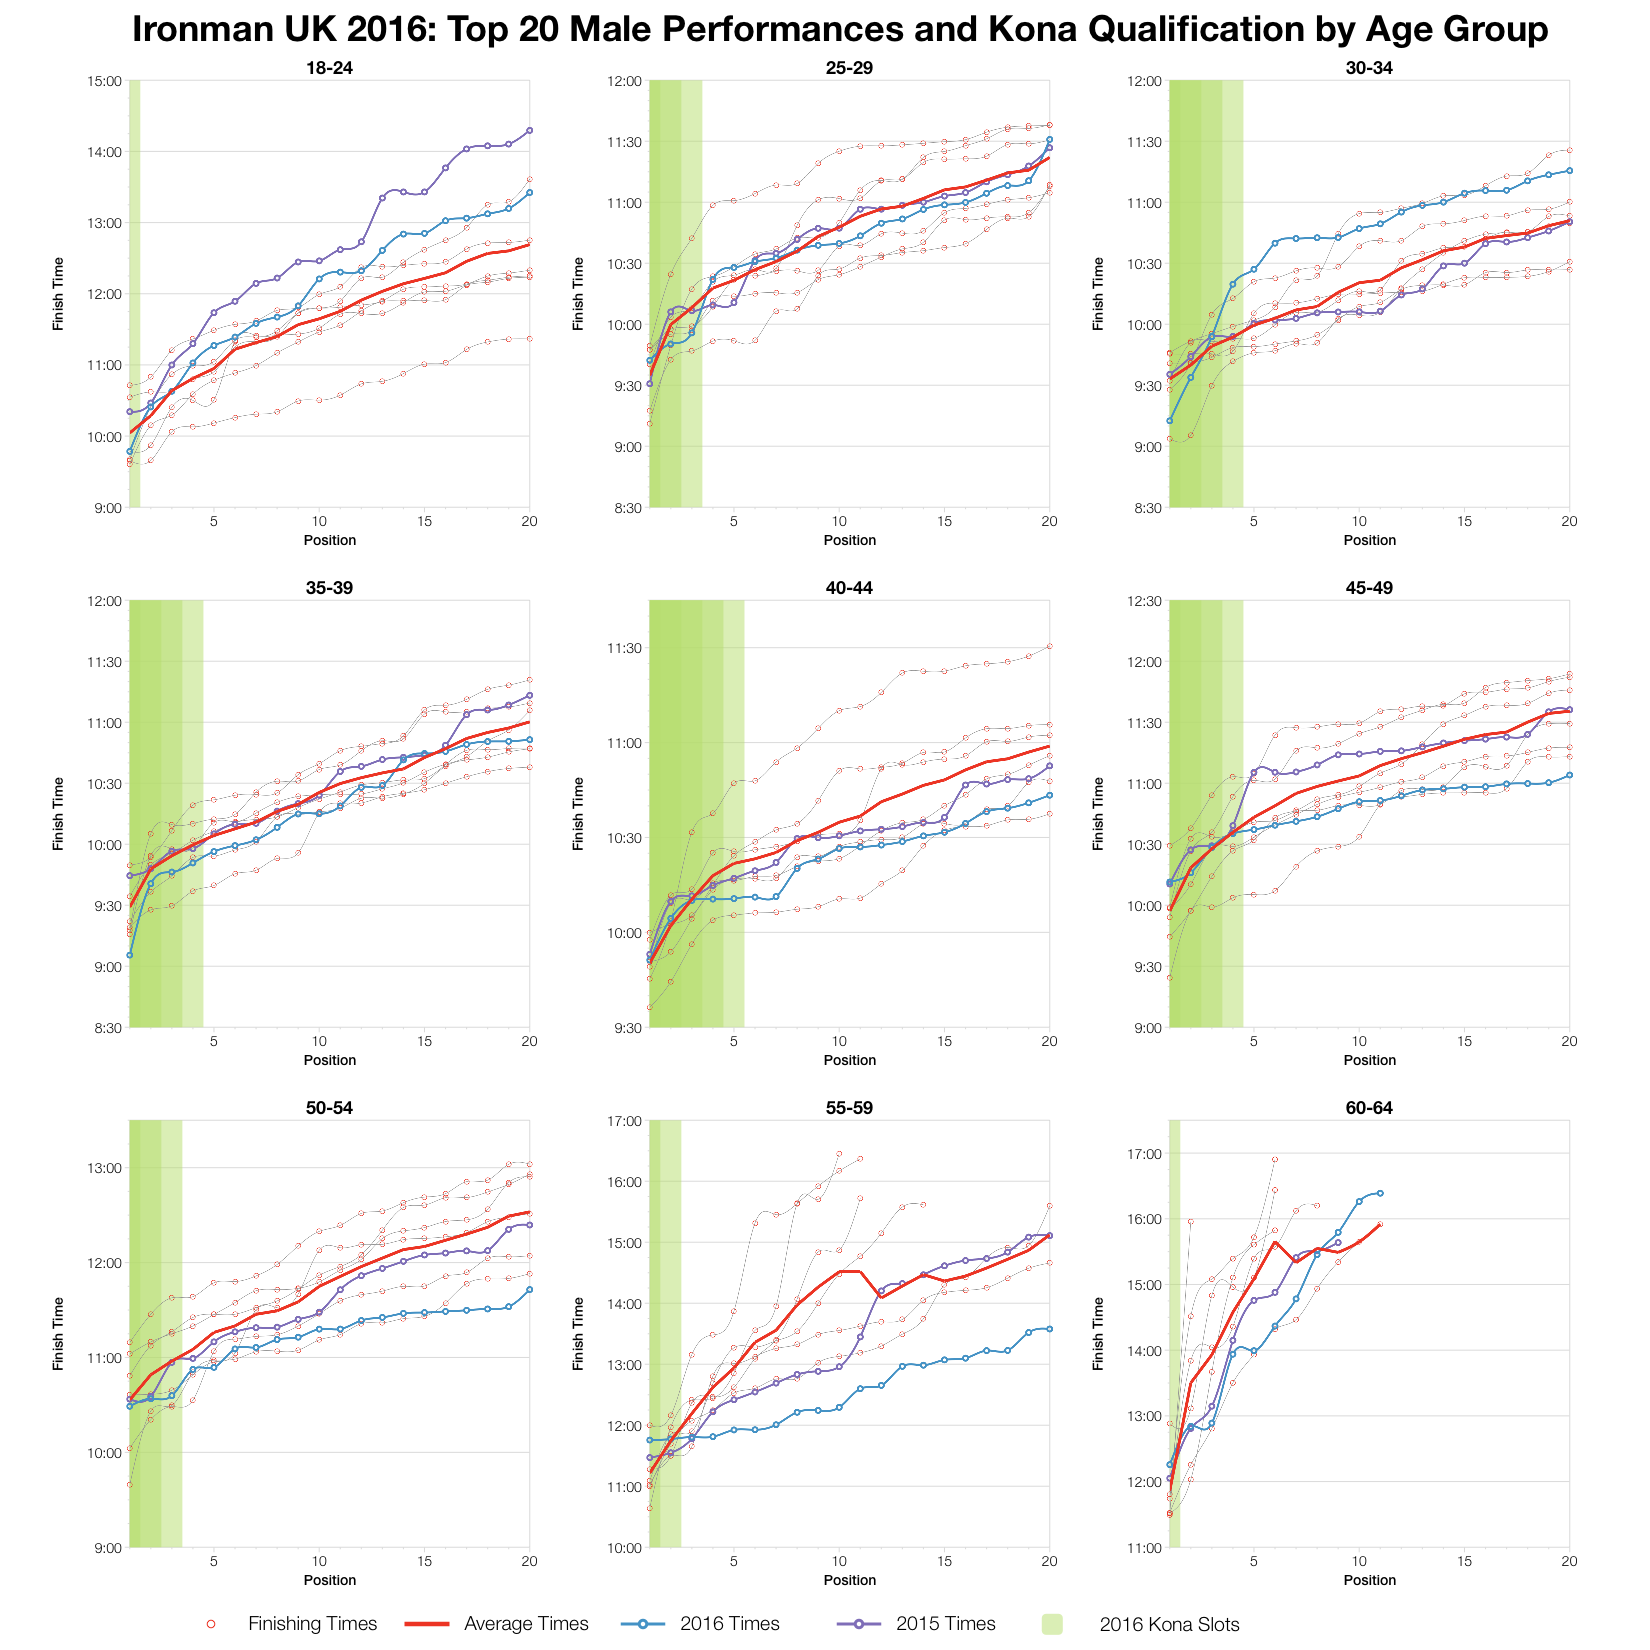
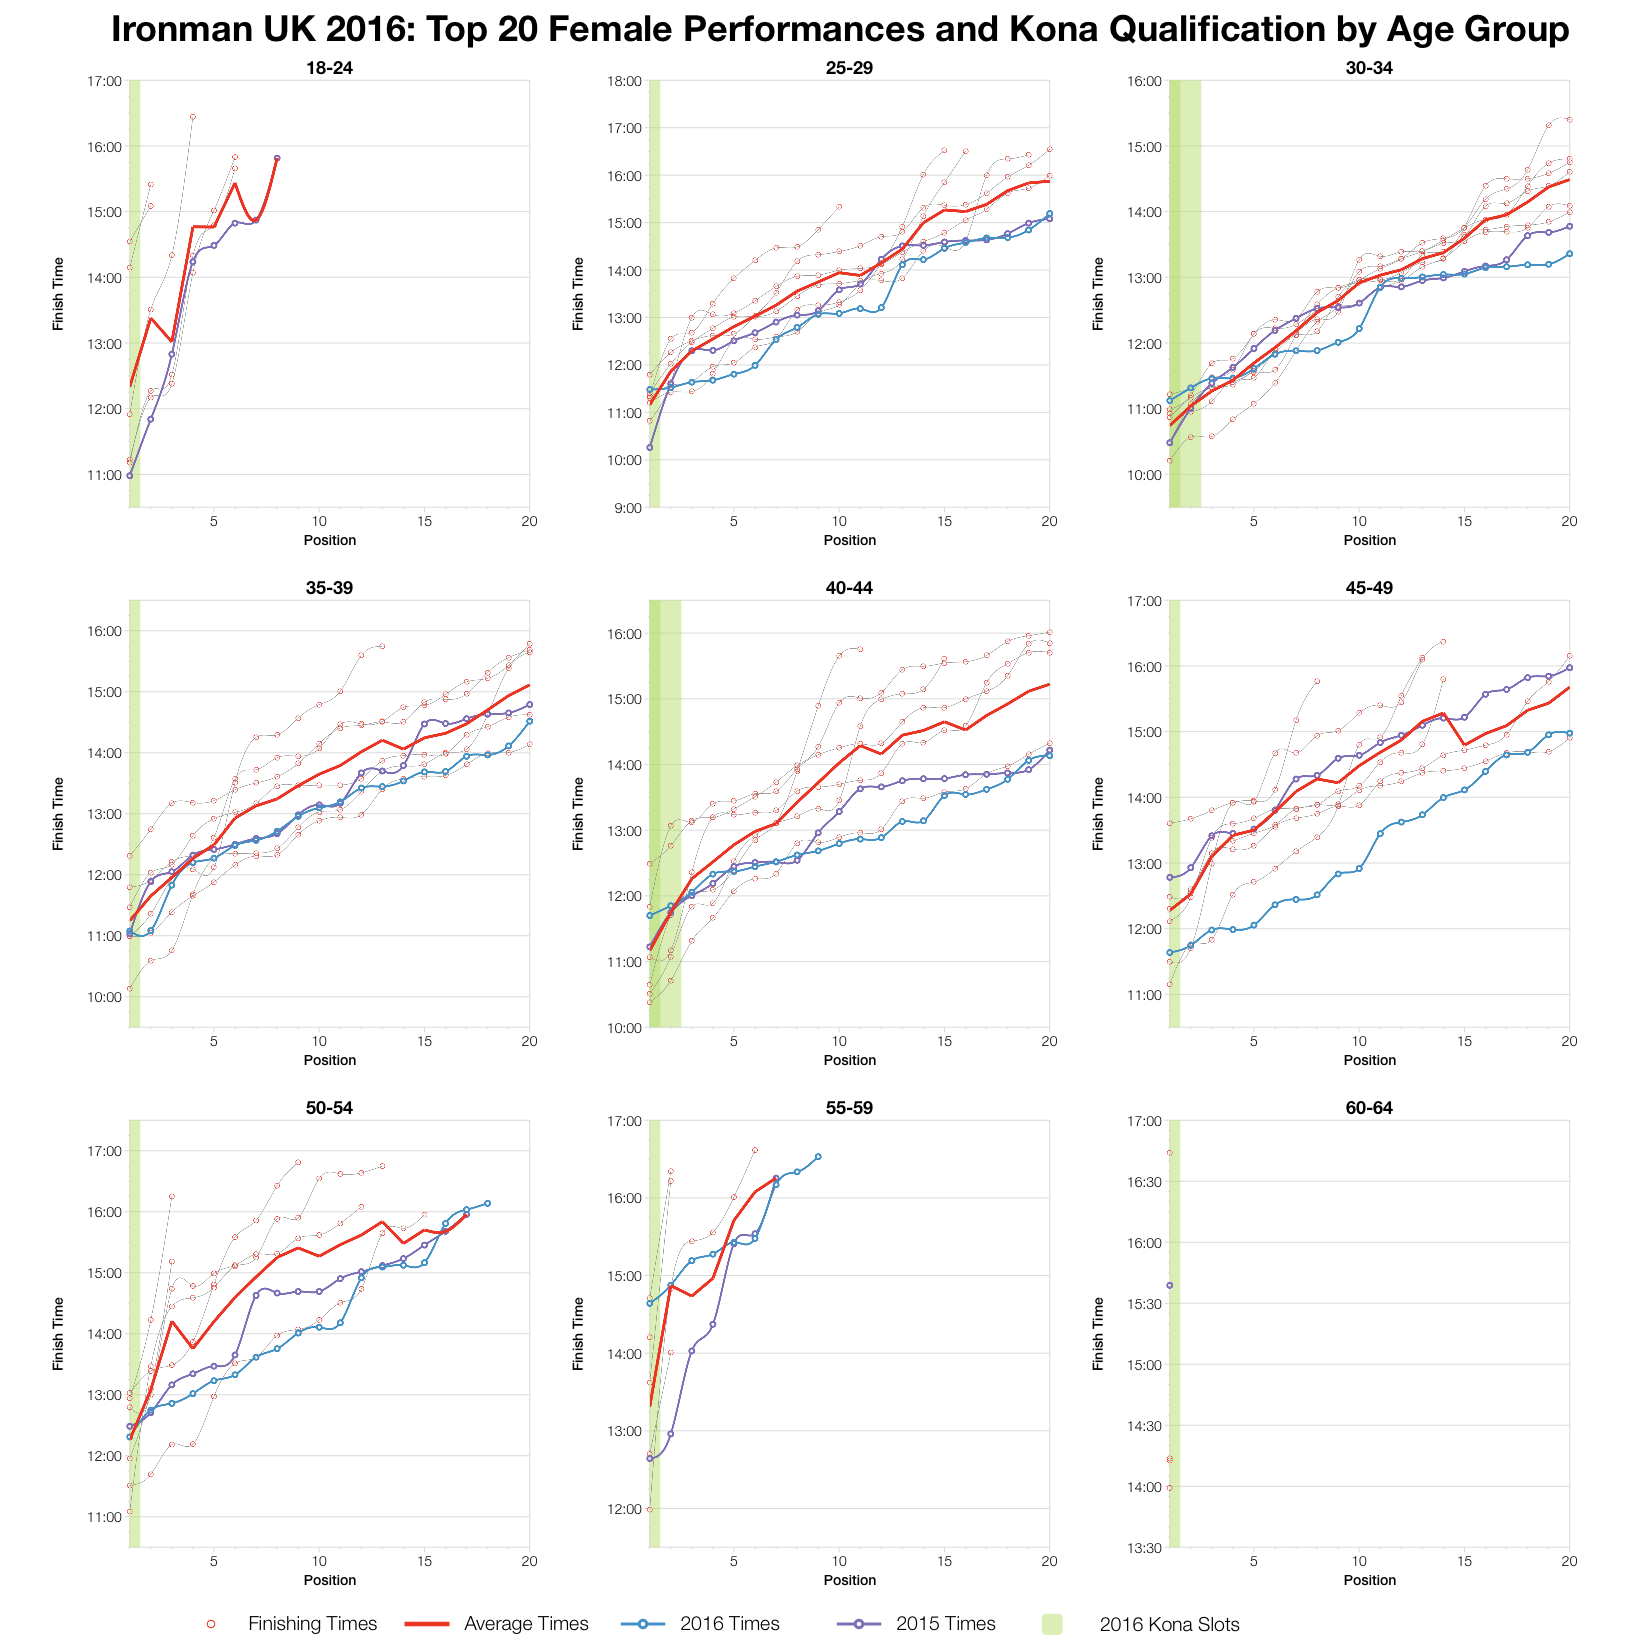
This year’s top twenty results fall in the average to slightly-above average bracket. There are a couple of age groups where we see much better results, generally older male and female athletes. For the major component of the field, male 35-50, results are better than last year and the averages. The general trend of times from first back to twentieth seems consistent with previous years in Bolton.
You can access a spreadsheet of the full results and splits from Ironman UK 2016 on my Google Drive.


