Although there are lots of long distance triathlons outside the Ironman brand I currently only analyse results from one: Challenge Roth. It’s a major event, a race I love, and on a practical level its results are easy to download and add to my database. There are no Kona slots to consider here and this year’s race looks to have conformed with past results so this will be a very quick look at the stats.
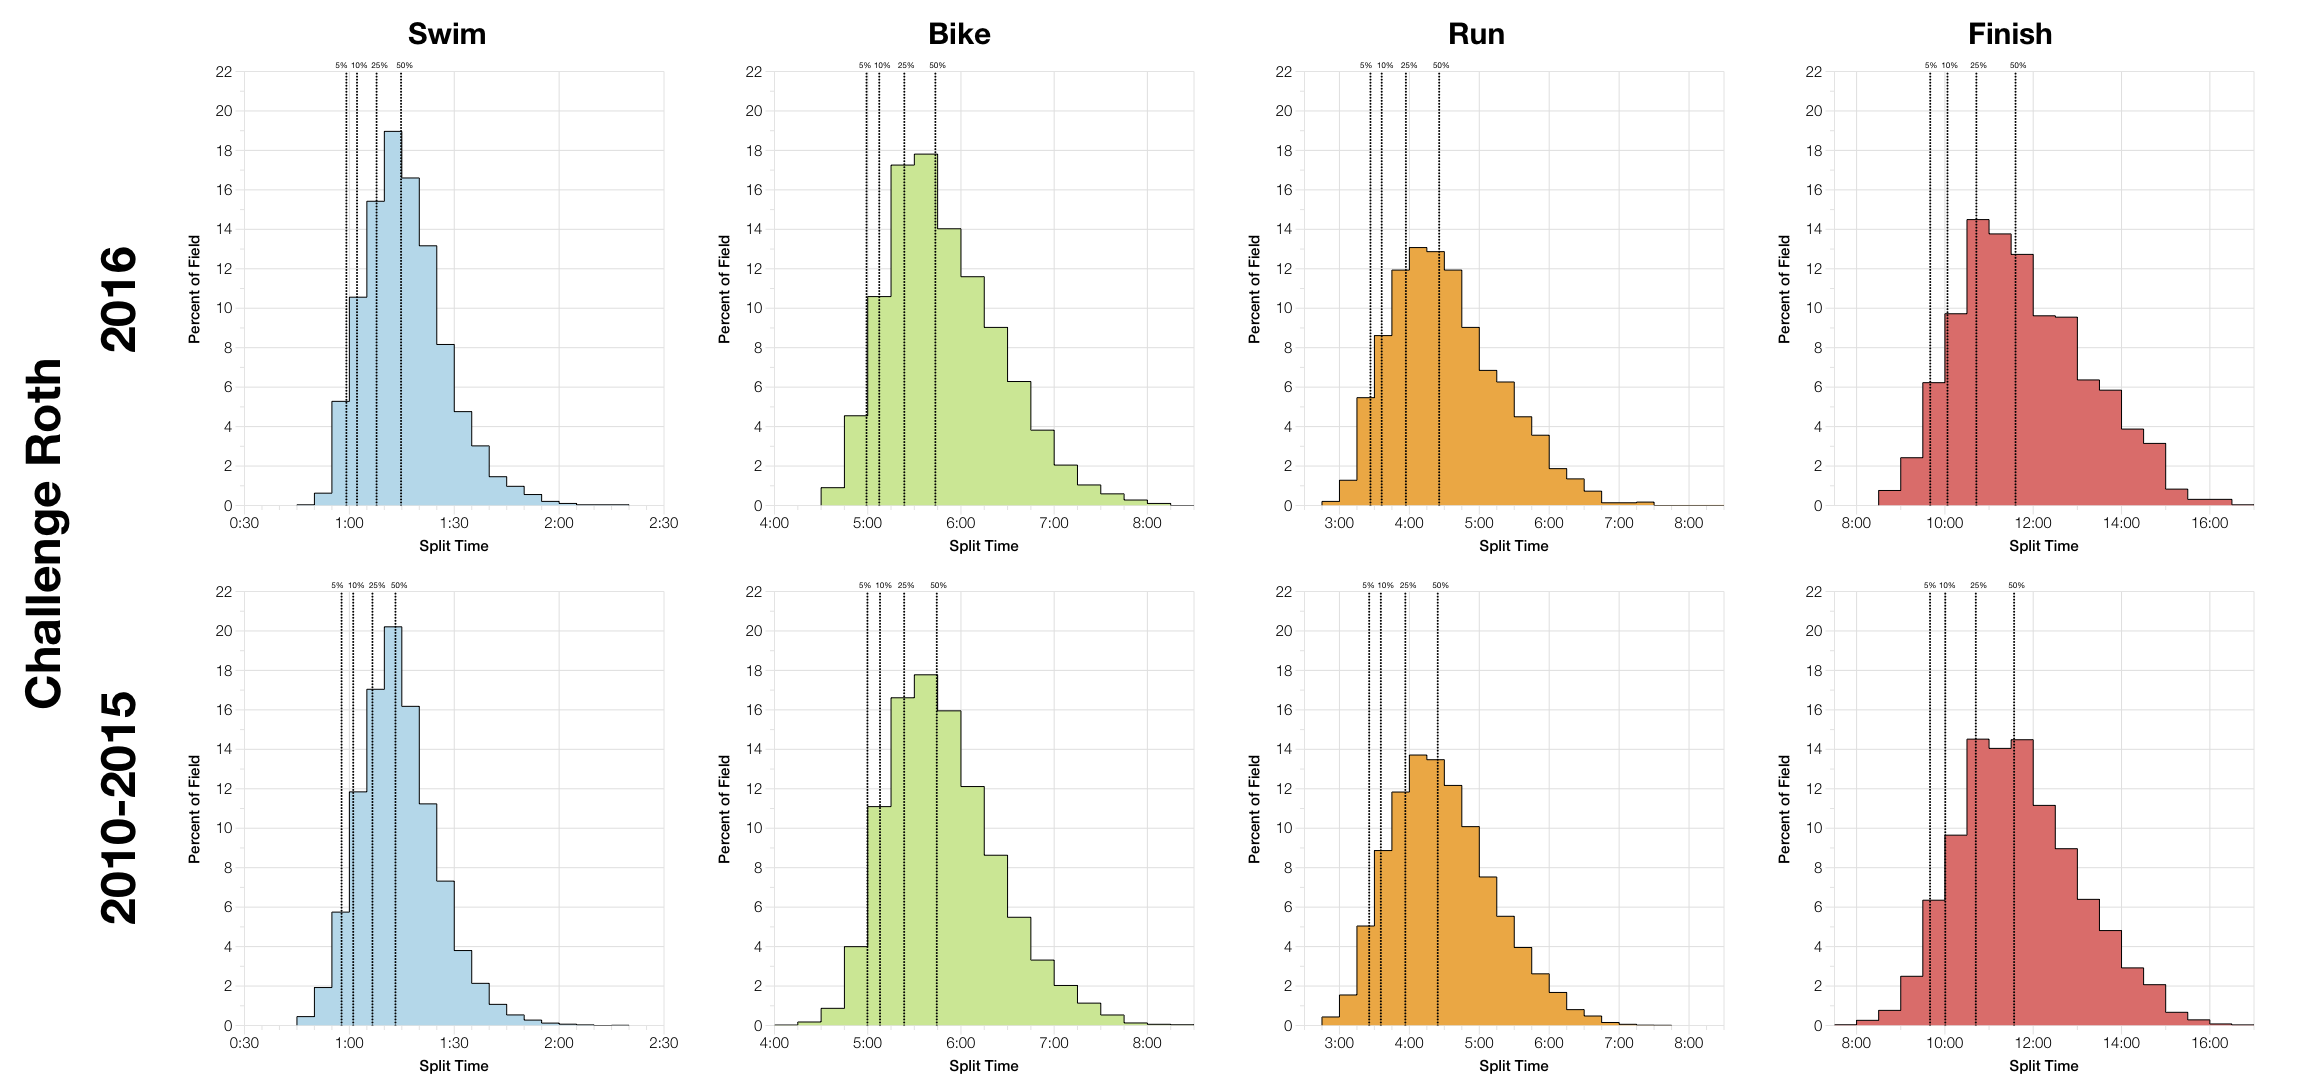
As I said, comparing this years split distributions with the aggregated results of the previous 6 years suggests we had a typical year of racing on the Roth course. If there’s any difference, this year’s swim was slower, but it’s a small change and not really noteworthy. The rest of the race balances out to yield a fairly typical finishing distribution with perhaps a small amount of extra weight through the middle pack.
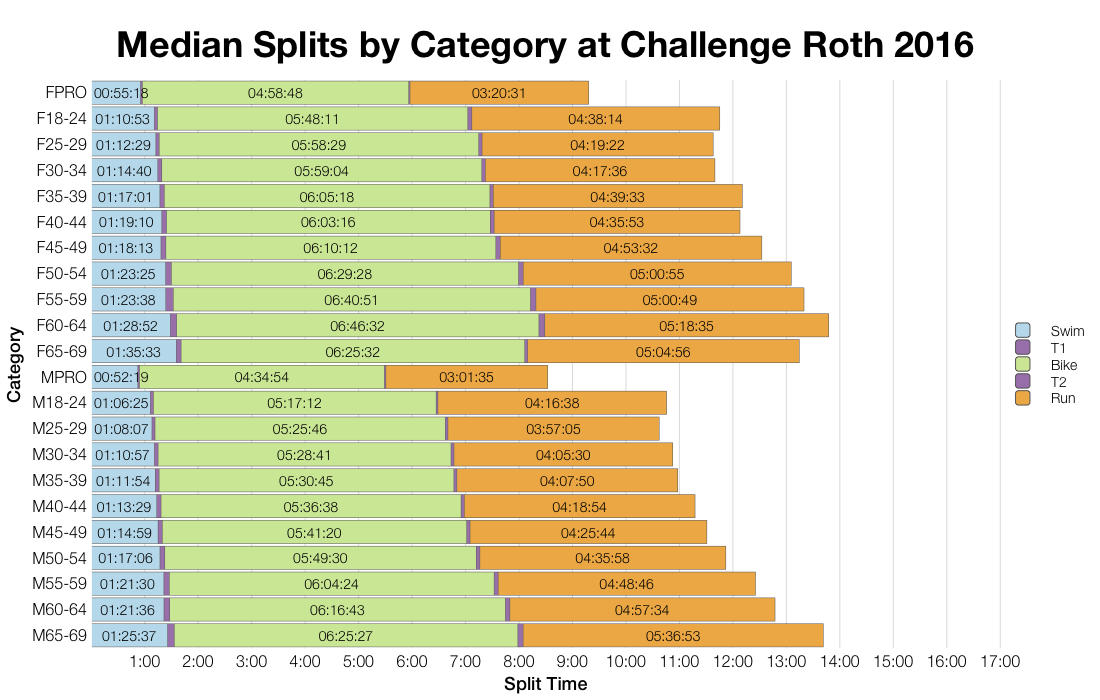
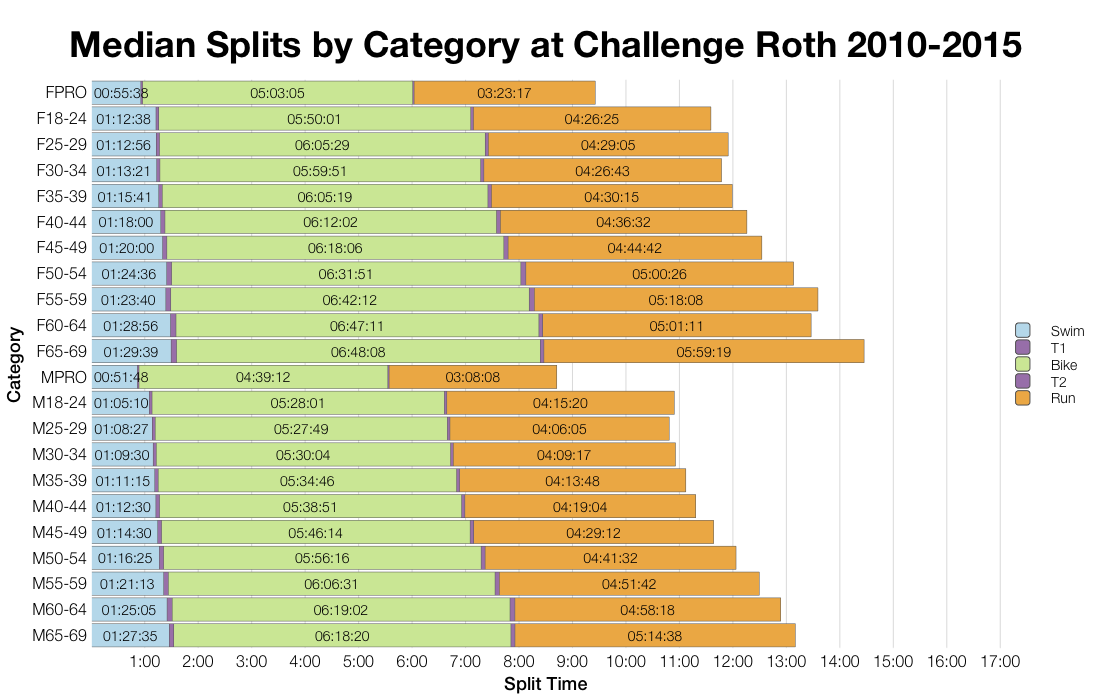
While a few age divisions show variations in time the majority have very similar median splits to previous years. There are no major trends here and as with the distribution we can see how small the differences in the swim actually are.
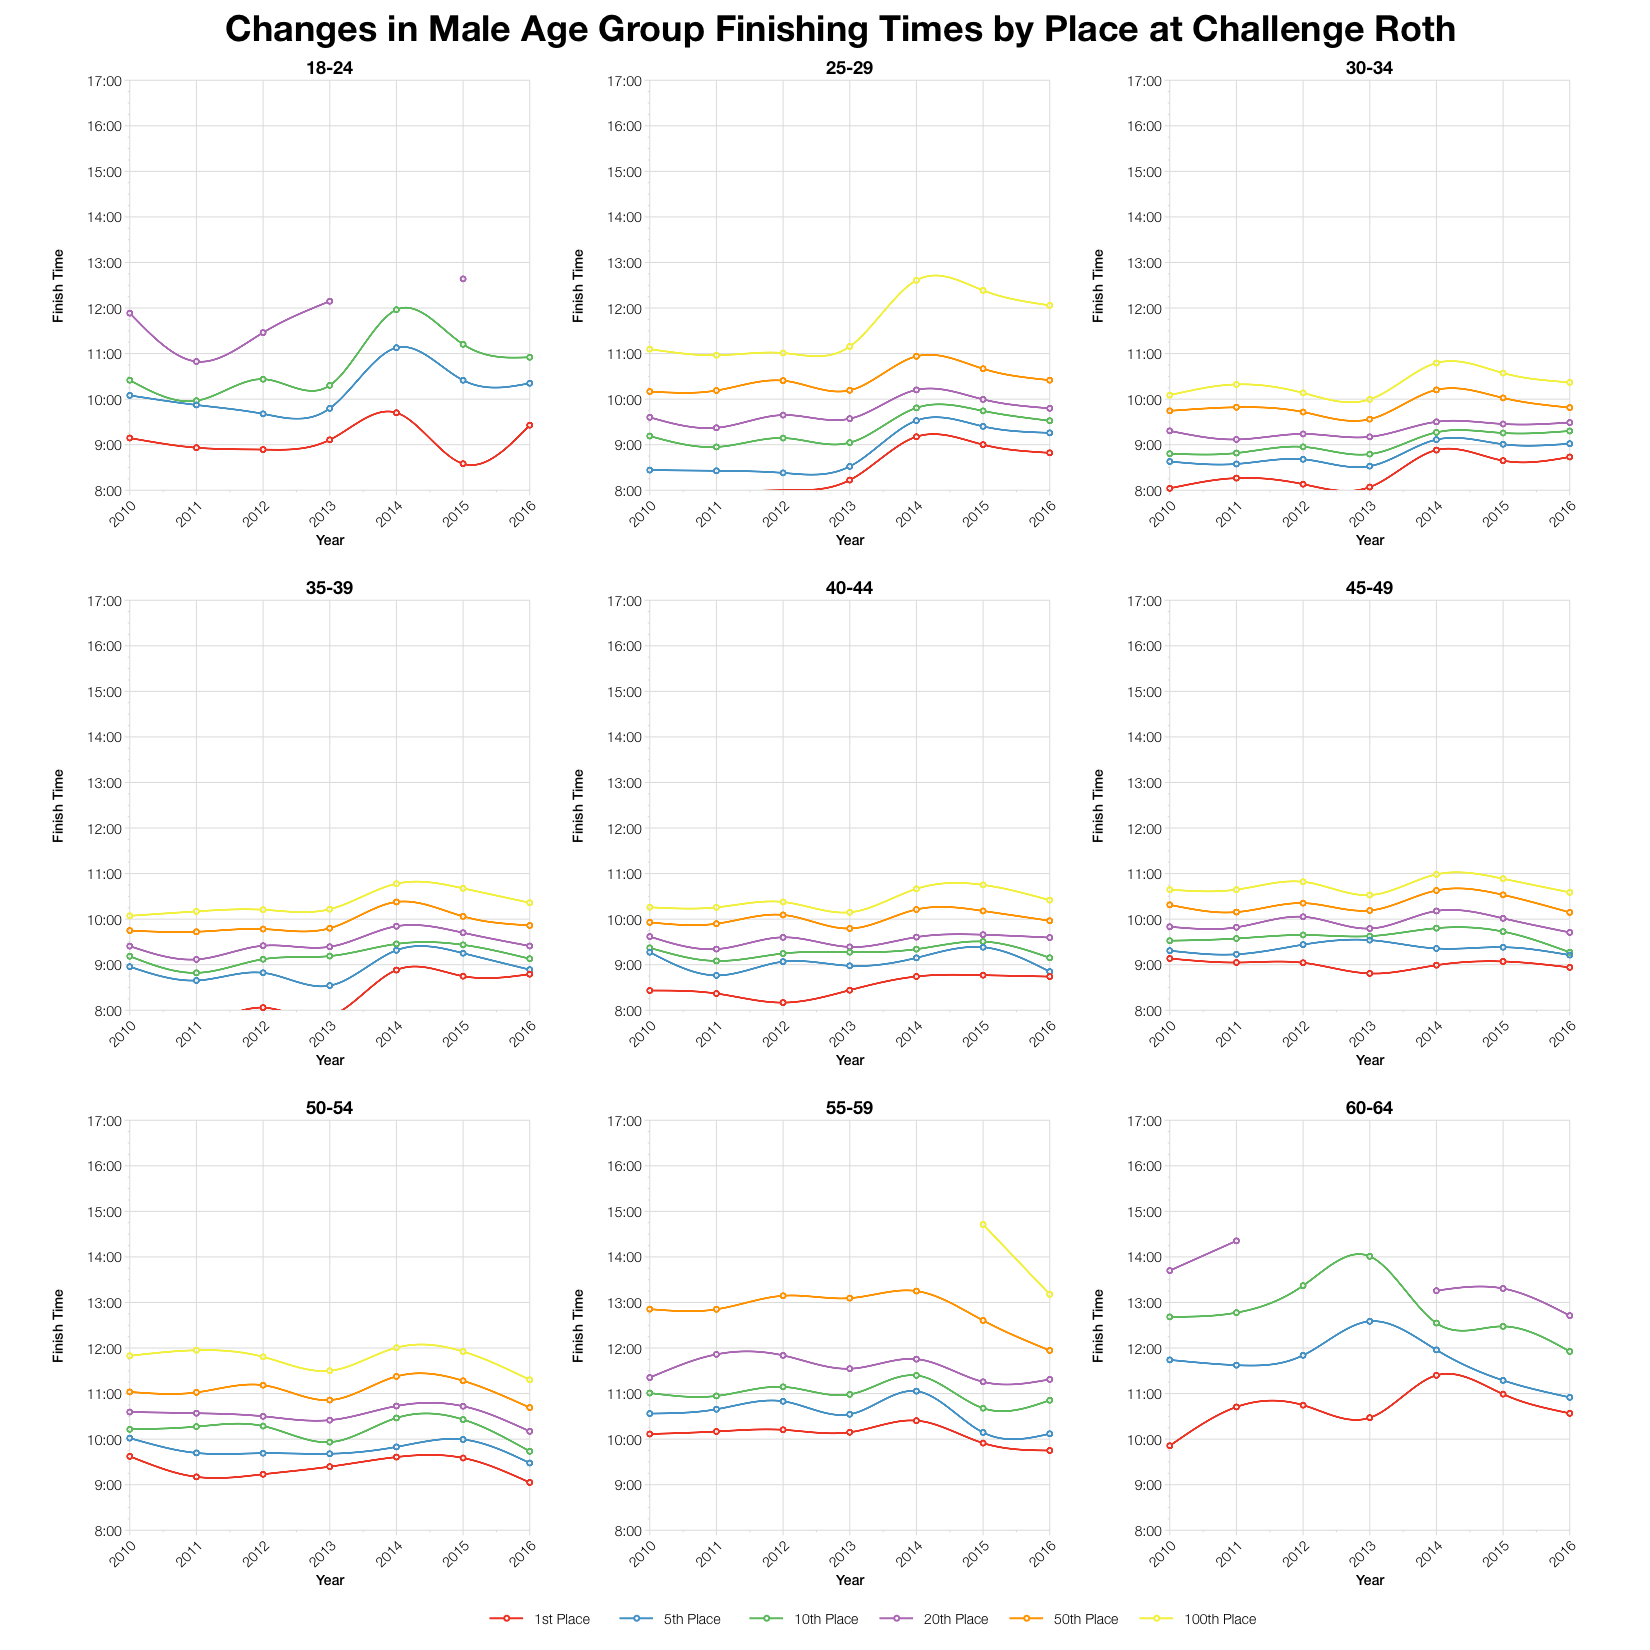
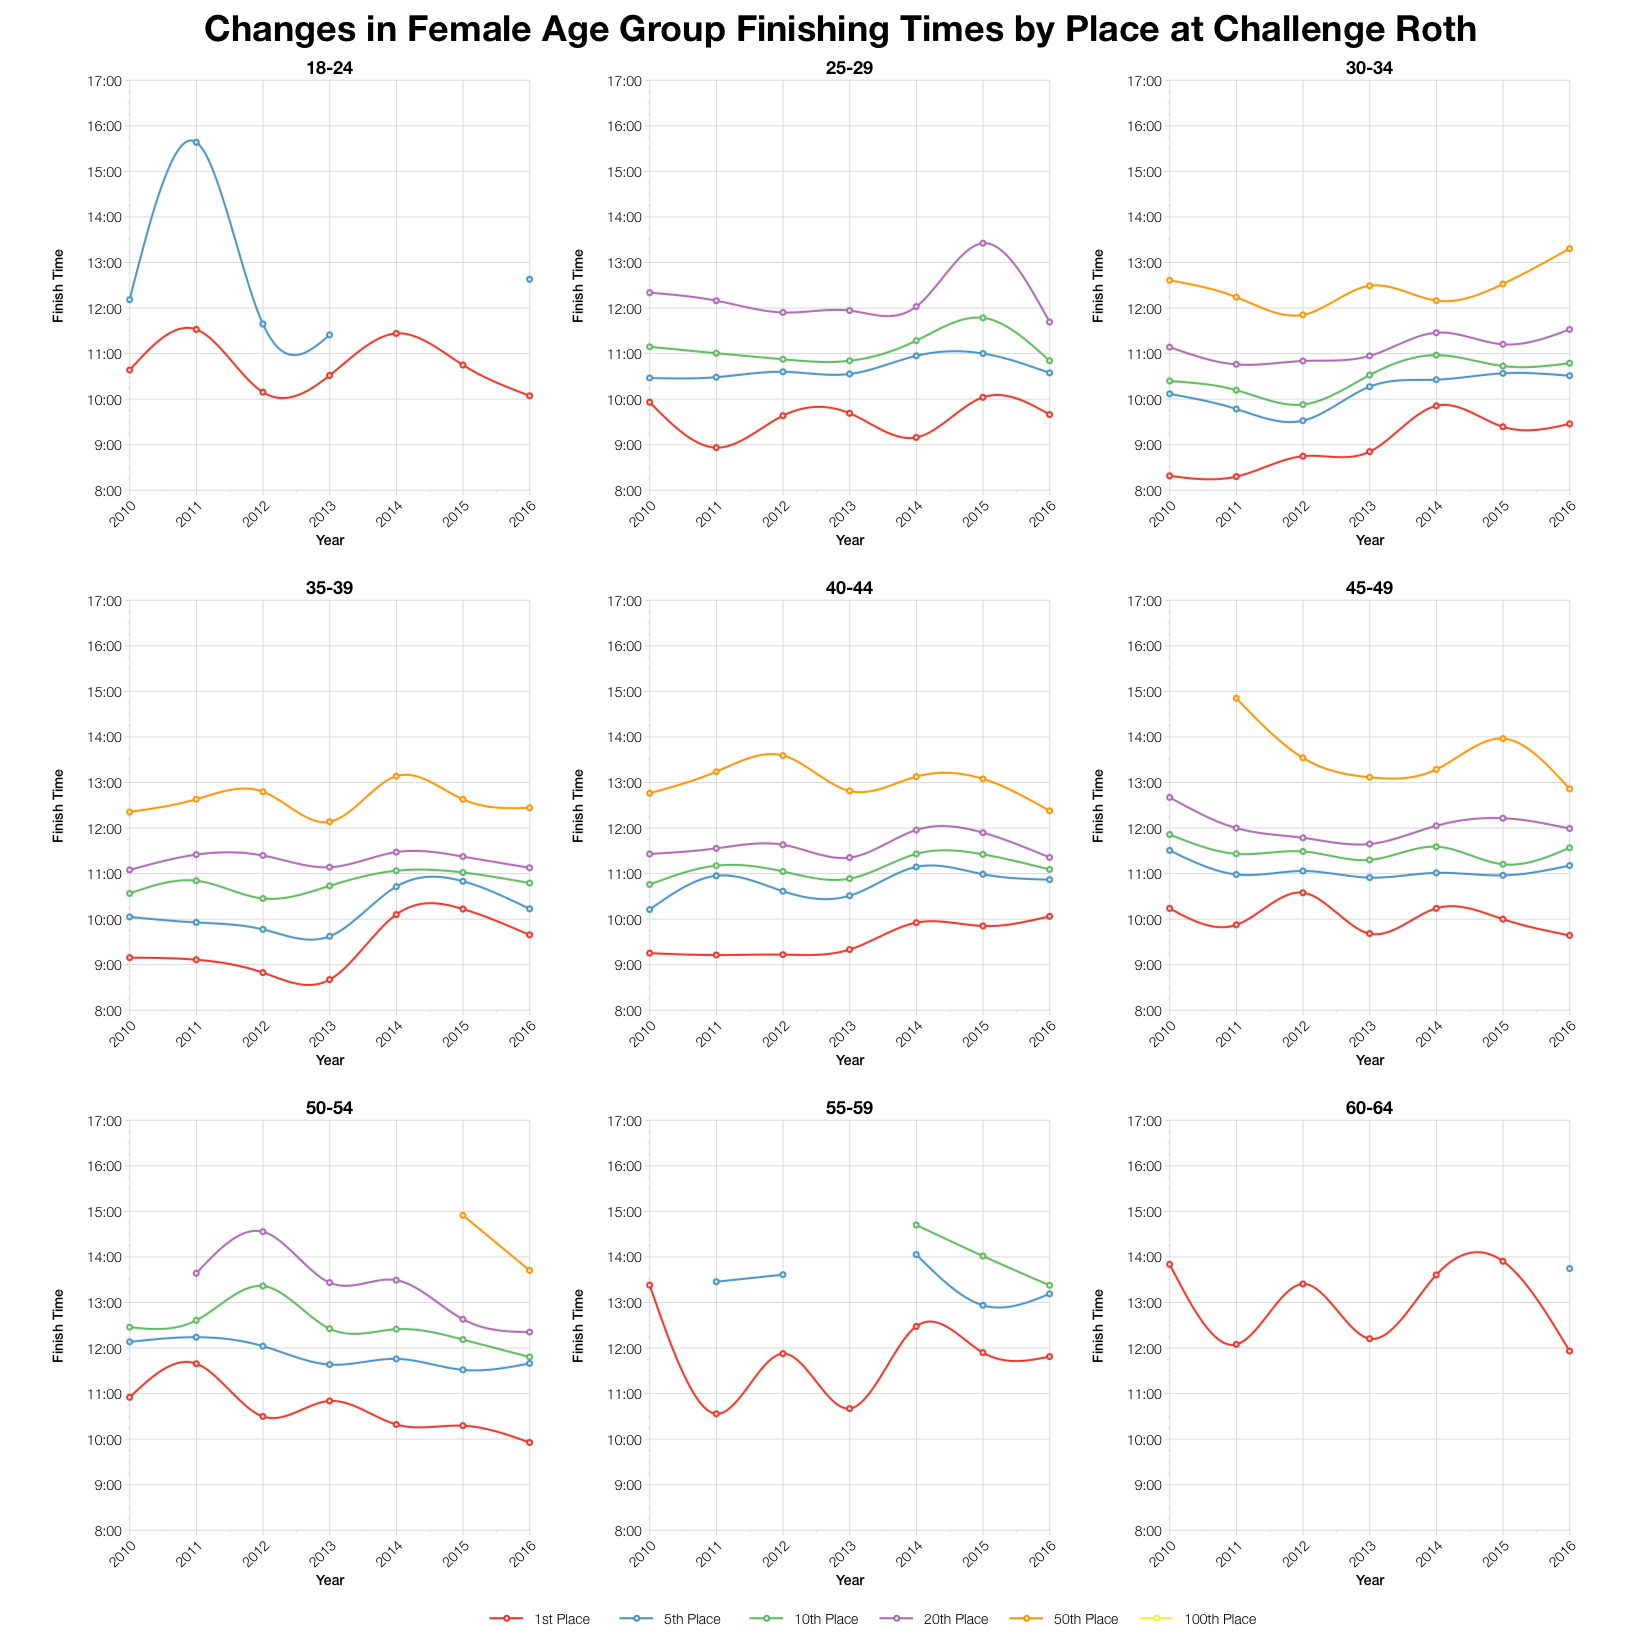
It’s worth noting that prior to 2013 results from Roth listed professional athletes assigned to appropriate age groups. Numbers are too few to impact medians, but in the graphs above, some first place times are off the charts. Ignoring this discrepancy this year’s times generally line up with previous results. In quite a few cases they trend slightly faster, perhaps indicating a better year at the front of the pack at least.
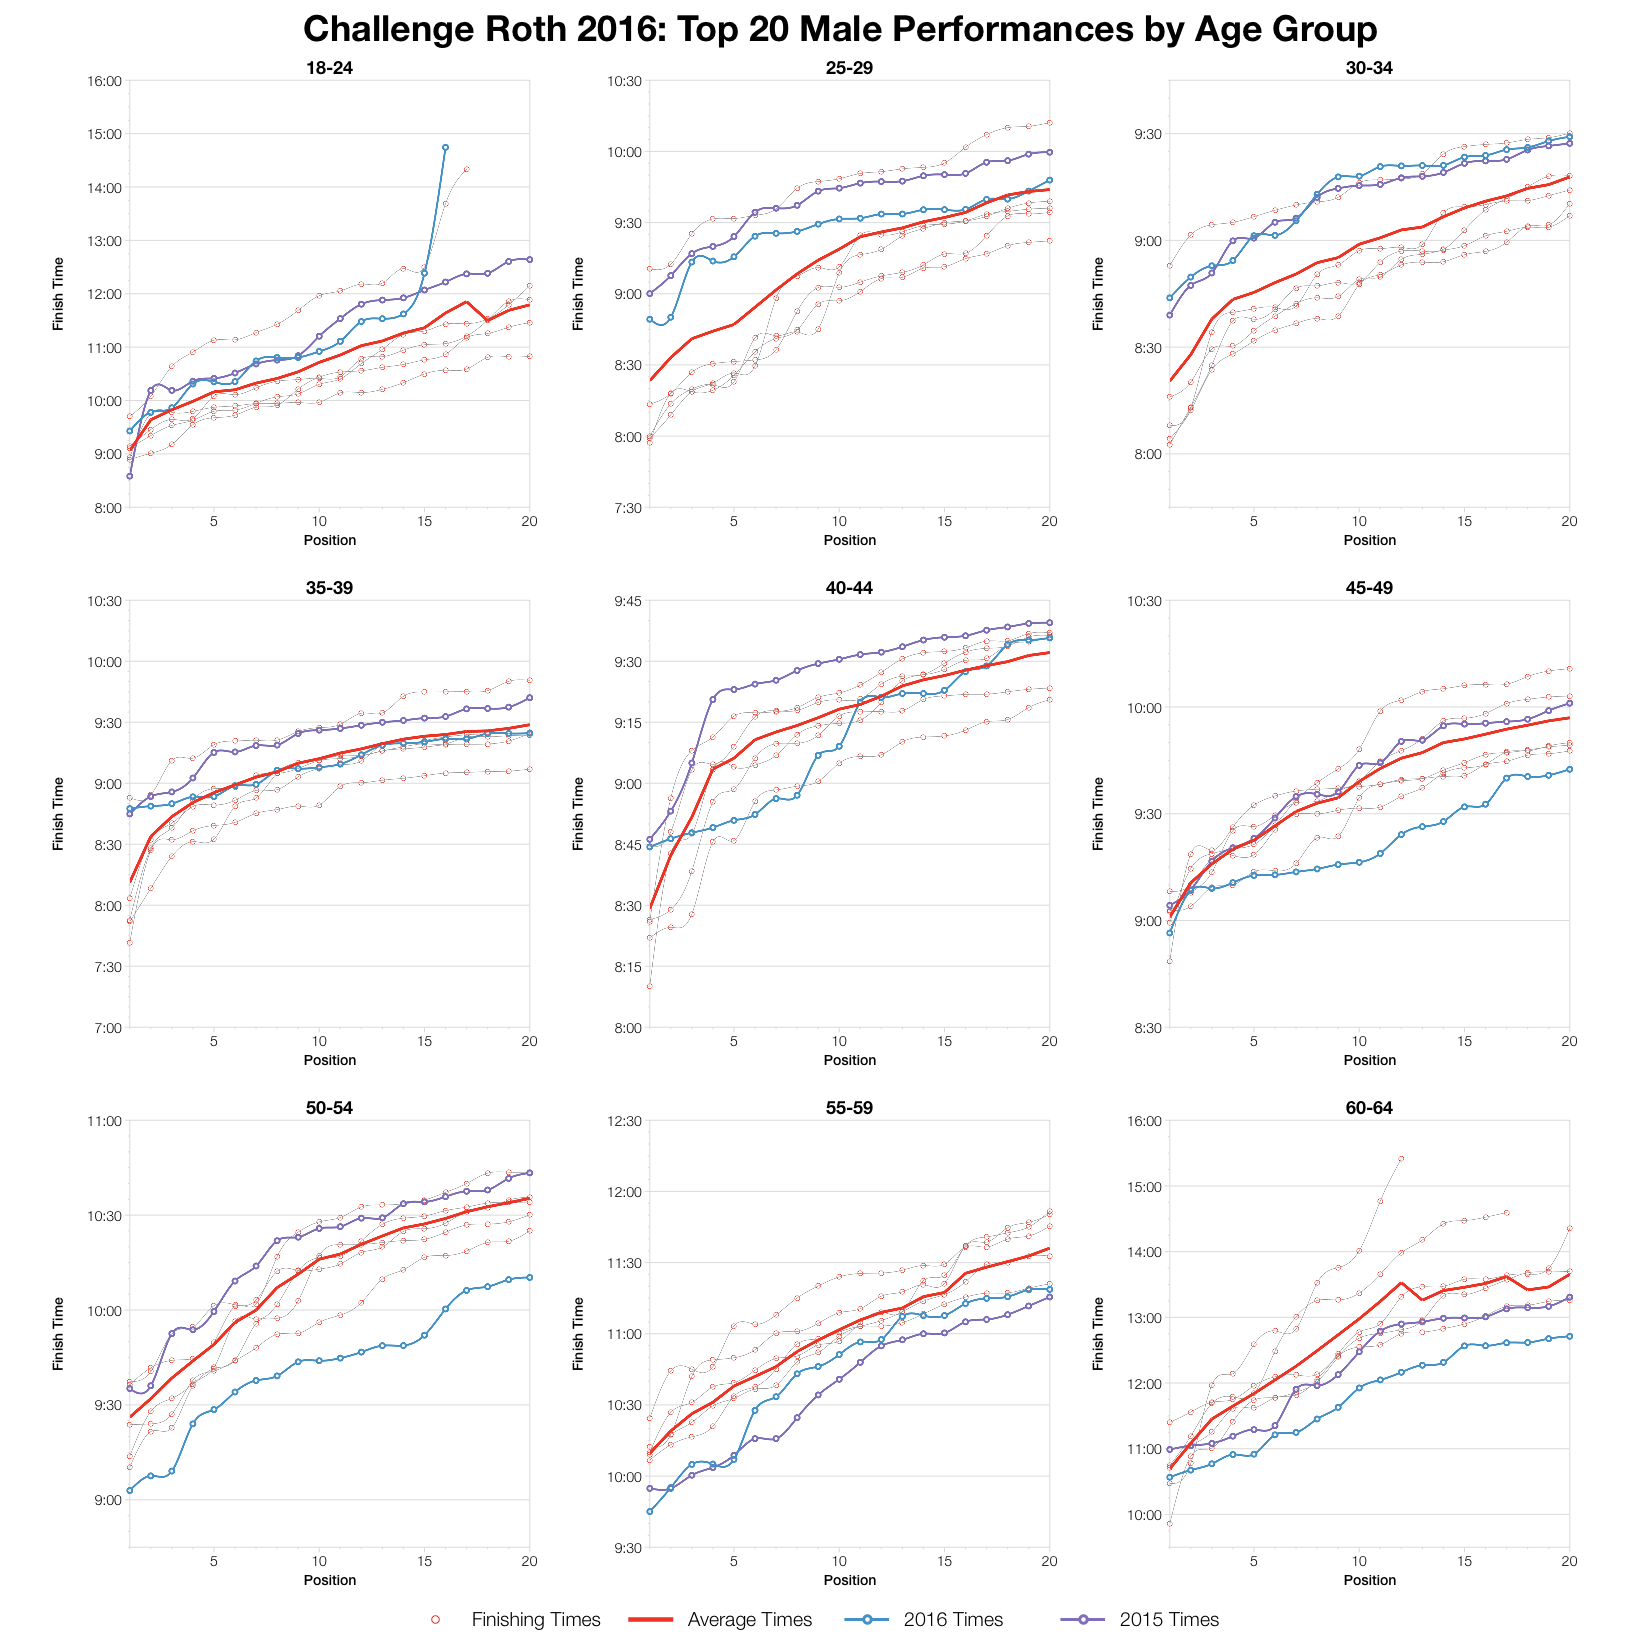
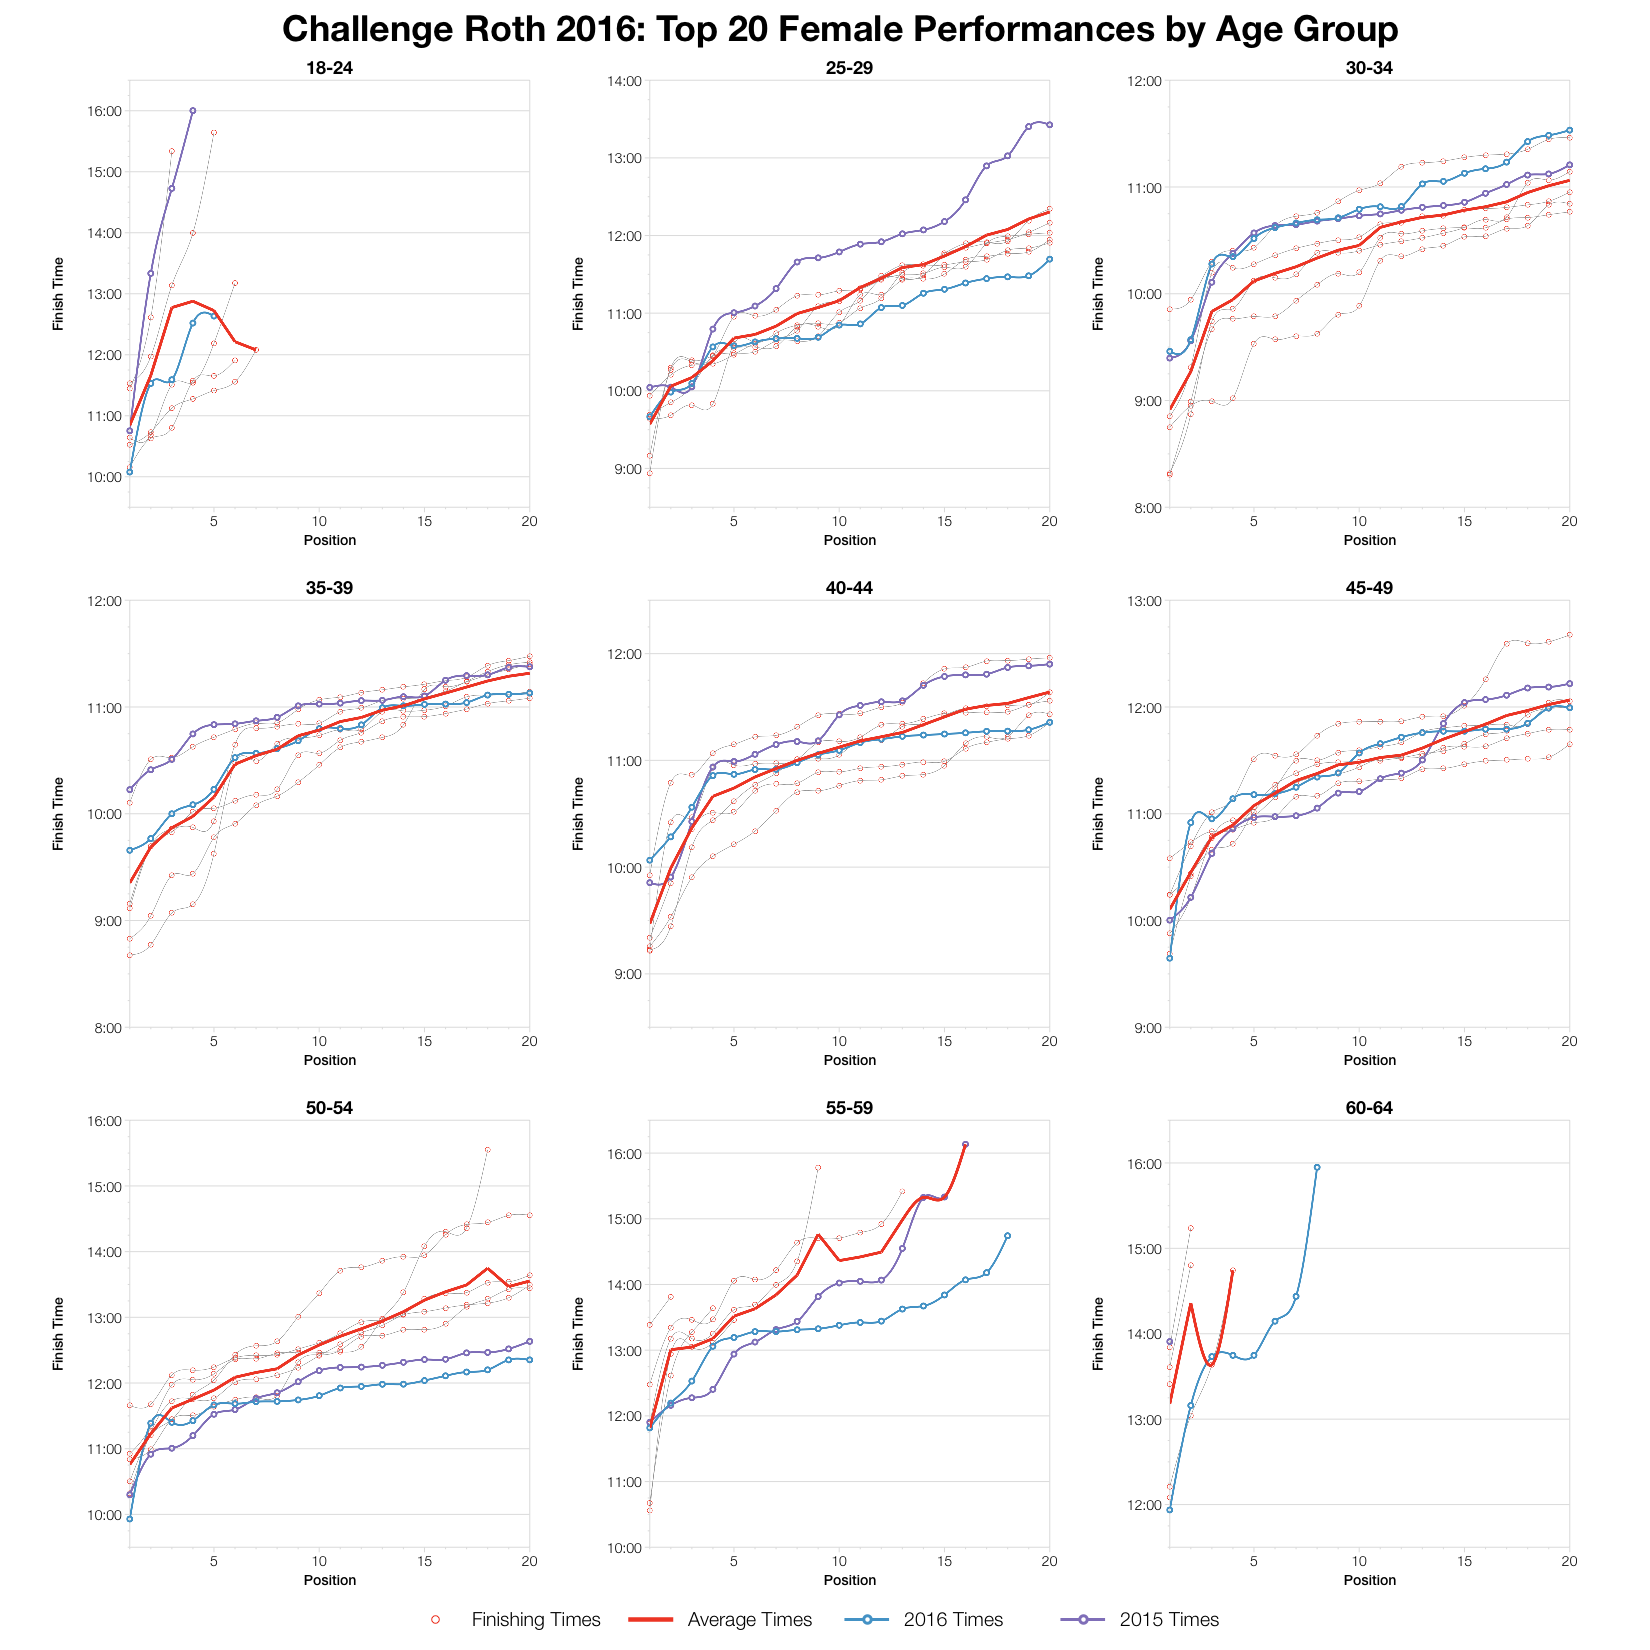
The older the athlete the more likely they out performed the top twenty averages for their age group. At least that seems to have been the case this year. The best age group performances relative to the averages appear to have some from men over 45 and women over 50. Other age groups trend closer to race averages or slightly behind. So while the top level view suggests a typical year in Roth at the front of the age groups this divides along age lines.


