Ironman Switzerland is the first of three Ironman races I’ll be analysing results from today. A long standing european race that had a surprisingly small field at this year’s event despite carrying 65 slots for the Ironman World Championship. Those numbers should make it a good qualifier, although like most European events times are fast and the race is competitive.
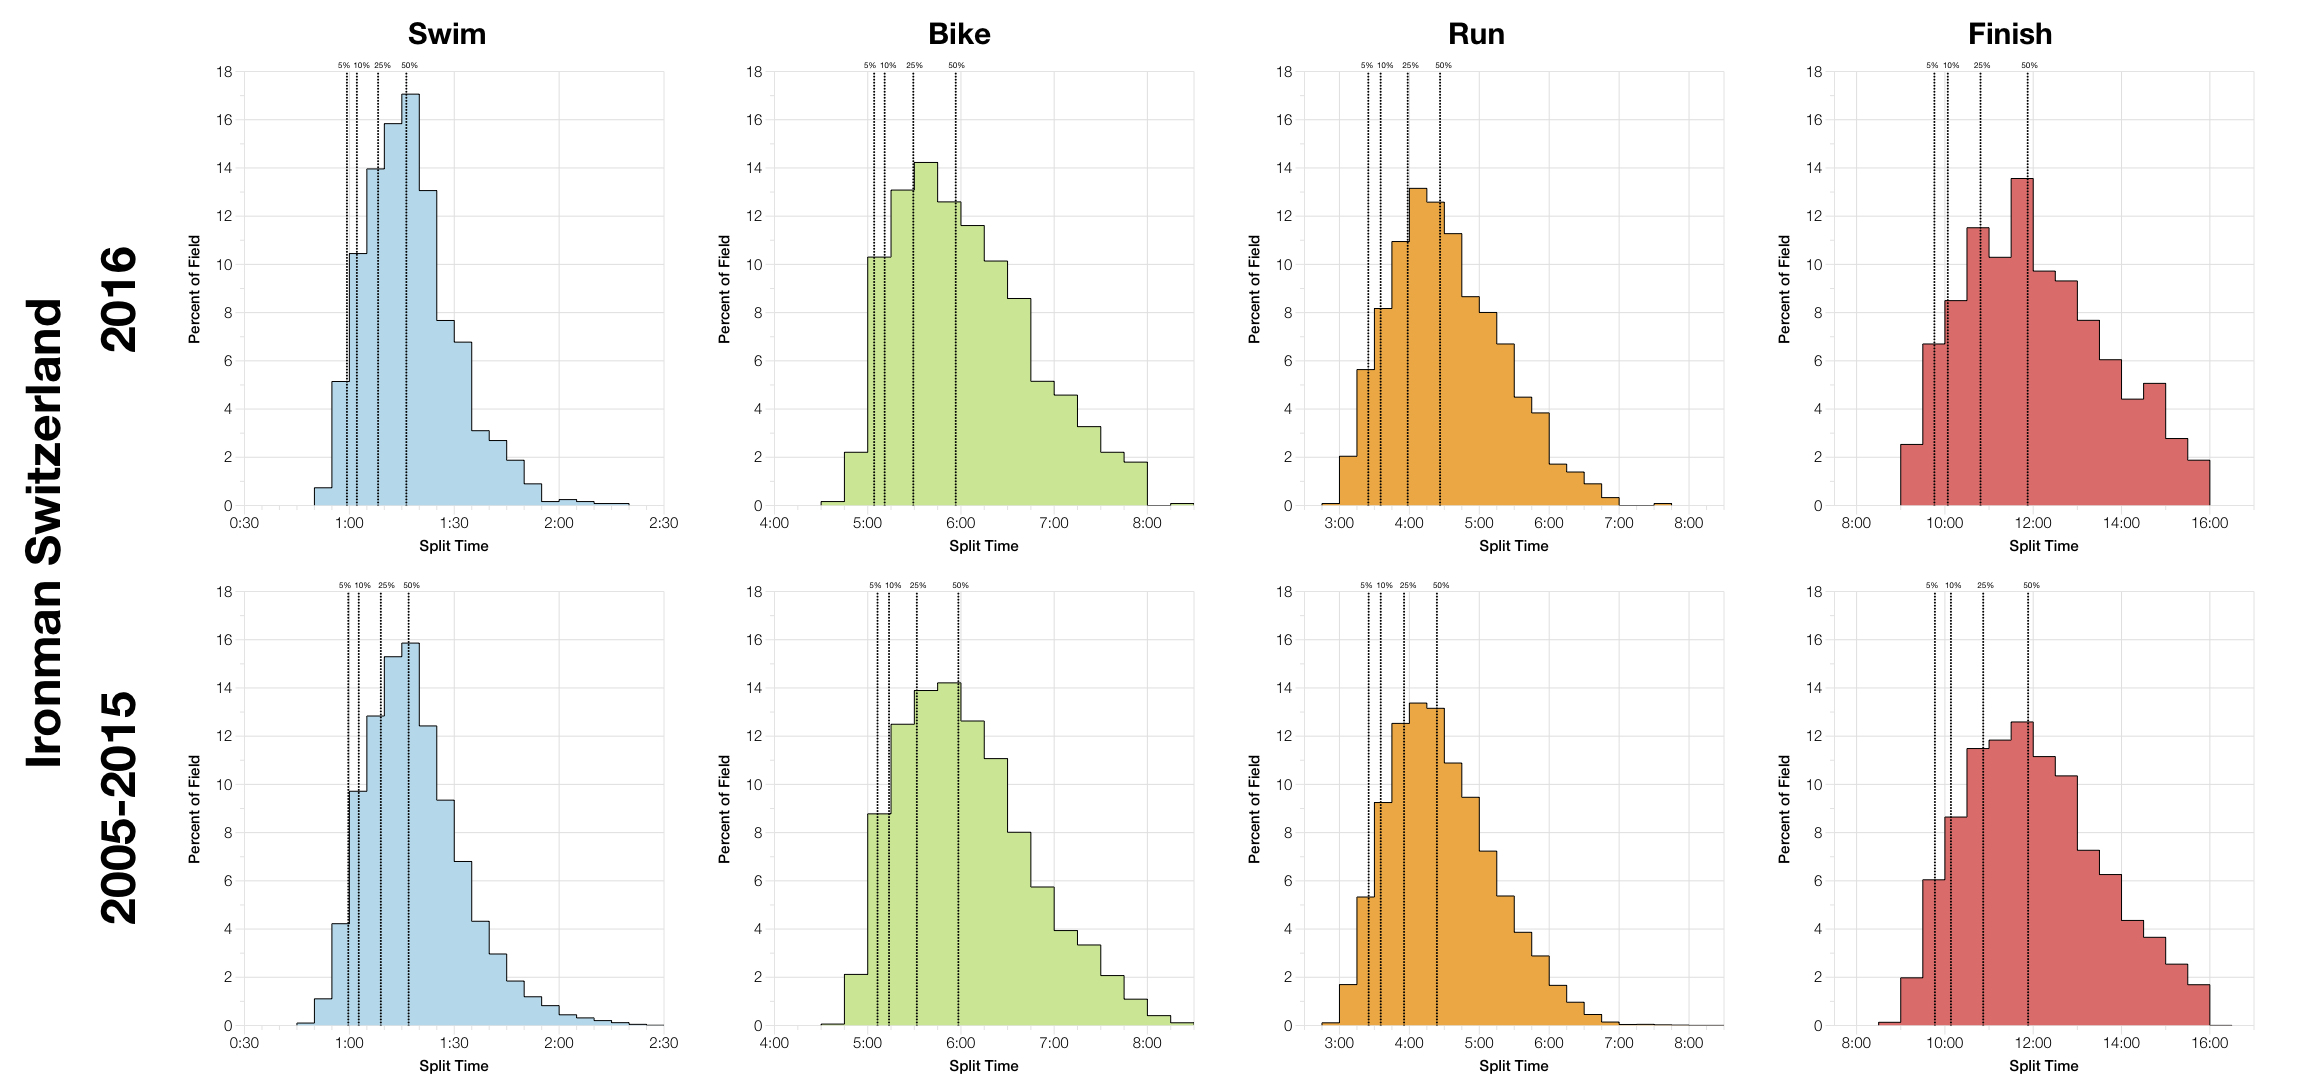
The distribution of splits at this year’s race fit tidily with those from the previous decade. There’s really little to comment on when comparing the two sets of charts. The run is a touch slower; I understand it was a warm day in Switzerland which tends to have most impact on the run. That may have a small knock on into overall splits, but it’s not significant.
| Listed Athletes | Swim Finish | Swim DNS/DNF | Bike Finish | Bike DNF | Run Finish | Run DNF | Overall DNS/DNF | |
|---|---|---|---|---|---|---|---|---|
| 2005 | 1637 | 1499 | 8.4% | 1189 | 20.7% | 1291 | % | 21.1% |
| 2006 | 1827 | 1681 | 8% | 1640 | 2.4% | 1500 | 8.5% | 17.9% |
| 2007 | 1969 | 1809 | 8.1% | 1774 | 1.9% | 1640 | 7.6% | 16.6% |
| 2008 | 2631 | 2057 | 21.8% | 2020 | 1.8% | 1955 | 3.2% | 25.7% |
| 2009 | 2508 | 2092 | 16.6% | 2071 | 1% | 1984 | 4.2% | 20.9% |
| 2010 | 2676 | 2226 | 16.8% | 2250 | % | 2156 | 4.2% | 19.4% |
| 2011 | 1998 | 1759 | 12% | 1704 | 3.1% | 1600 | 6.1% | 19.9% |
| 2012 | 1534 | 1520 | 0.9% | 1480 | 2.6% | 1394 | 5.8% | 9.1% |
| 2013 | 2493 | 2171 | 12.9% | 2060 | 5.1% | 1878 | 8.8% | 24.7% |
| 2014 | 2655 | 2322 | 12.5% | 2247 | 3.2% | 2174 | 3.2% | 18.1% |
| 2015 | 2077 | 1818 | 12.5% | 1703 | 6.3% | 1590 | 6.6% | 23.4% |
| 2016 | 1583 | 1414 | 10.7% | 1367 | 3.3% | 1254 | 8.3% | 20.8% |
The most notable piece of information in this table is how much lower athlete numbers appear to have been at this year’s race. I’m not sure why fewer athletes chose to start at this event. Overall DNF/DNS rates look to fall just above average. There’s clearly one of the higher run DNF rates for the course, which would tally with hotter conditions, but they’re balanced out by average swim and bike DNF rates.
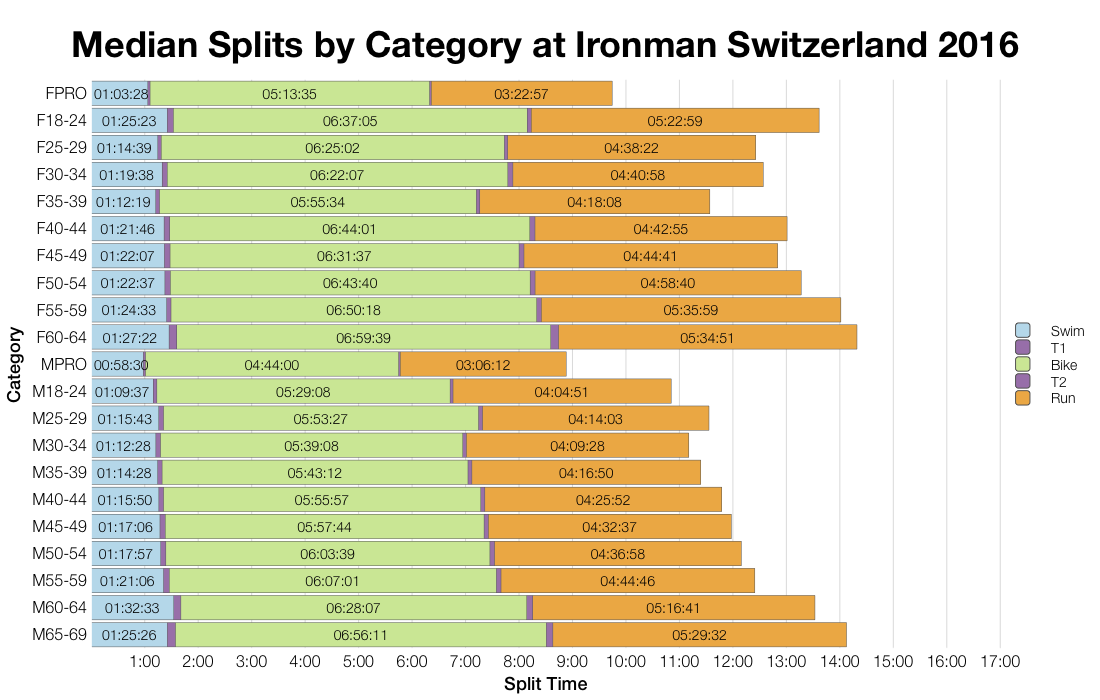
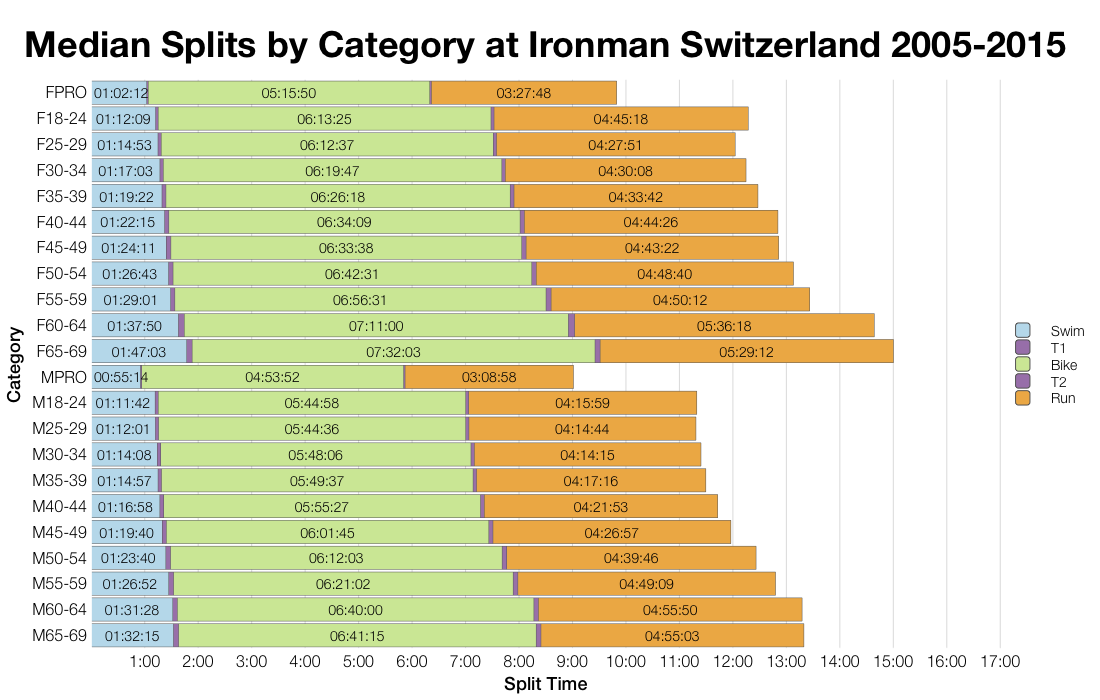
As we saw in the distributions there are small differences in median splits between the present year and past races. A few age groups show bigger variations, particularly female age groups where lower numbers tend to increase variability in results. Generally, median splits conform well to previous race norms.
| Count | Percentage | |
|---|---|---|
| Switzerland | 424 | 26.8 |
| Germany | 198 | 12.5 |
| United Kingdom | 184 | 11.6 |
| France | 128 | 8.1 |
| Italy | 126 | 8 |
| United States | 74 | 4.7 |
| Spain | 57 | 3.6 |
| Belgium | 42 | 2.7 |
| Austria | 33 | 2.1 |
| Sweden | 25 | 1.6 |
As with most European races, there’s a brand spread of nationalities competing in Switzerland.
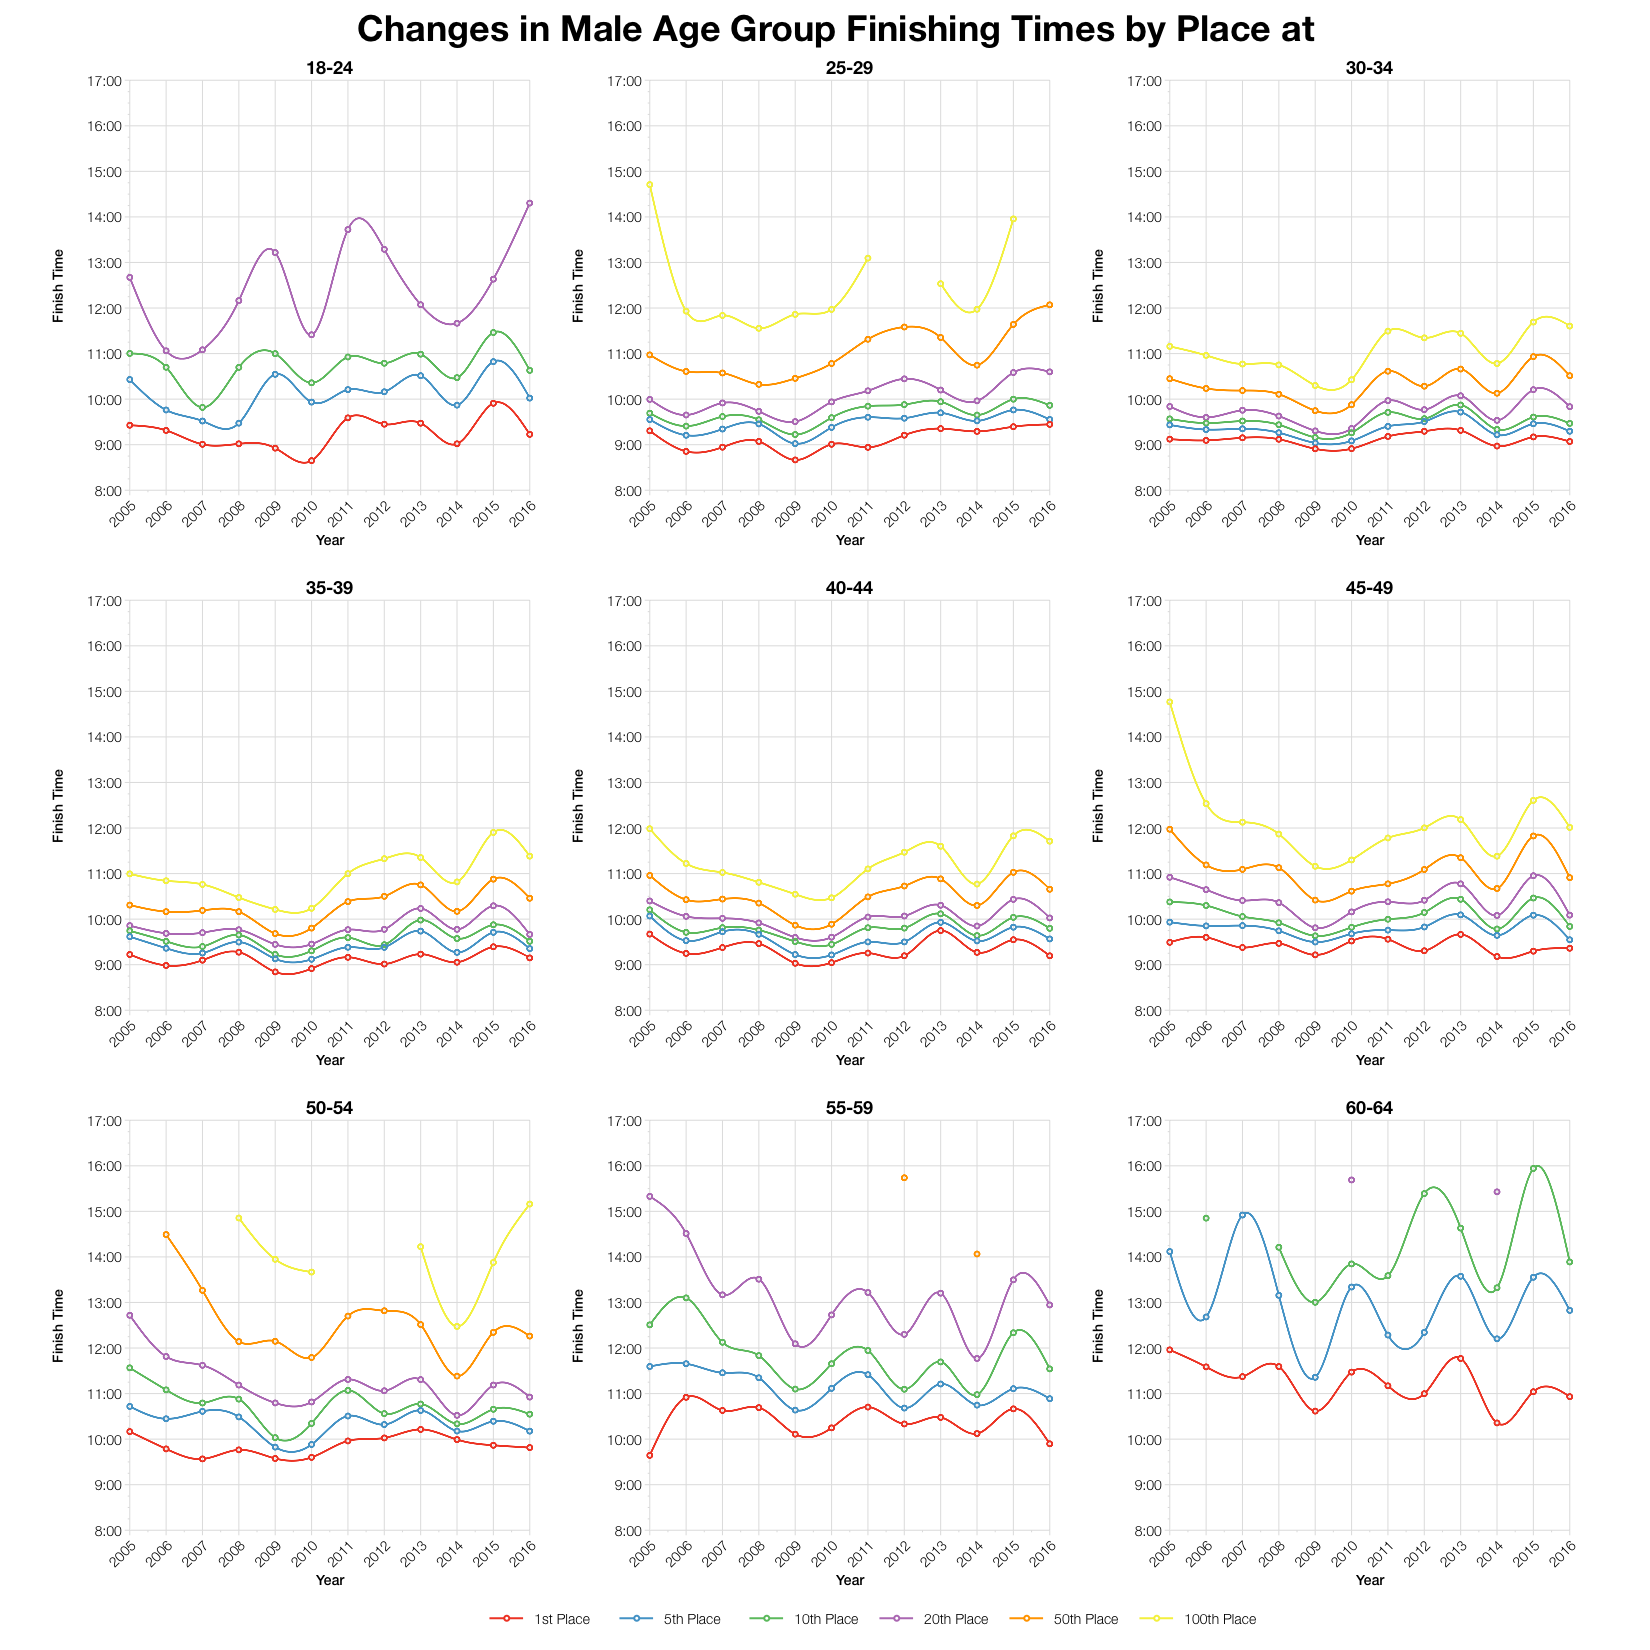
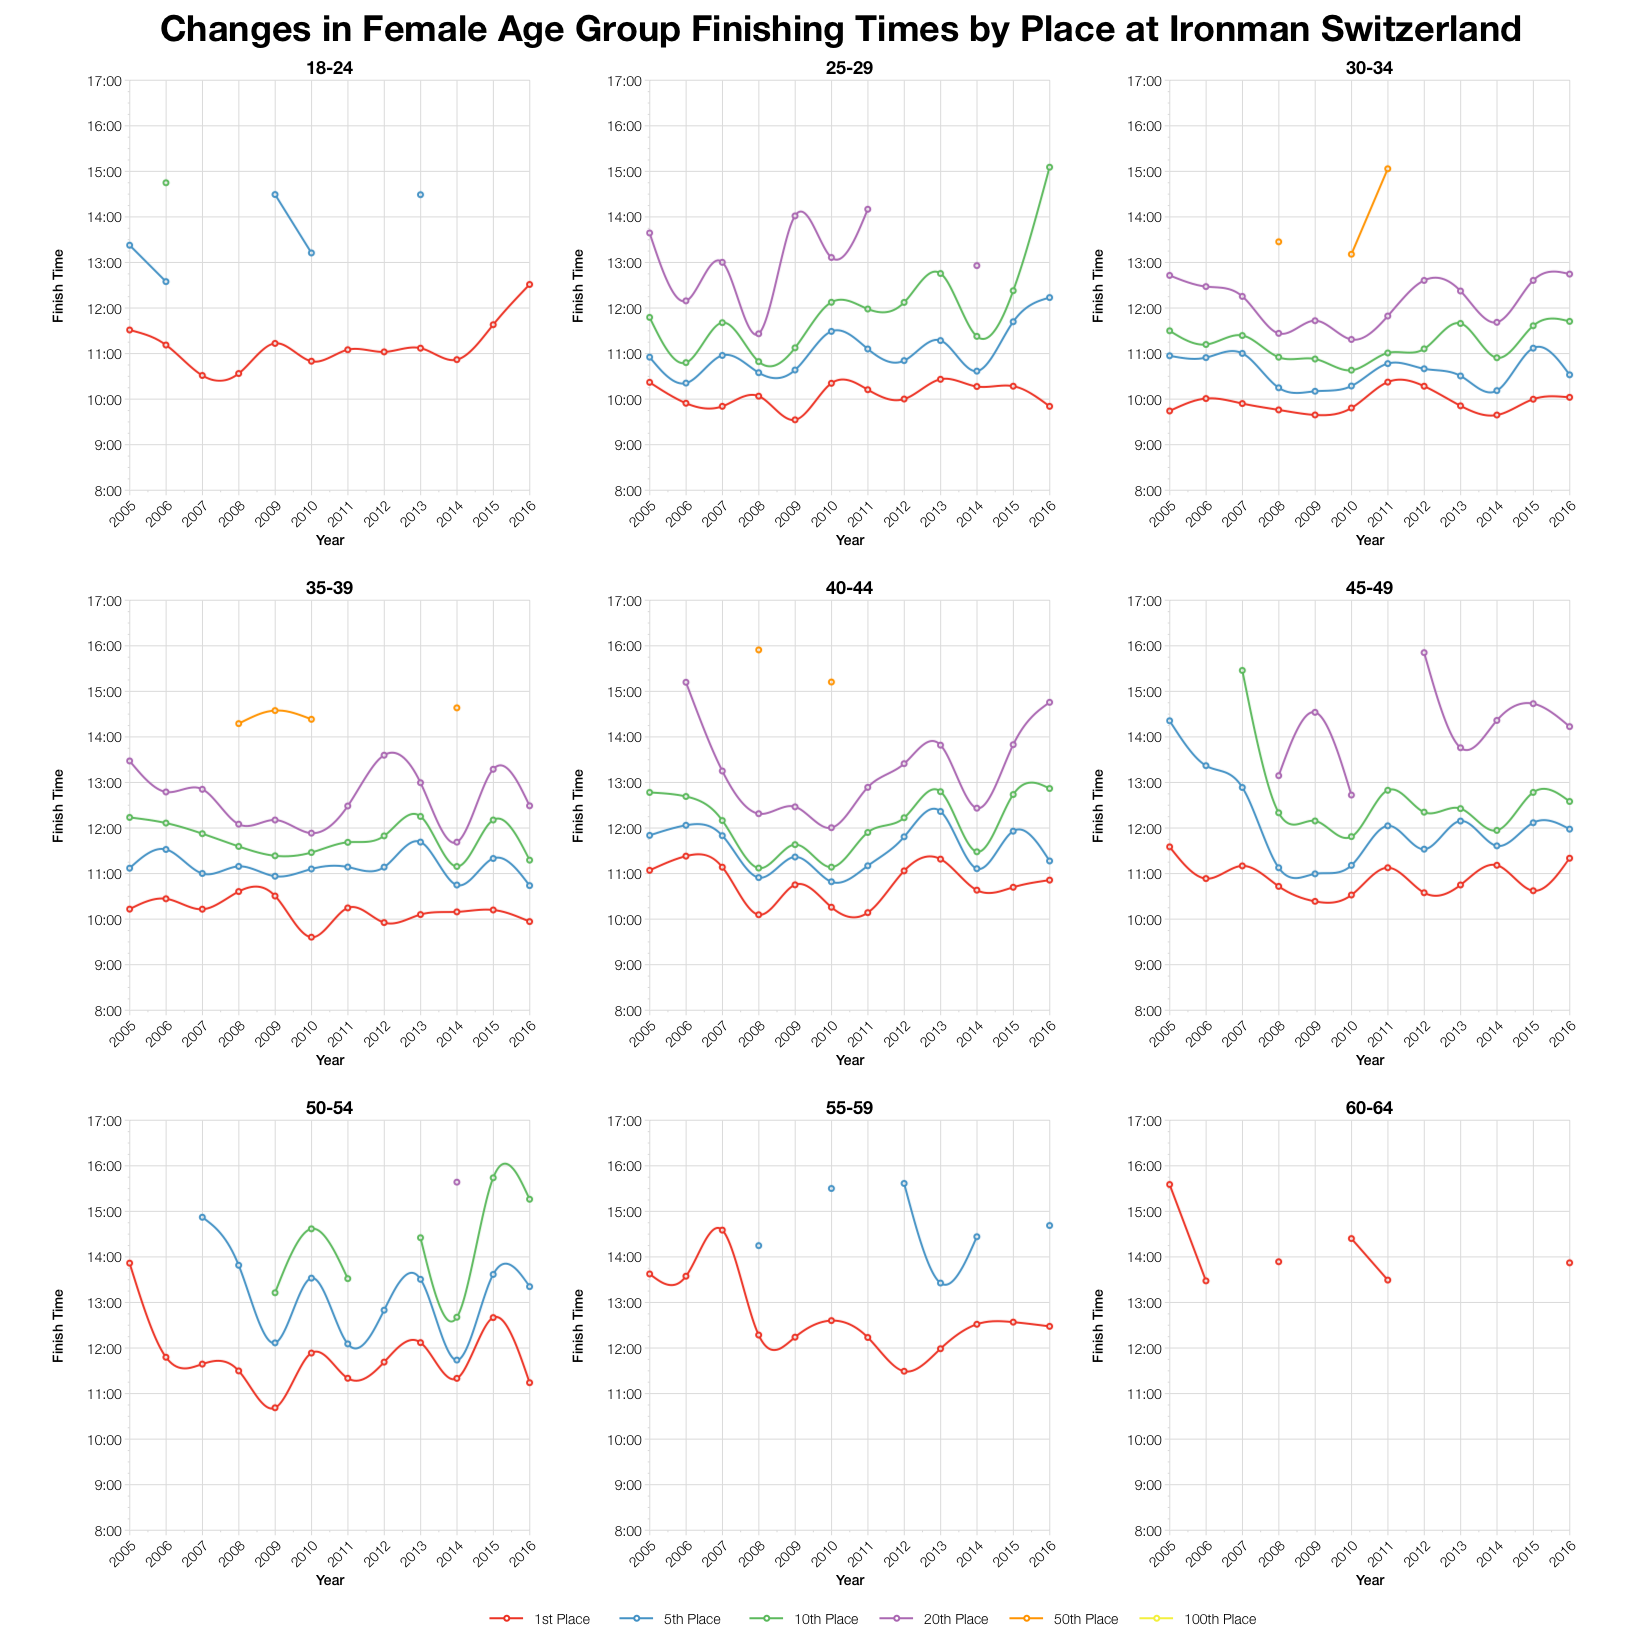
Tracking finishing times over the last 10 years of racing again places this year’s race somewhere in the middle. There have been a number of faster years and a few slower ones too, last year’s race standing out in the latter group Focusing on the major male age group, the variation in times has been relatively small over the decade.
| Slots | Winner | Average Kona Qualifier | Final Qualifier | |
|---|---|---|---|---|
| M18-24 | 2 | 9:13:37 | 9:29:37 | 9:45:38 |
| M25-29 | 4 | 9:26:46 | 9:28:55 | 9:31:07 |
| M30-34 | 7 | 9:04:11 | 9:13:55 | 9:22:14 |
| M35-39 | 9 | 9:08:56 | 9:18:30 | 9:26:06 |
| M40-44 | 8 | 9:11:42 | 9:28:58 | 9:39:47 |
| M45-49 | 9 | 9:21:40 | 9:34:31 | 9:49:21 |
| M50-54 | 6 | 9:48:53 | 10:00:50 | 10:12:18 |
| M55-59 | 3 | 9:53:50 | 10:19:45 | 10:42:27 |
| M60-64 | 2 | 10:55:56 | 11:17:08 | 11:38:21 |
| M65-69 | 1 | 12:44:48 | 12:44:48 | 12:44:48 |
| M70-74 | 1 | 13:20:42 | 13:20:42 | 13:20:42 |
| F18-24 | 1 | 12:31:15 | 12:31:15 | 12:31:15 |
| F25-29 | 1 | 9:50:43 | 9:50:43 | 9:50:43 |
| F30-34 | 2 | 10:02:35 | 10:04:40 | 10:06:45 |
| F35-39 | 2 | 9:56:59 | 10:09:54 | 10:22:50 |
| F40-44 | 2 | 10:51:37 | 10:53:14 | 10:54:51 |
| F45-49 | 2 | 11:20:26 | 11:27:50 | 11:35:14 |
| F50-54 | 1 | 11:14:34 | 11:14:34 | 11:14:34 |
| F55-59 | 1 | 12:28:45 | 12:28:45 | 12:28:45 |
| F60-64 | 1 | 13:52:27 | 13:52:27 | 13:52:27 |
The table above predicts Kona slots based on the number of competitors listed and then calculates the automatic qualifying time from the results. Actual slot numbers will depend on precise start numbers and final qualifying times may be affected by roll down. You can compare these numbers with other races on my Kona Qualification page.
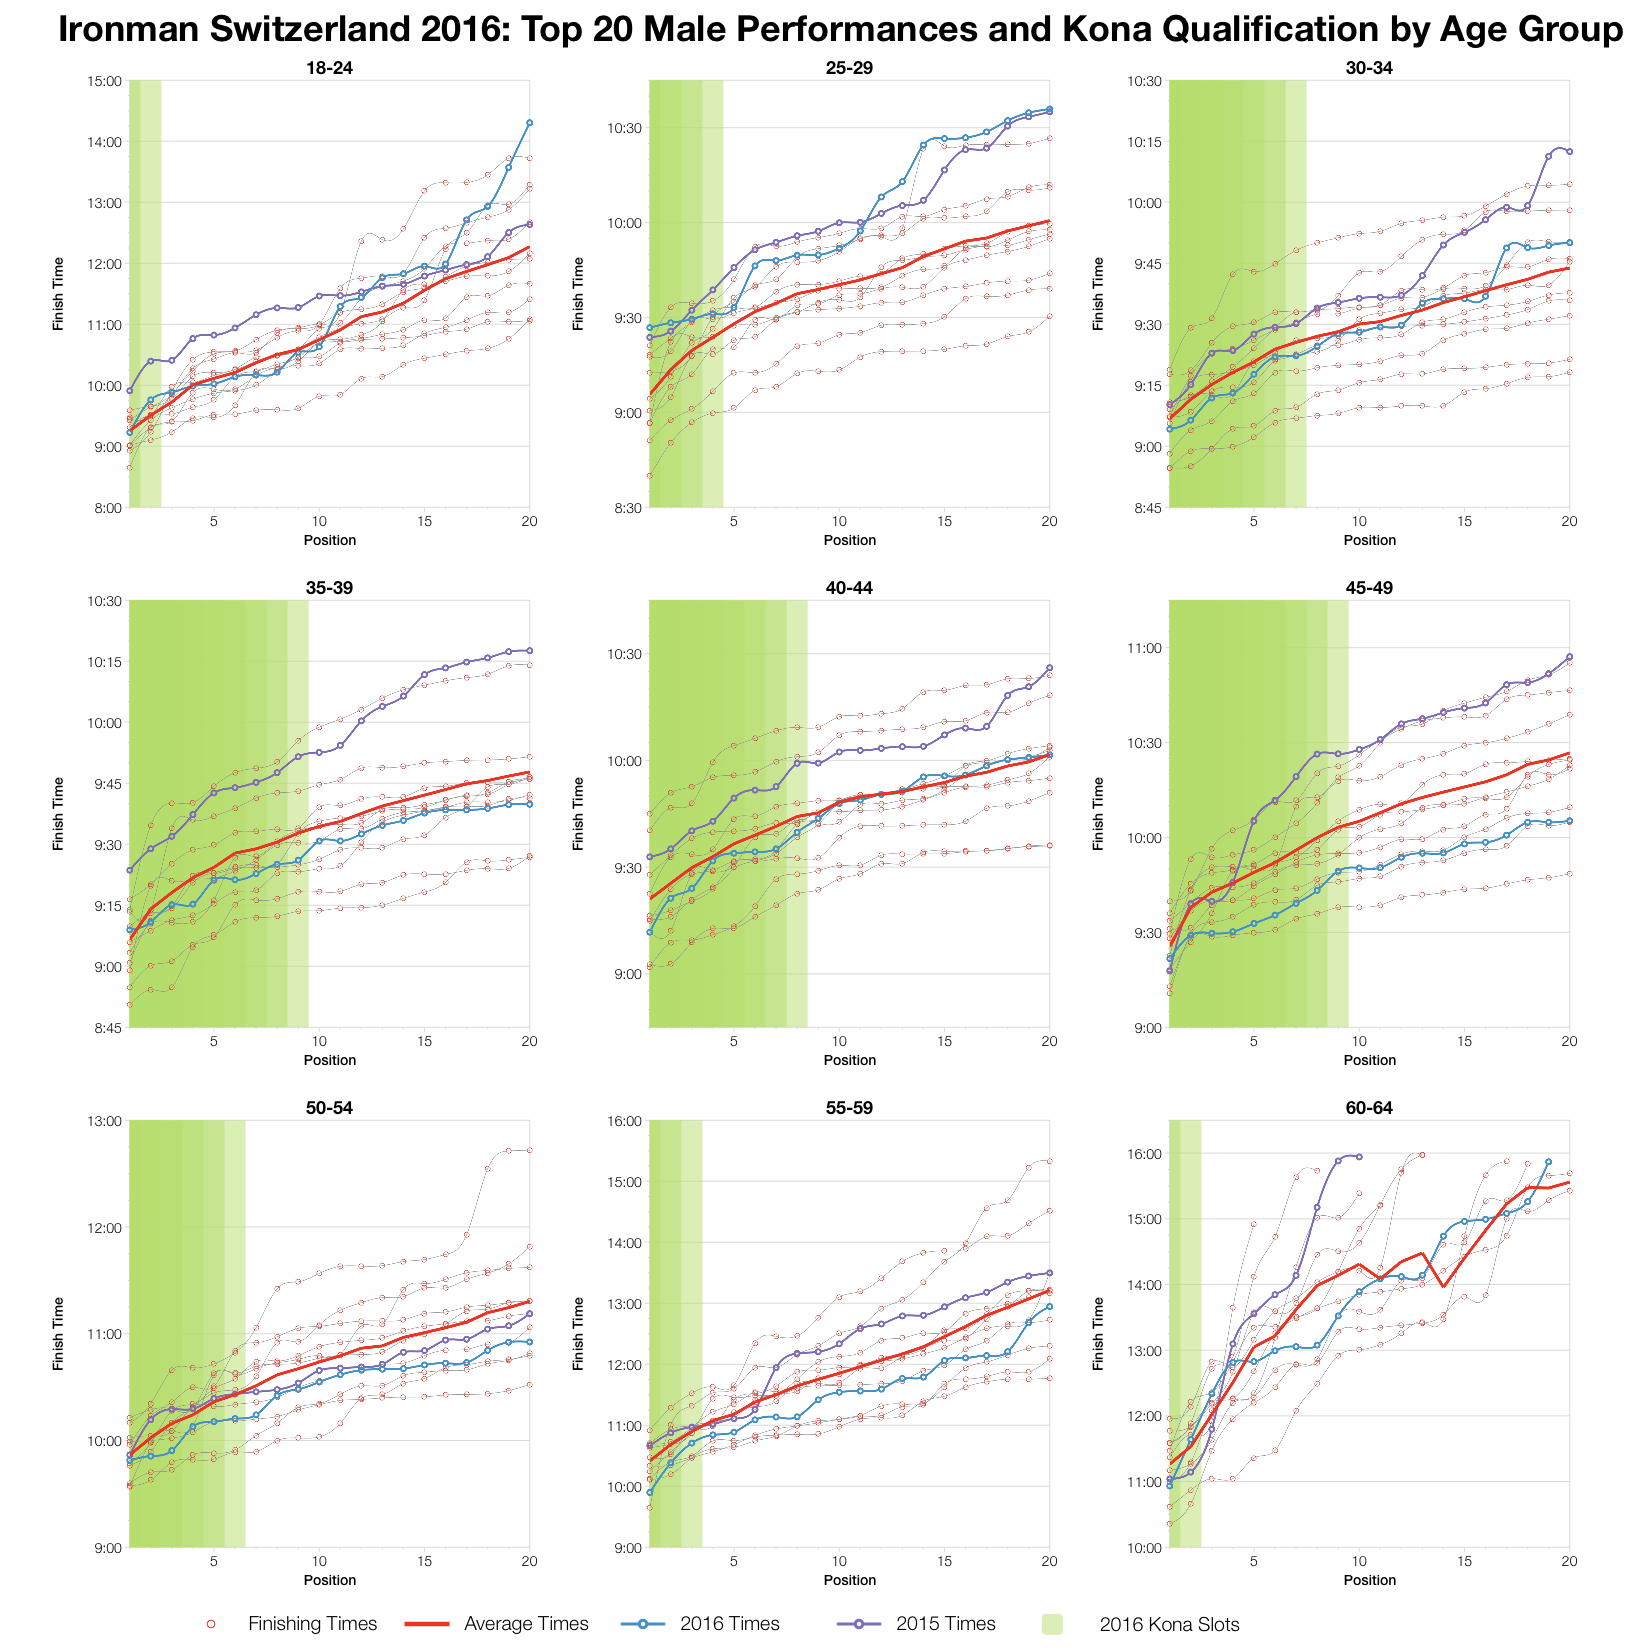
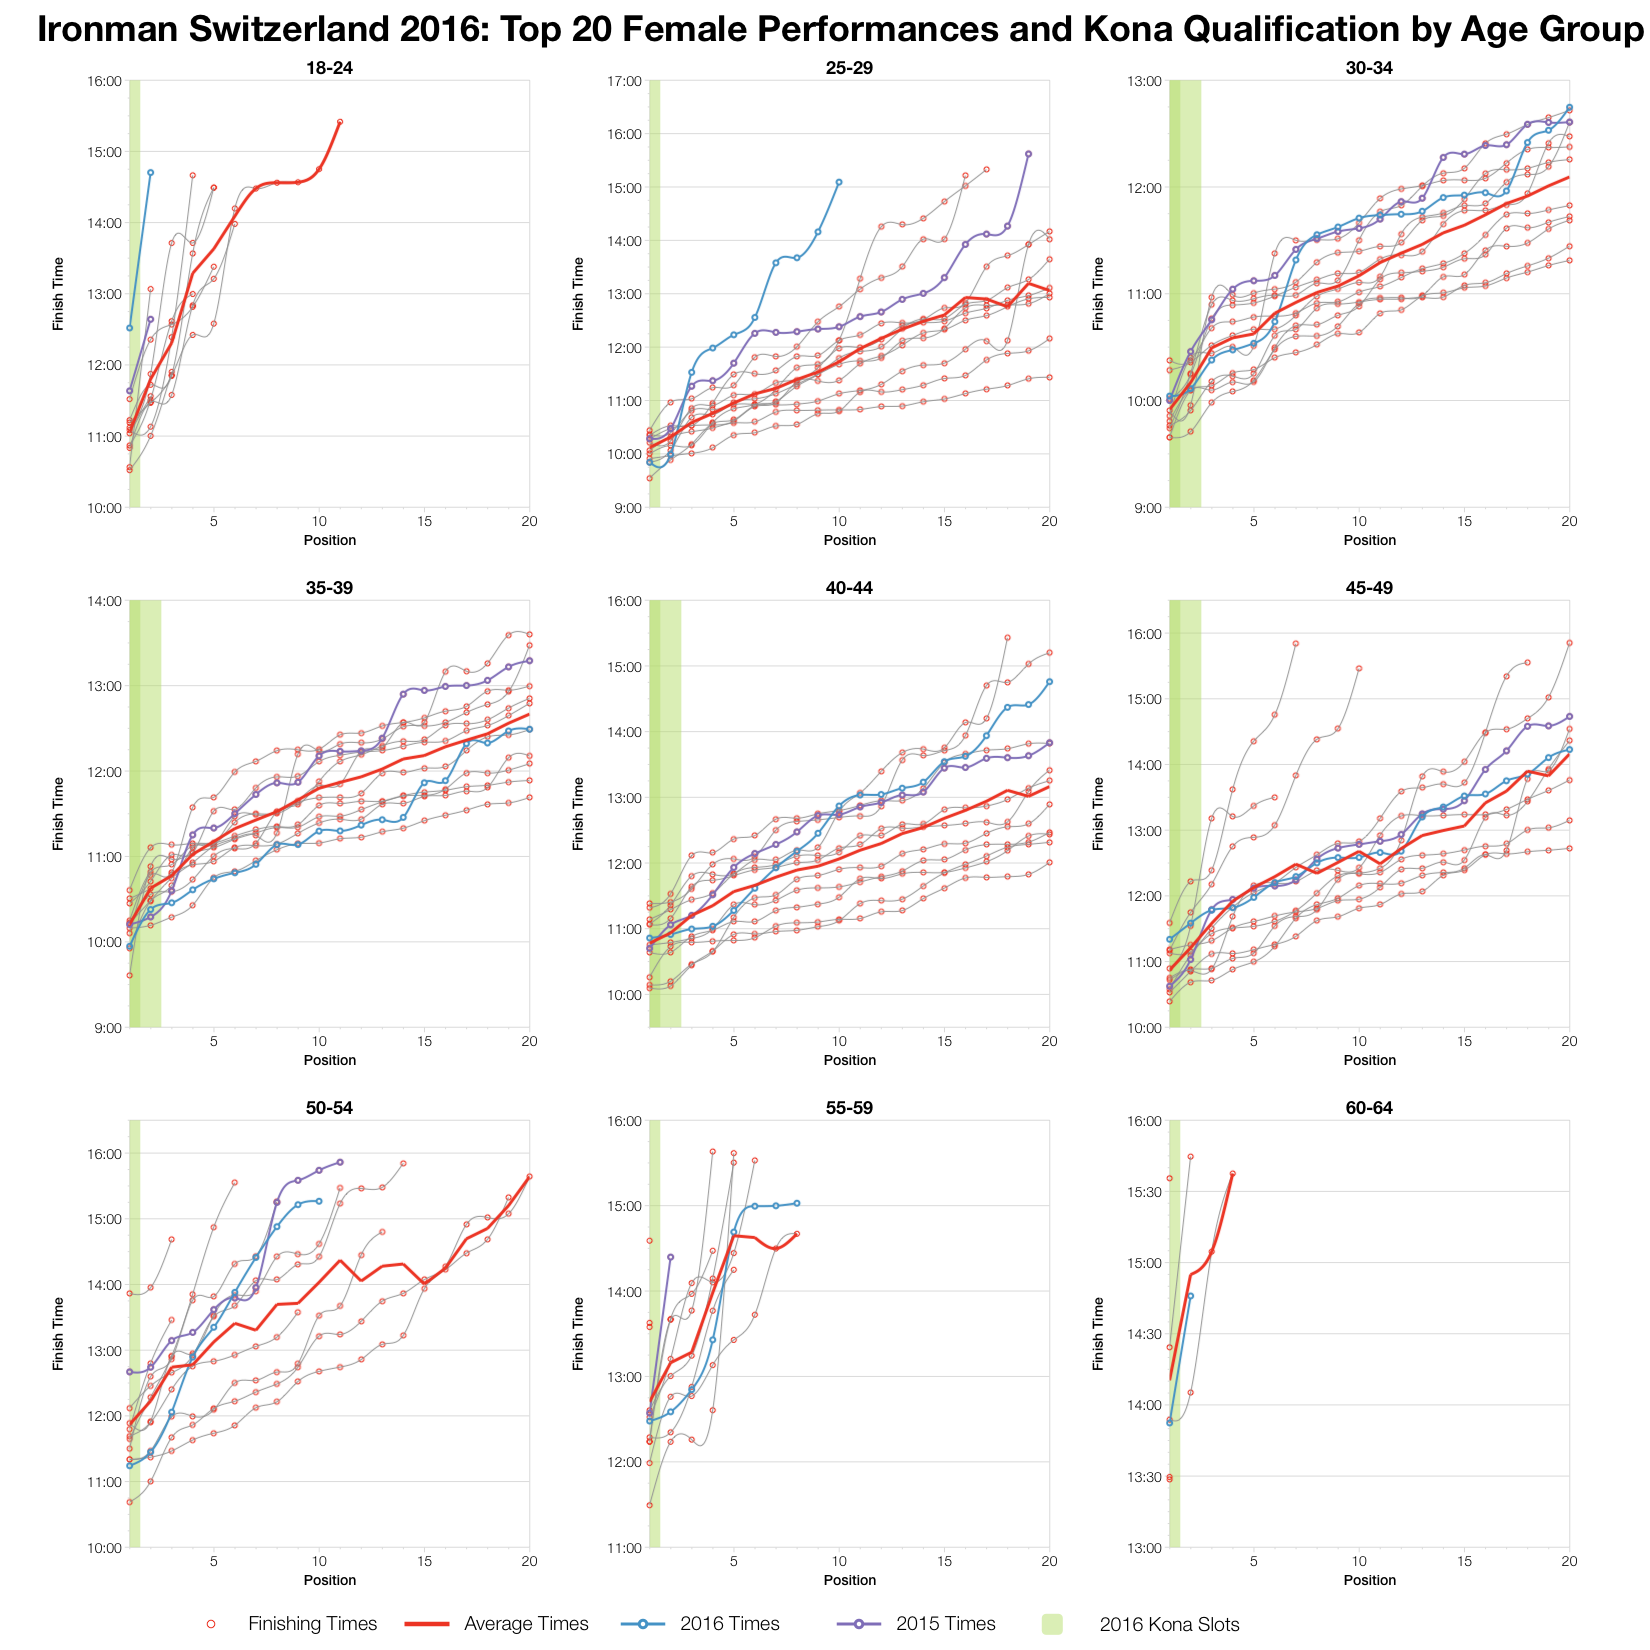
For the most part, among the top 20 of each age group, 2016 proved to be an average year for Ironman Switzerland. The majority of male age group times fall very close to the average from the previous decade. There’s a little more variation among female age groups, but even then, taking the largest age groups, the numbers tend towards the average. The biggest differences on the day were M45-49, which was distinctly quicker than average and M25-29, which was noticeably slower.
You can access a spreadsheet of the full results and splits from Ironman Switzerland 2016 on my Google Drive.


