Only one Ironman race this week – Ironman Boulder. It’s age groupers only, offering 40 Kona slots to a field just short of 1,500 athletes. The race is at altitude, a challenge for those competitors who live much closer to sea level. Being a hub for triathlon, Boulder also draws some particularly fast age group times with the winner finishing in under 8:40.
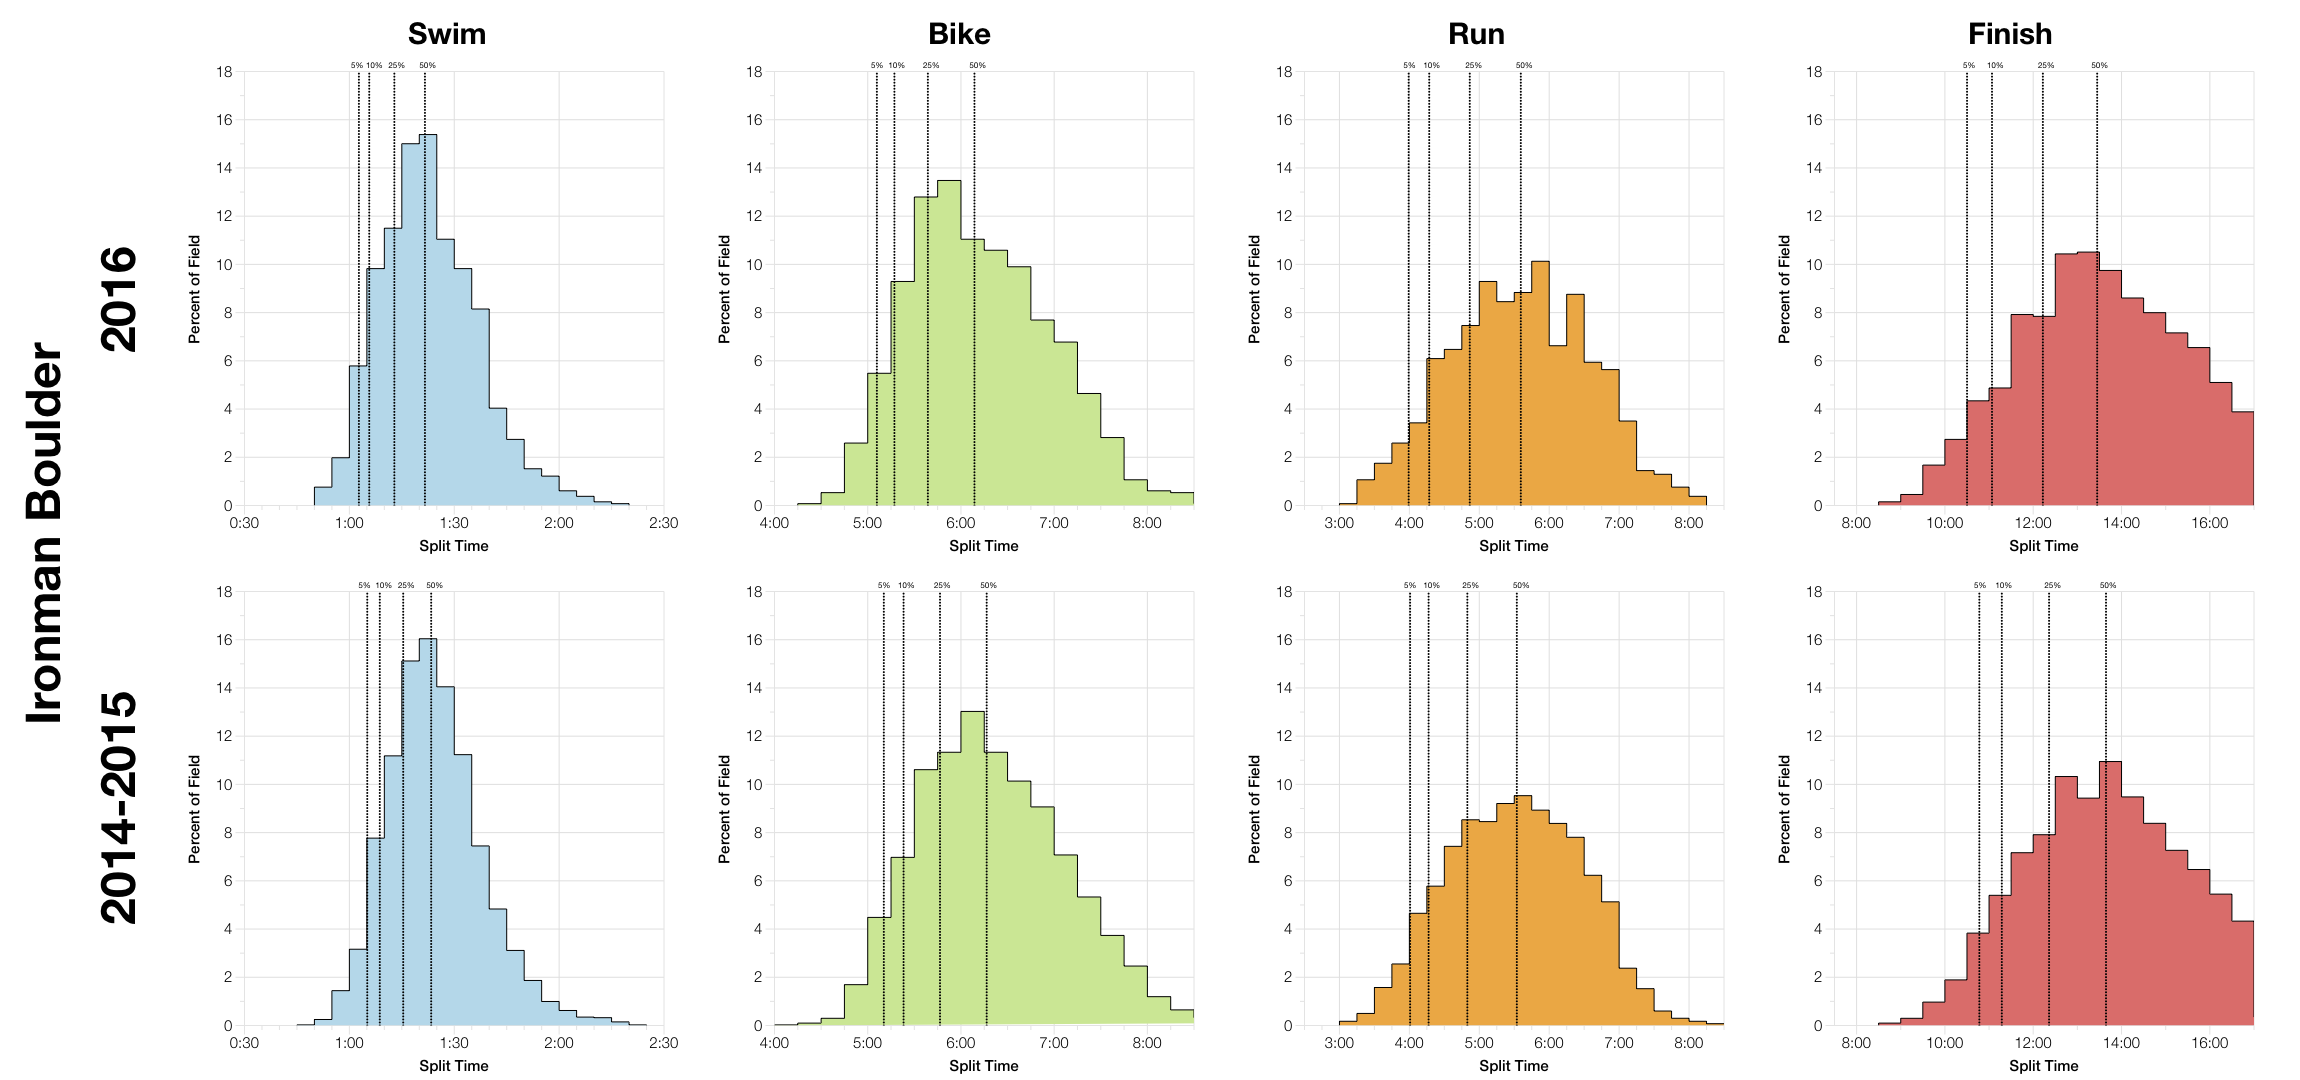
This year’s race appears to have been slightly faster then the previous two; the differences coming from the swim and bike. The run doesn’t vary much, with a slightly slowing at the median, but not significant enough to overcome the gains in earlier stages. This isn’t a huge shift and perhaps more noteworthy is the broadening of the overall distribution. Such a broadening shows an increase in the proportion of athletes finishing towards the front of pack, but also at the back.
I’ve previously noted how the local athletes are particularly competitive (and acclimatised to altitude) and visitors are in for a more challenging race. Roughly a third of competitors are from Colorado, about 5% from Boulder itself.
| Listed Athletes | Swim Finish | Swim DNS/DNF | Bike Finish | Bike DNF | Run Finish | Run DNF | Overall DNS/DNF | |
|---|---|---|---|---|---|---|---|---|
| 2014 | 2790 | 2260 | 19% | 2206 | 2.4% | 2001 | 9.3% | 27.5% |
| 2015 | 2769 | 2206 | 20.3% | 2146 | 2.7% | 2010 | 6.3% | 27.4% |
| 2016 | 1490 | 1459 | 2.1% | 1415 | 3% | 1313 | 7.2% | 11.9% |
One of the issues when calculating DNS and DNF numbers is that Ironman has varied how they list athletes – sometimes listing all entries, sometimes only those who pick up their race packs. For the last couple of years all entries have been listed making it impossible for me to separate DNF and DNS numbers from the data in the athlete tracker. Later results updates may correct this, but normally too late for me to incorporate into the analysis.
Clearly, this year’s race saw much lower numbers than before. DNF rates on bike and run fall largely in line with the past results, but swim DNF/DNS and overall DNF/DNS numbers have dropped significantly. Assuming all entries have been listed this likely represents a large fall in DNS numbers (not that unusual with lower entry numbers), but potentially also suggests swim DNFs were quite high in previous years too.
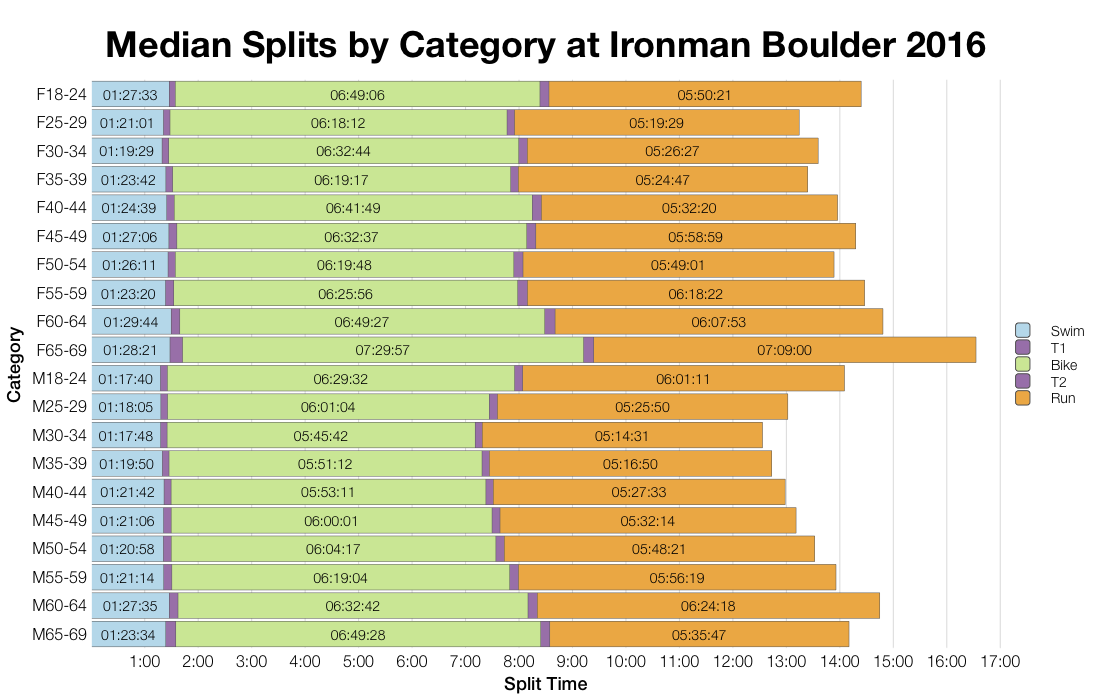
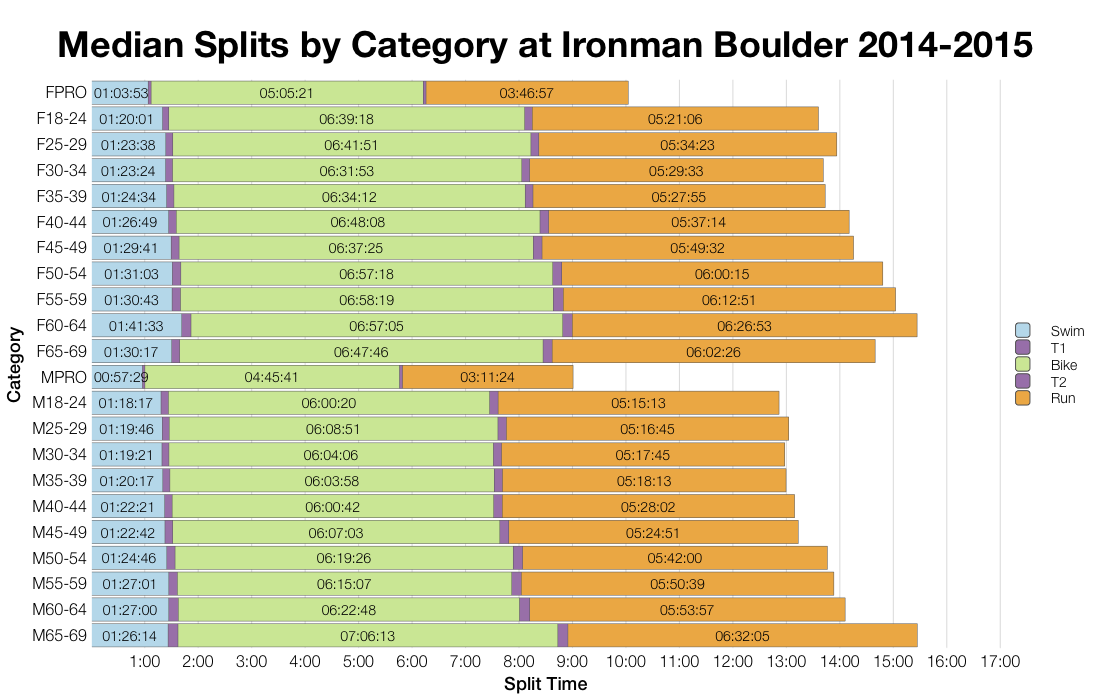
Median splits at Boulder do look to be faster on the bike and swim this year. The run remains similar, but in comparison with many other Ironman races could be considered slow. Possibly the impact of racing at altitude for many of the athletes.
| Count | Percentage | |
|---|---|---|
| United States | 1241 | 83.3 |
| Mexico | 99 | 6.6 |
| Colombia | 19 | 1.3 |
| United Kingdom | 17 | 1.1 |
| Canada | 15 | 1 |
| Germany | 10 | 0.7 |
| France | 8 | 0.5 |
| Japan | 8 | 0.5 |
| Italy | 7 | 0.5 |
| Guatemala | 5 | 0.3 |
The vast majority of entries come from the US, but Boulder seems to have a wider draw than many other North American races. It’s a varied mix of countries that follow on from the US.
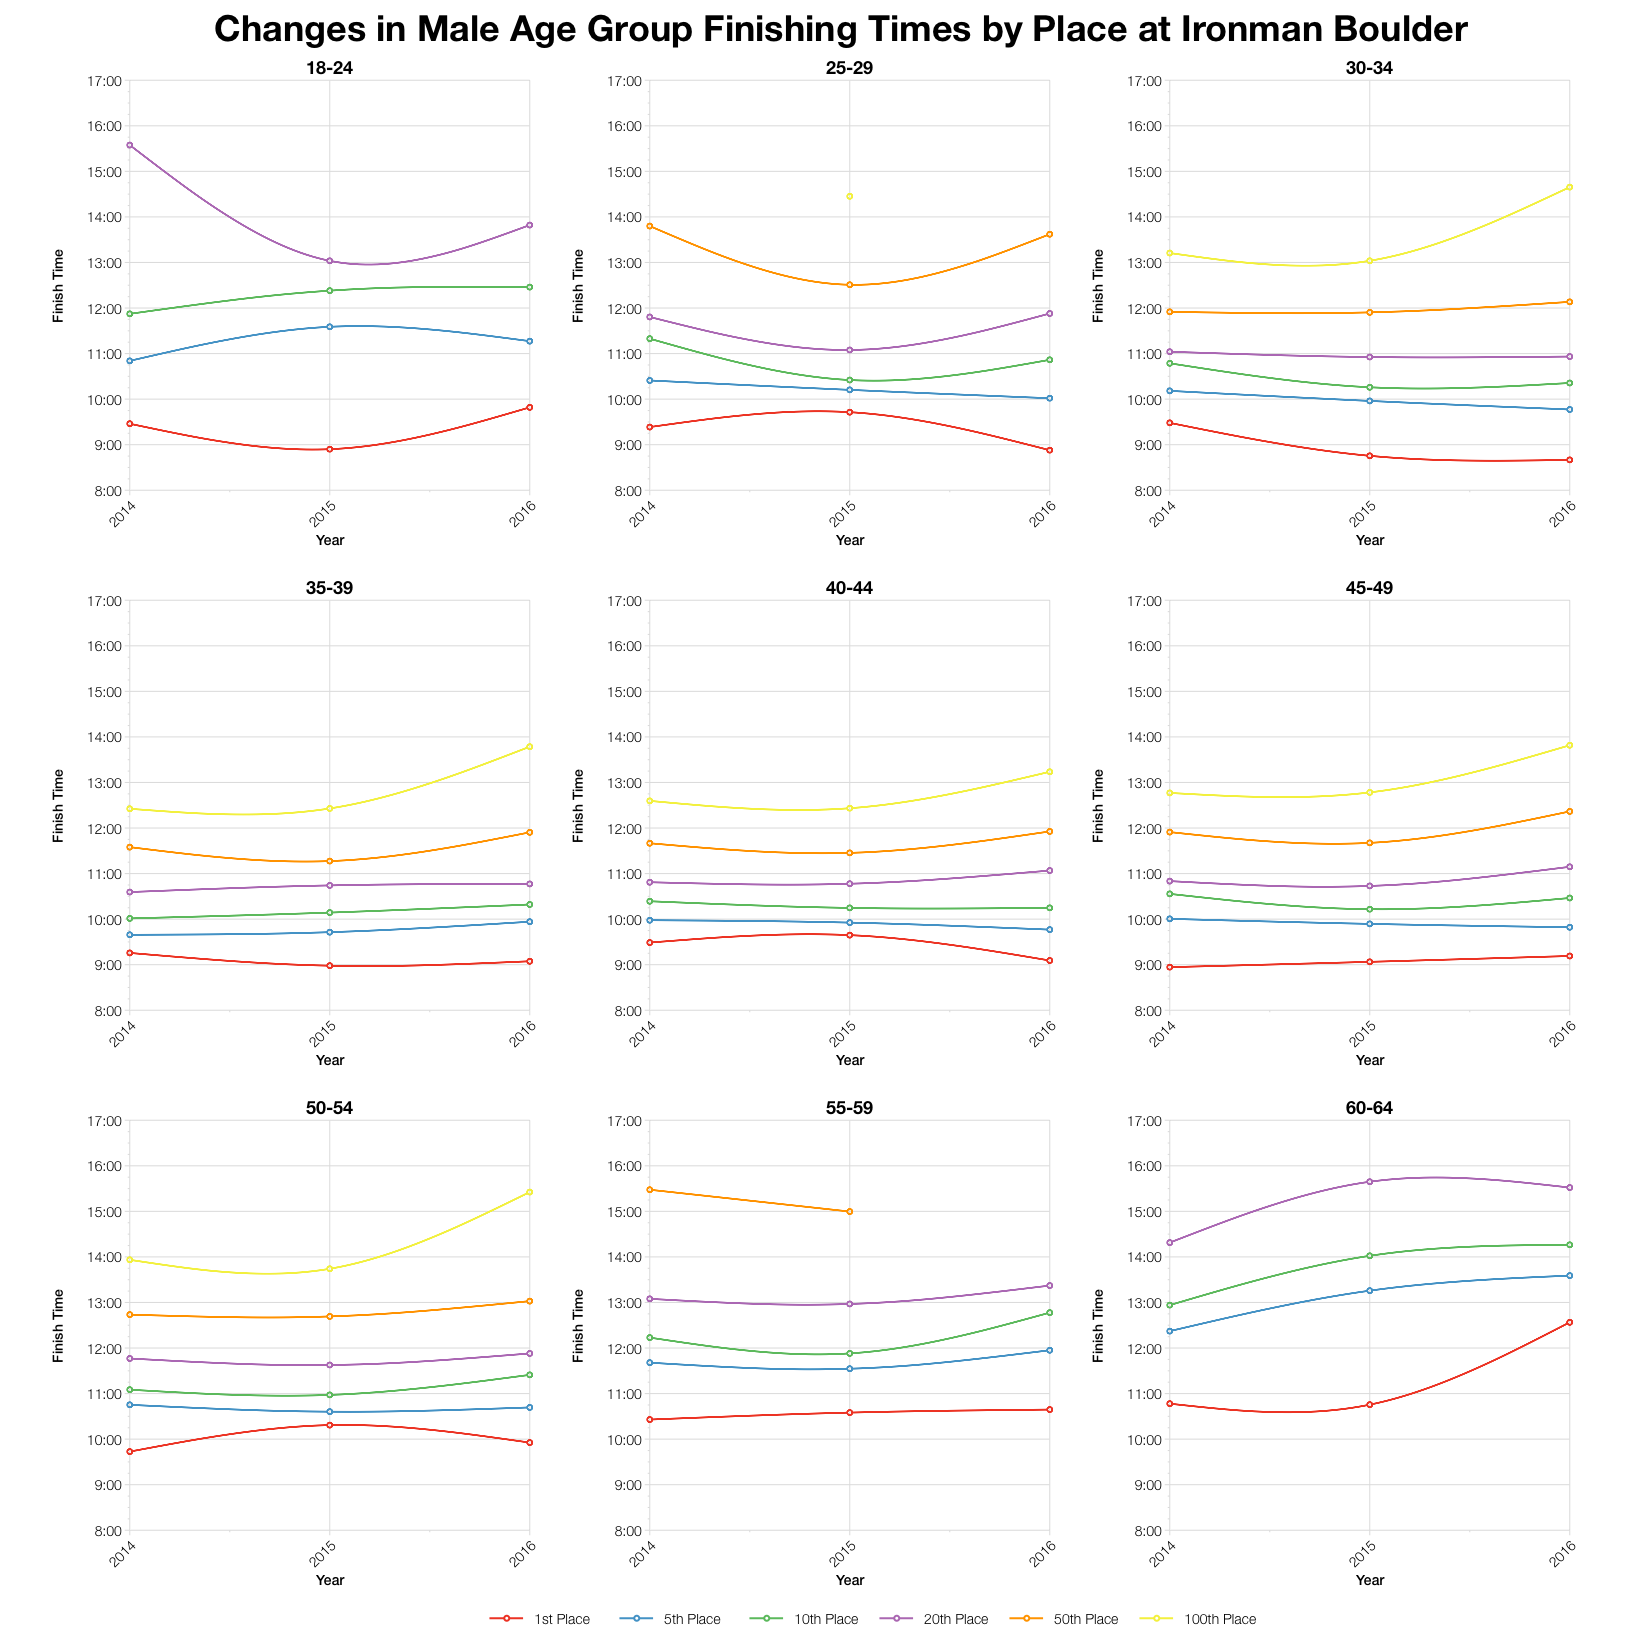
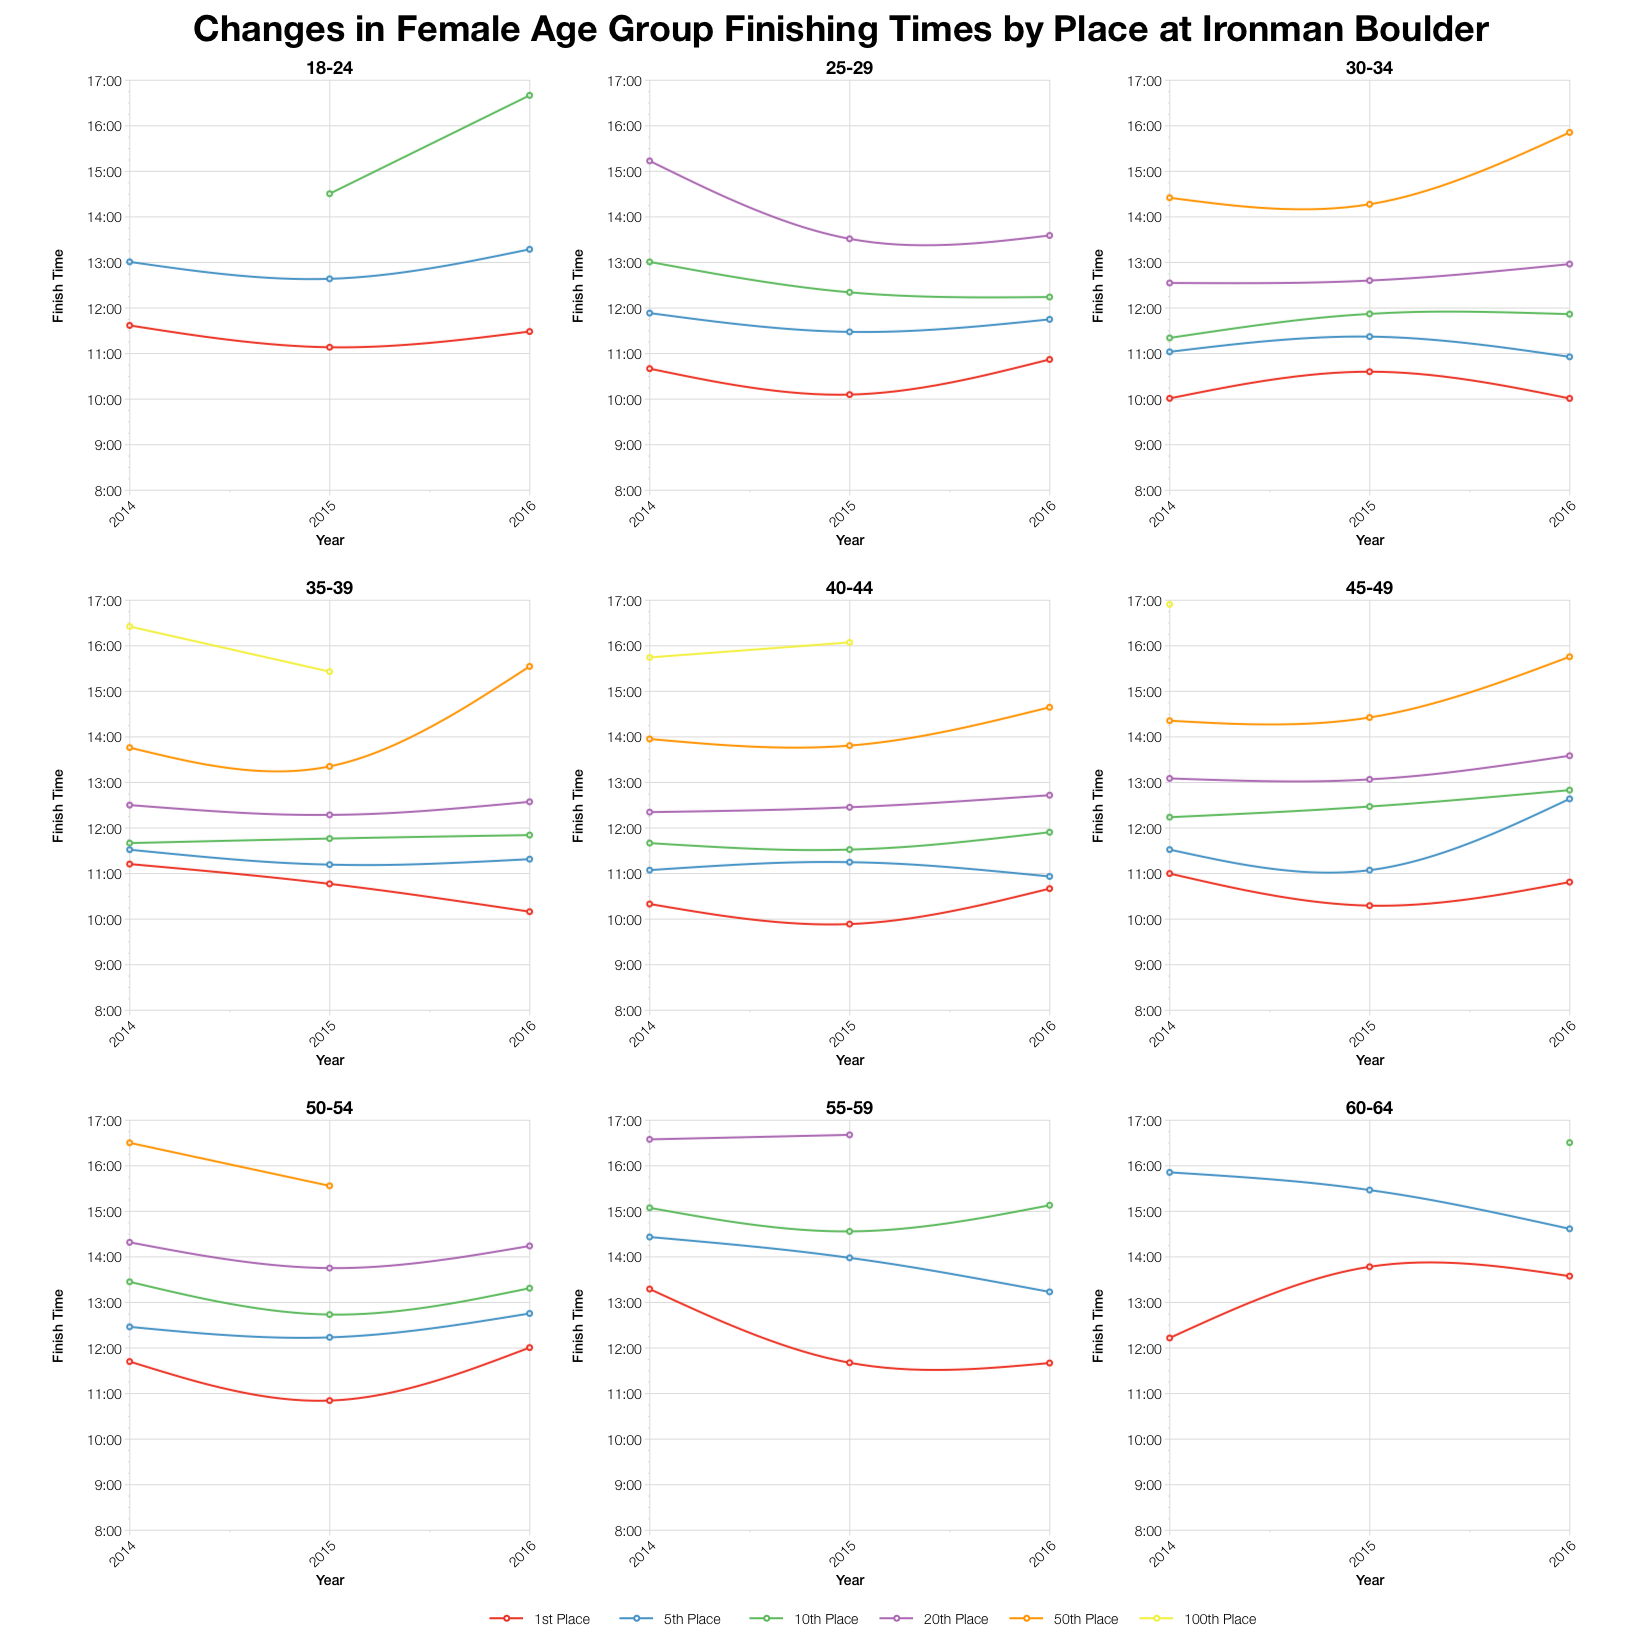
Tracking finish time by place over the three years of racing we can see the divergence between front of pack athletes who performed the same or better at this years race, and back of pack athletes who have slowed. The affect is amplified by the reduced field size which often pushes 100th place from middle to back of the field.
| Slots | Winner | Average Kona Qualifier | Final Qualifier | |
|---|---|---|---|---|
| M18-24 | 1 | 9:49:11 | 9:49:11 | 9:49:11 |
| M25-29 | 2 | 8:52:45 | 9:04:54 | 9:17:04 |
| M30-34 | 3 | 8:39:59 | 9:08:26 | 9:38:05 |
| M35-39 | 3 | 9:04:31 | 9:35:47 | 9:52:50 |
| M40-44 | 4 | 9:05:30 | 9:27:47 | 9:44:32 |
| M45-49 | 3 | 9:11:27 | 9:27:00 | 9:41:43 |
| M50-54 | 3 | 9:55:27 | 10:05:30 | 10:16:14 |
| M55-59 | 2 | 10:38:56 | 10:48:52 | 10:58:49 |
| M60-64 | 1 | 12:33:53 | 12:33:53 | 12:33:53 |
| M65-69 | 1 | 13:28:37 | 13:28:37 | 13:28:37 |
| M70-74 | 1 | 12:41:01 | 12:41:01 | 12:41:01 |
| F18-24 | 1 | 11:29:15 | 11:29:15 | 11:29:15 |
| F25-29 | 1 | 10:52:29 | 10:52:29 | 10:52:29 |
| F30-34 | 2 | 10:01:09 | 10:14:45 | 10:28:22 |
| F35-39 | 2 | 10:10:03 | 10:16:34 | 10:23:05 |
| F40-44 | 2 | 10:40:24 | 10:41:01 | 10:41:39 |
| F45-49 | 2 | 10:49:00 | 11:17:27 | 11:45:54 |
| F50-54 | 2 | 12:00:46 | 12:04:52 | 12:08:59 |
| F55-59 | 1 | 11:40:26 | 11:40:26 | 11:40:26 |
| F60-64 | 1 | 13:34:52 | 13:34:52 | 13:34:52 |
| F65-69 | 1 | 16:32:48 | 16:32:48 | 16:32:48 |
Based on the athlete tracker I’ve calculated the likely allocation of Kona slots across the age groups and from that the times that would automatically qualify in the results.The presence of a handful of very fast age groupers creates a brand spread to the qualifying times even when the number of slots is relatively low. There’s an hours difference between first and third in the M30-34 age group.
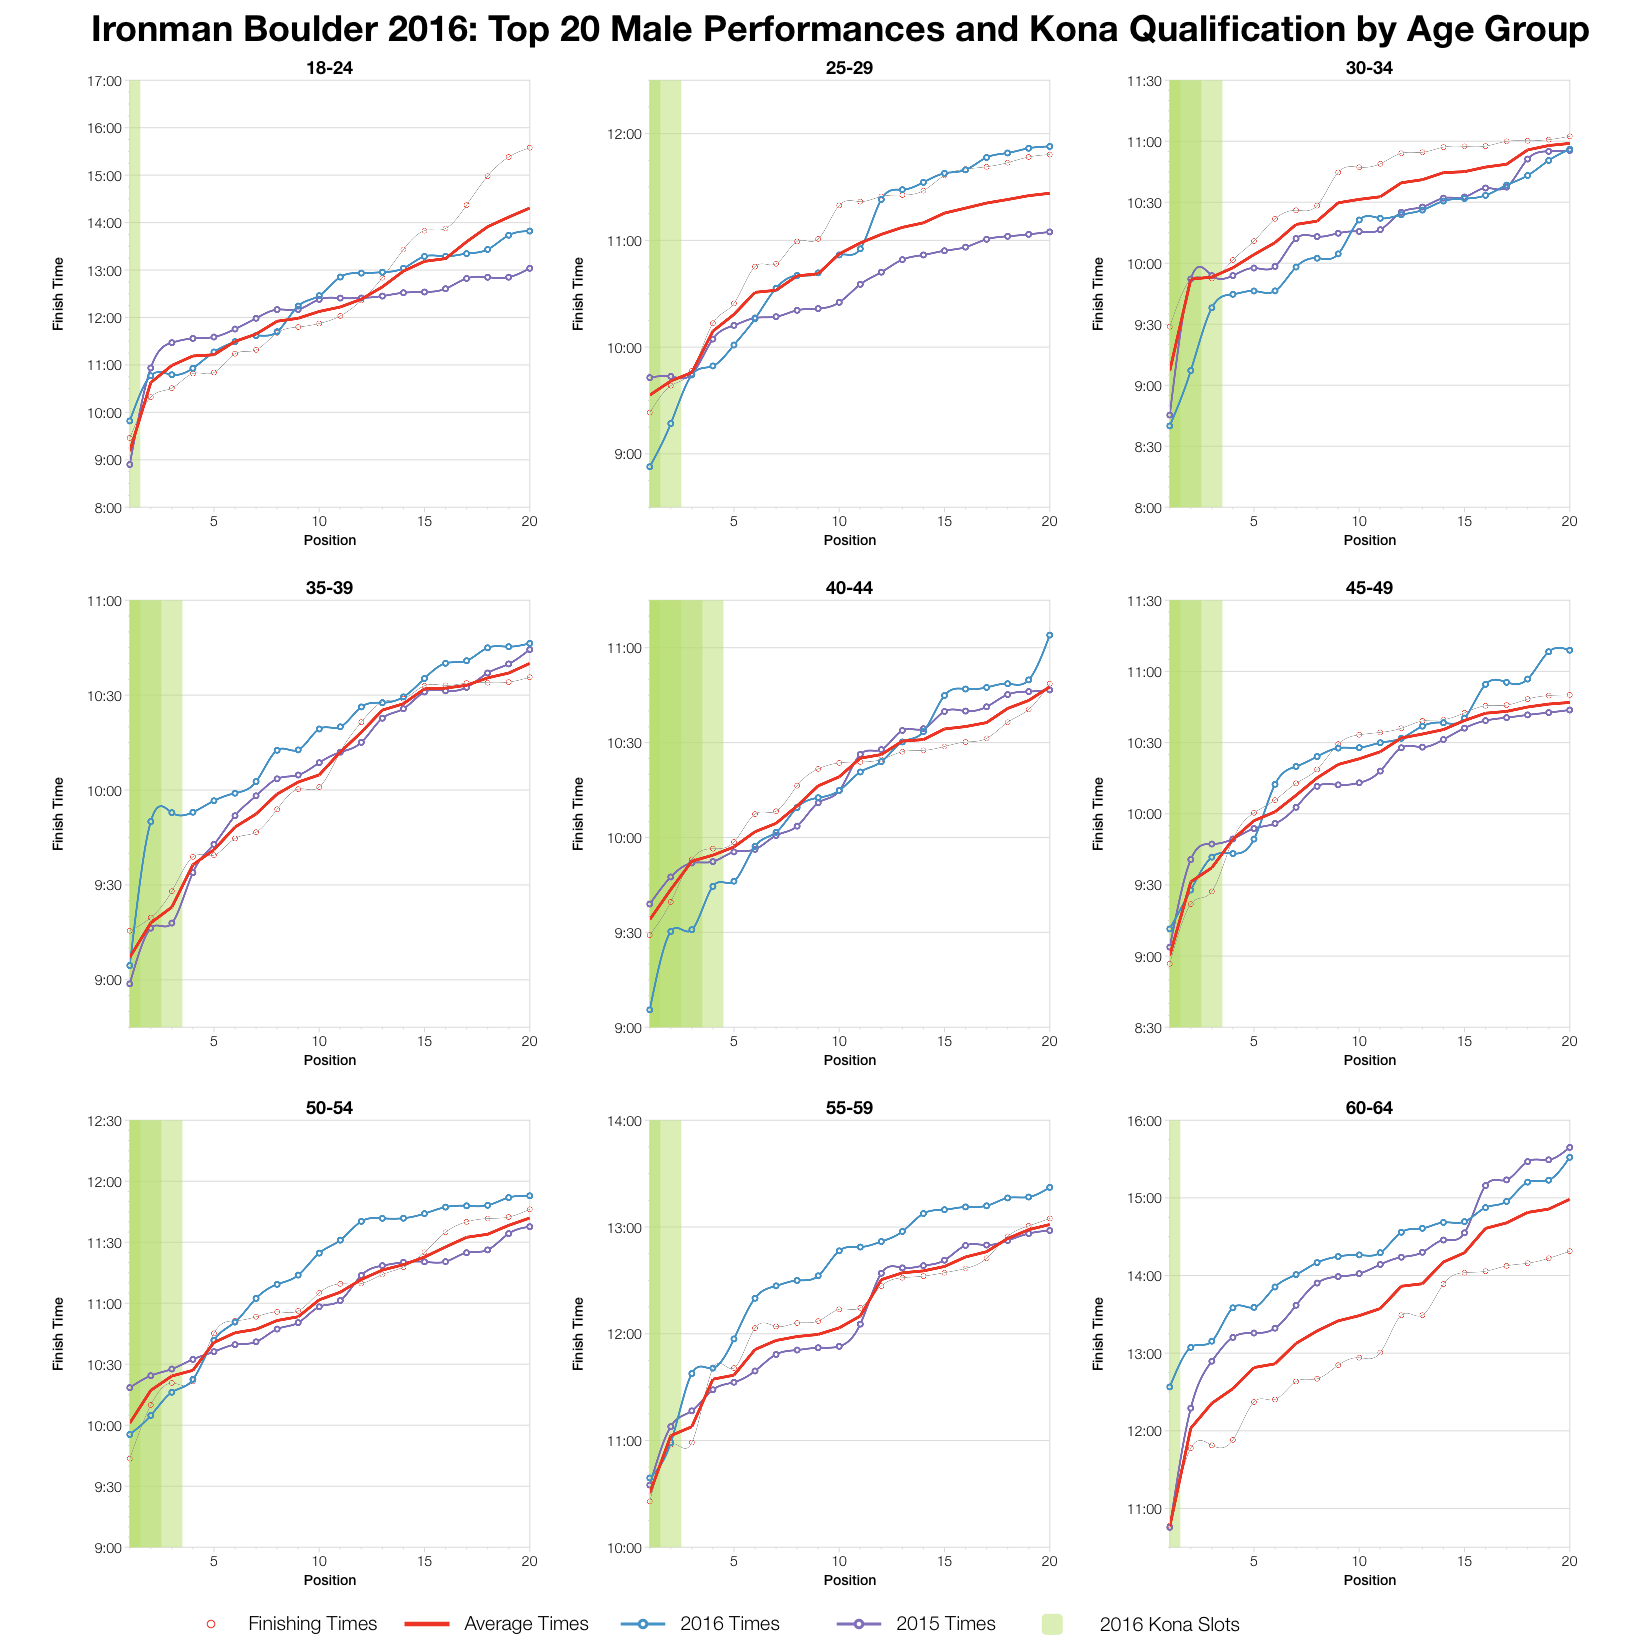
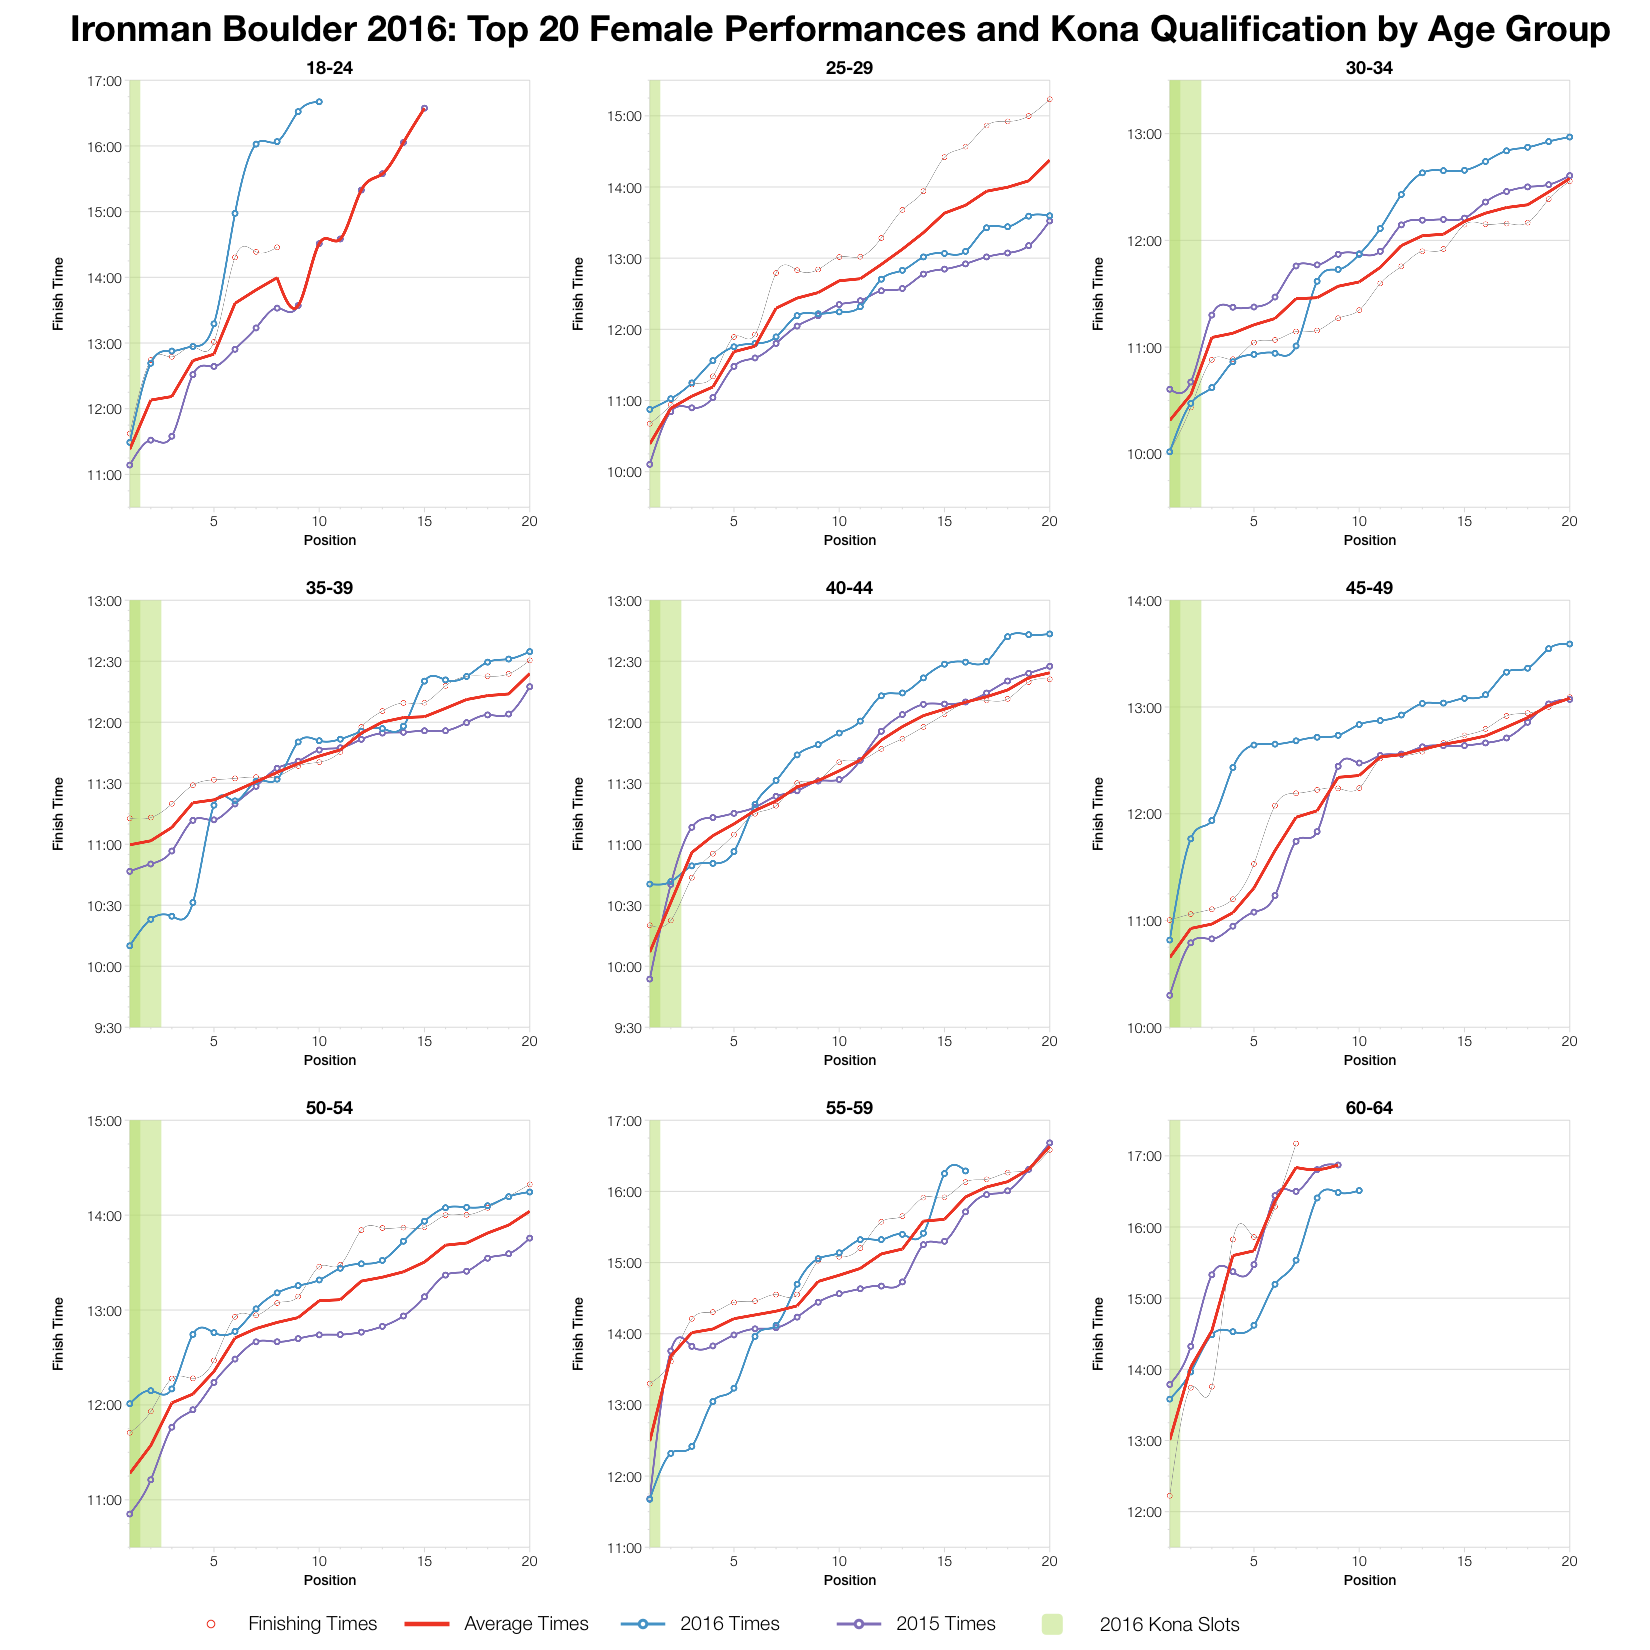
In broad terms Kona qualifying times tended to be consistent or better than average for this year’s race. Beyond that, much of the top twenty trended close to the age group average times. Older males, those over 50, appear to have been the furthest behind their top 20 curve and there are one or two exceptions in other age groups.
The reduced field size seems to have created a greater spread in the results, thinning out the middle of the pack. Boulder consistently draws a small pool of exceptionally fast age groupers (mostly locals I’d suspect) and it’s Kona qualification remains competitive as a consequence. It’s a challenging race for those not prepared for the change in altitude.
You can access a spreadsheet of the full results and splits from Ironman Boulder 2016 on my Google Drive.


