Tomorrow, Weymouth joins the Ironman calendar. Previously a Challenge race, it now carries the Ironman branding and a meagre 30 Kona slots for age group athletes. To spread those few slots further among the biggest age group Ironman is testing a new slot allocation, merging the 55+ age groups. Should a 70 year old enter, they’ll be competing against 55 year olds for the two slots that will likely be available to them.
Given this unusual Kona slot allocation, I thought I’d take a quick look at results from the previous Challenge races and what they suggest for qualifiers. If you’re just interested in qualification, you’ll find the table of slots and times further down this page.
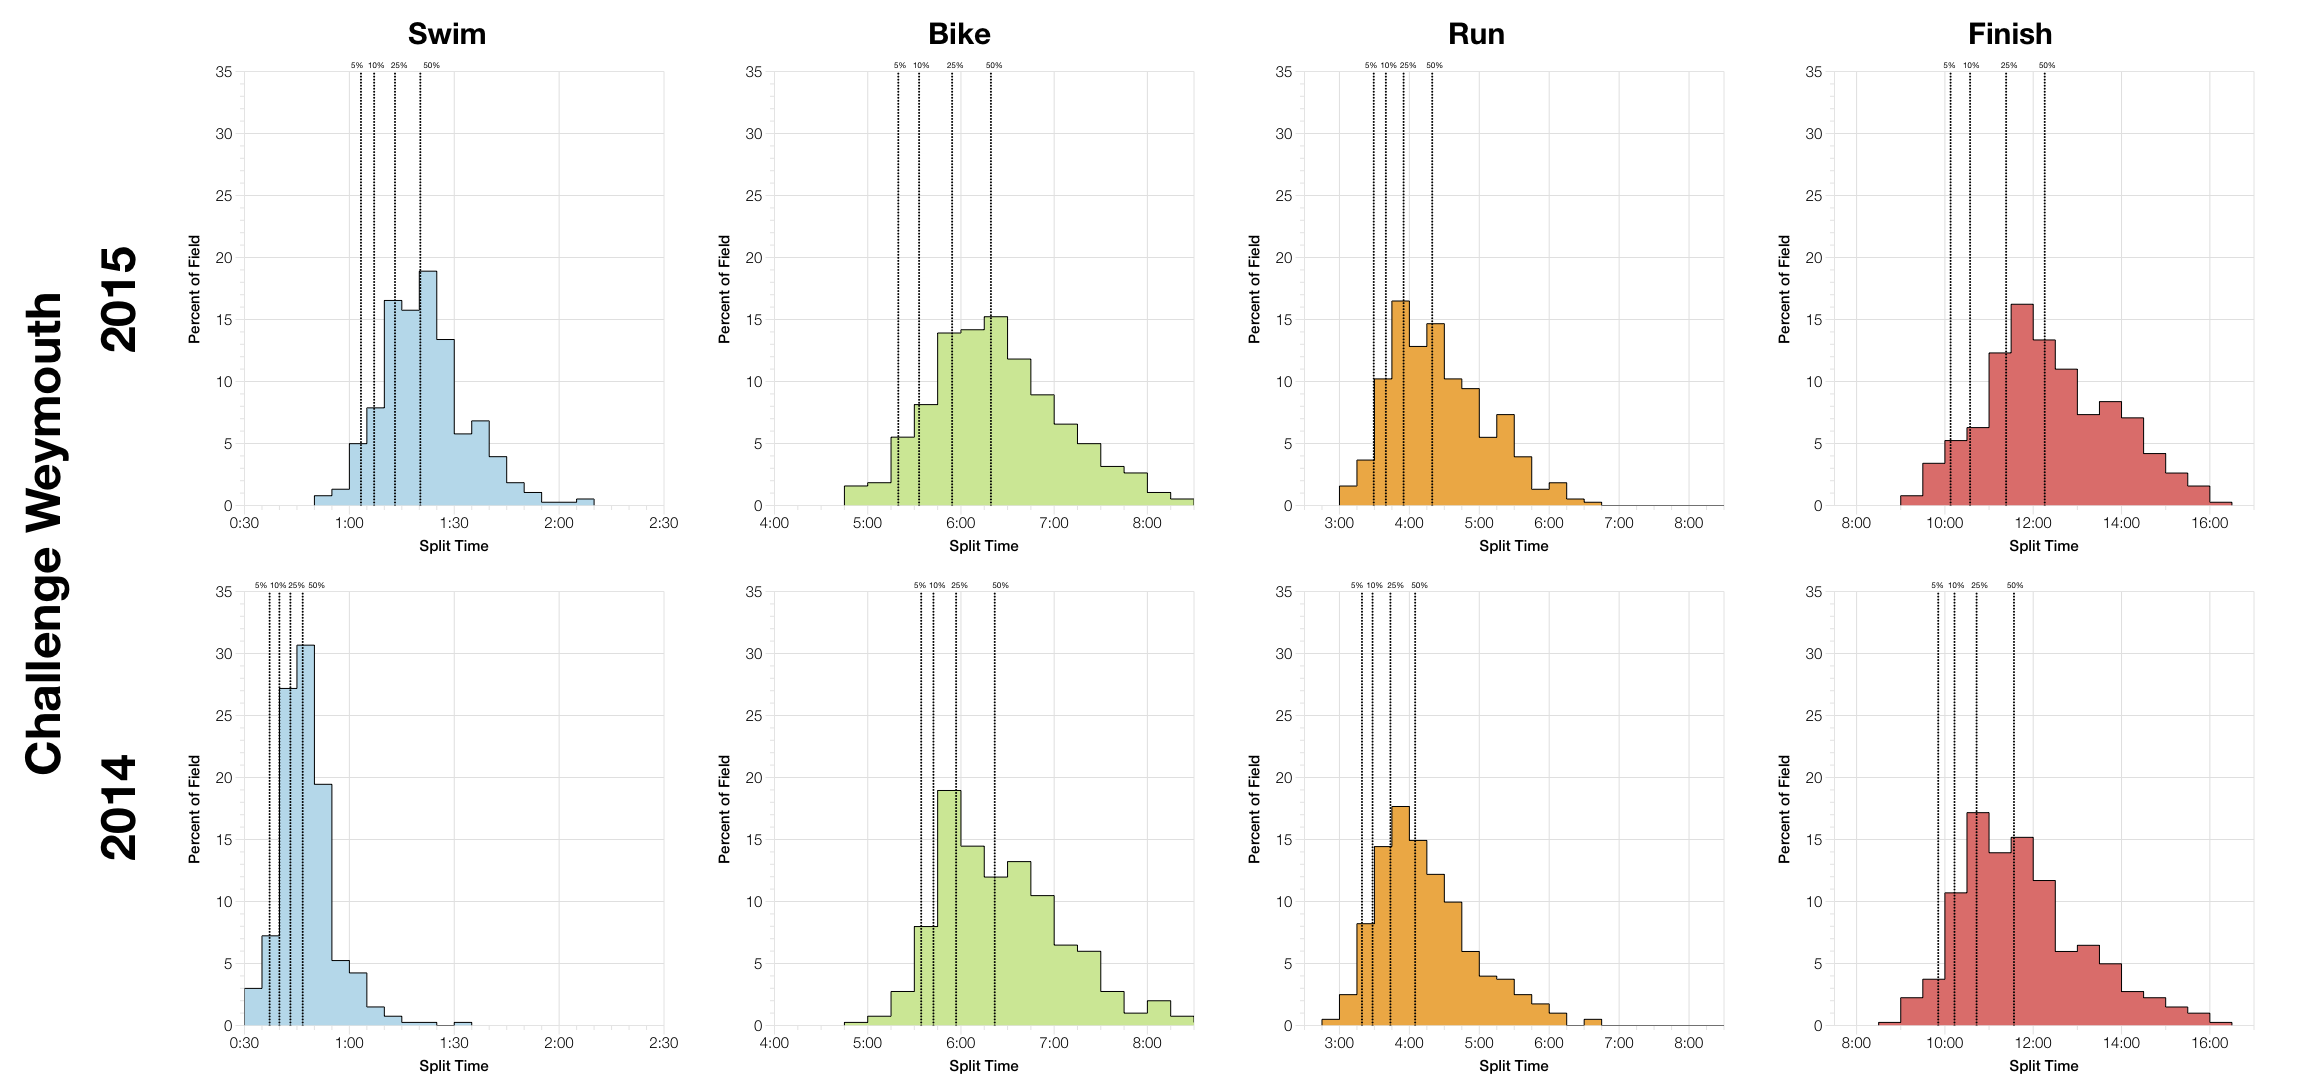
The first year of Challenge Weymouth was particularly fast, although this looks to be due to a short or current assisted swim. There isn’t as much difference between the two years out of the water; 2014 is faster on the run and combined with the swim times that made it faster overall. The 2015 bike course appears to have been quicker though, particularly at the front of pack.
| Listed Athletes | Swim Finish | Swim DNS/DNF | Bike Finish | Bike DNF | Run Finish | Run DNF | Overall DNS/DNF | |
|---|---|---|---|---|---|---|---|---|
| 2014 | 449 | 441 | 1.8% | 432 | 2% | 417 | 3.5% | 6.9% |
| 2015 | 430 | 424 | 1.4% | 413 | 2.6% | 399 | 3.4% | 7.4% |
DNF rates are consistent between the two years. The entry rates for Challenge were fairly low, while numbers for Ironman appear to be in the 800s. That’s still low for an Ironman, but it’s new and competing with the more established Ironman Wales that also comes with more Kona slots.
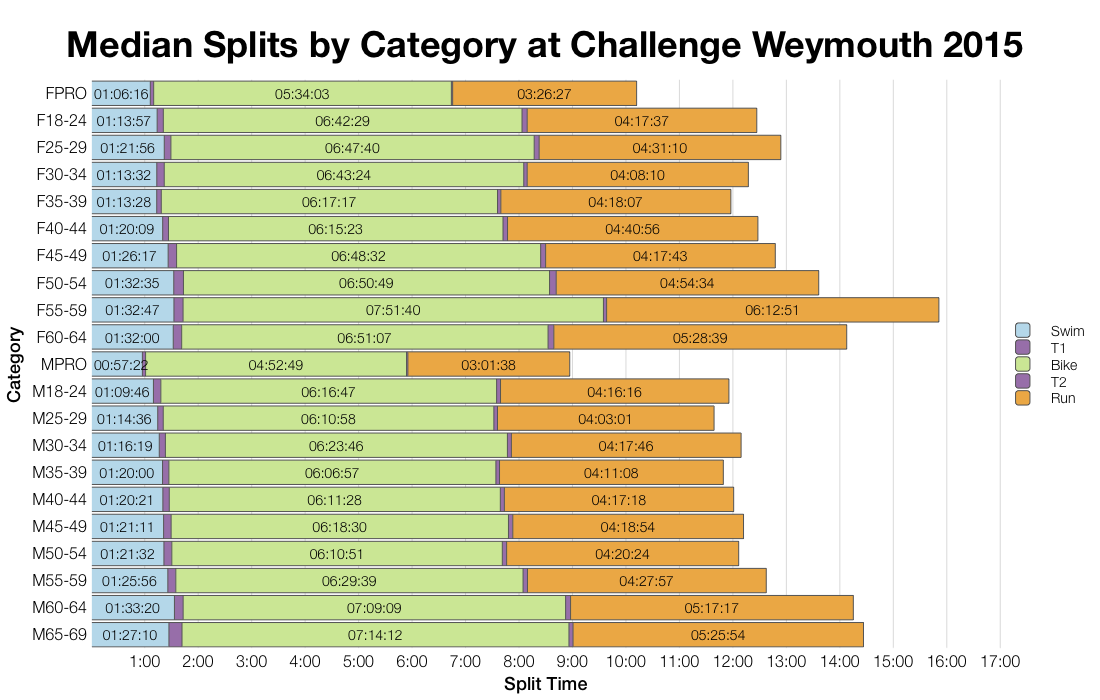
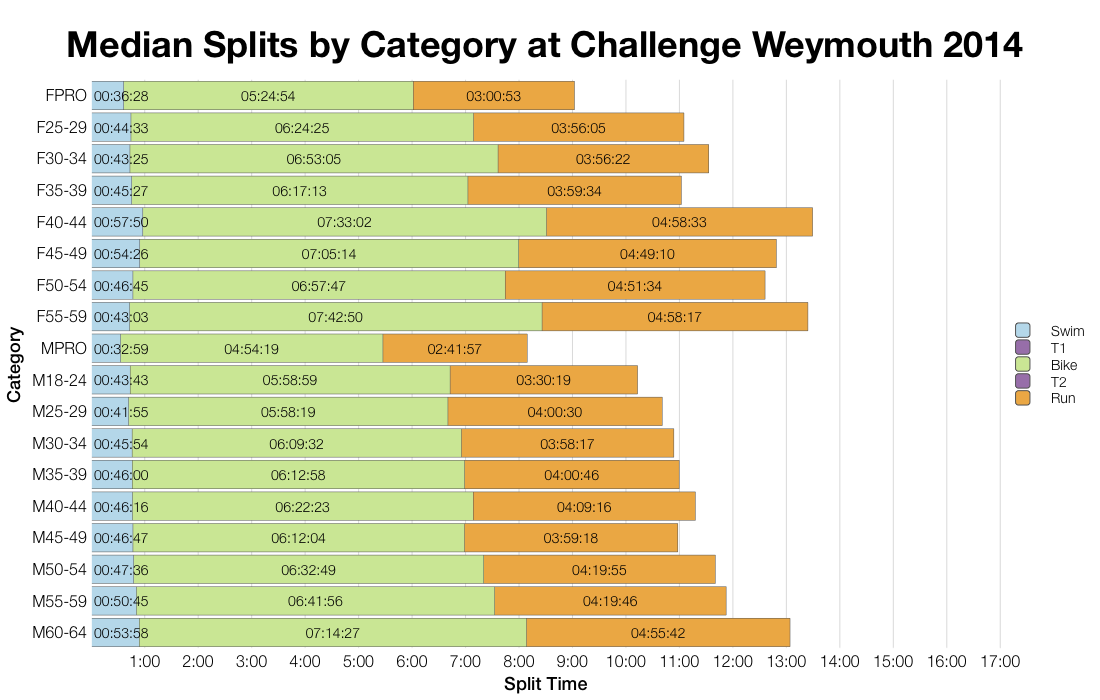
We can see the big difference in swim medians between the two years. As with the distributions, the 2014 run is the faster of the two while 2015 is ahead on the bike. The differences in bike splits are more varied over the age groups while swim and run show more consistent trends.
| Slots | Winner | Average Kona Qualifier | Final Qualifier | |
|---|---|---|---|---|
| M18-24 | 1 | 9:42:53 | 9:42:53 | 9:42:53 |
| M25-29 | 2 | 9:13:43 | 9:25:29 | 9:37:16 |
| M30-34 | 2 | 9:15:23 | 9:36:08 | 9:56:53 |
| M35-39 | 2 | 9:25:03 | 9:37:32 | 9:50:01 |
| M40-44 | 3 | 9:31:19 | 9:48:25 | 9:58:22 |
| M45-49 | 2 | 9:41:10 | 9:46:05 | 9:51:00 |
| M50-54 | 2 | 10:34:05 | 10:34:54 | 10:35:43 |
| M55+ | 2 | 10:54:07 | 11:02:40 | 11:11:14 |
| F18-24 | 1 | 11:15:41 | 11:15:41 | 11:15:41 |
| F25-29 | 1 | 11:58:57 | 11:58:57 | 11:58:57 |
| F30-34 | 2 | 11:04:28 | 11:09:38 | 11:14:49 |
| F35-39 | 2 | 11:11:04 | 11:13:16 | 11:15:28 |
| F40-44 | 2 | 11:05:40 | 11:11:43 | 11:17:47 |
| F45-49 | 1 | 11:38:10 | 11:38:10 | 11:38:10 |
| F50-54 | 1 | 11:54:36 | 11:54:36 | 11:54:36 |
| F55+ | 1 | 14:07:45 | 14:07:45 | 14:07:45 |
The table above uses the athlete counts from Challenge Weymouth and applies the Ironman Weymouth Kona slot allocation to these numbers (30 Kona slots, with 55+ age groups combined). From there it then averages the likely qualifying times based on placings in the 2014 and 2015 Challenge races.
It’s a very rough guide to Kona qualification. Given the increase number of athletes at the race we may see different age group distributions and will certainly see a different range of qualifying times. It’s safe to say that the merging of all 55+ age groups will likely make this a poor qualification choice for anyone in a 60+ age group.
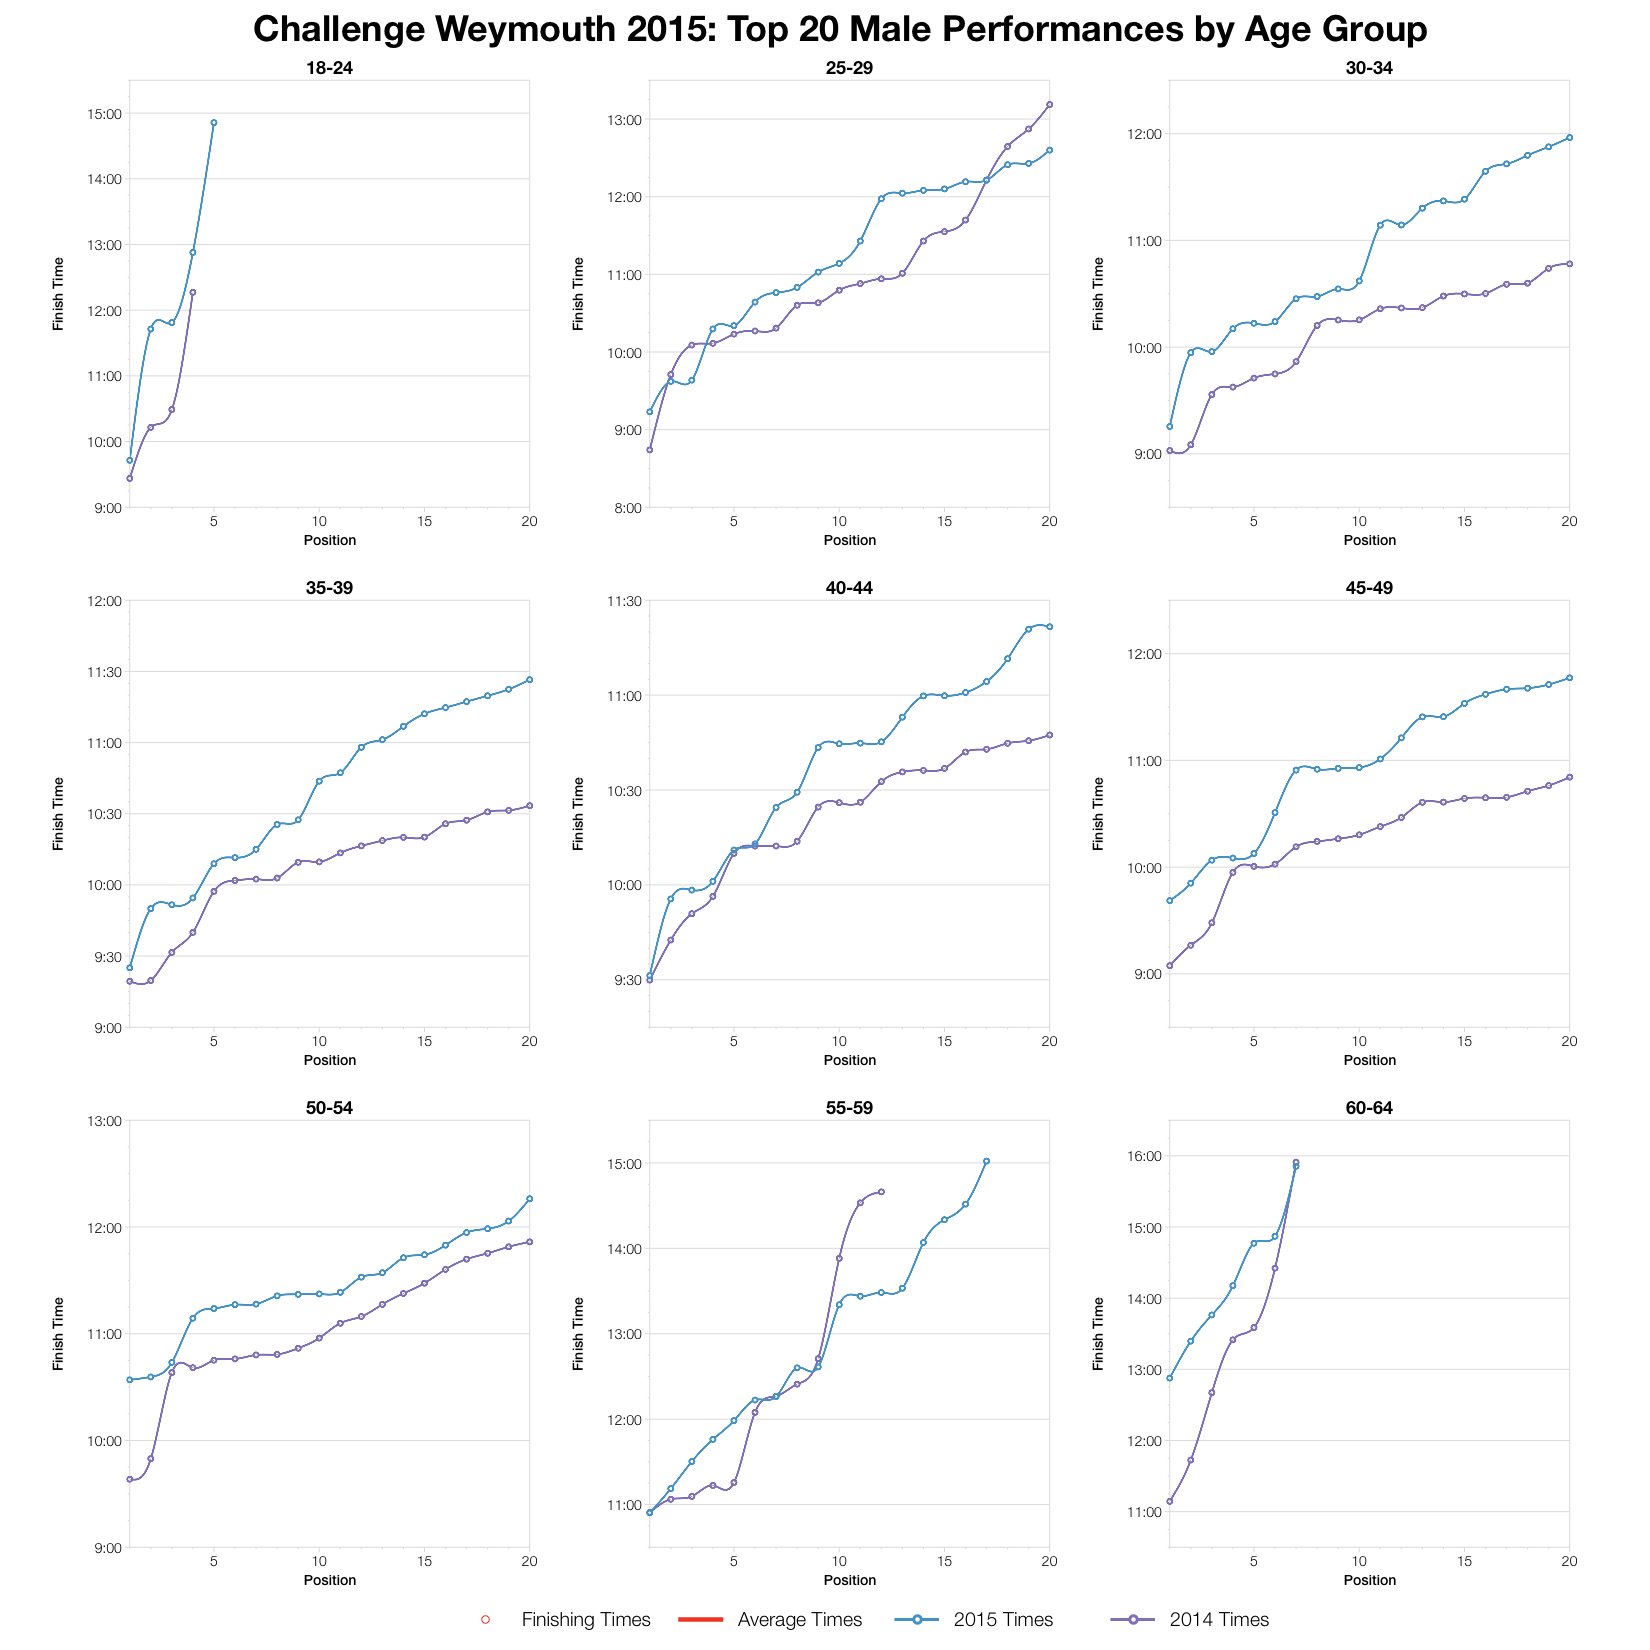
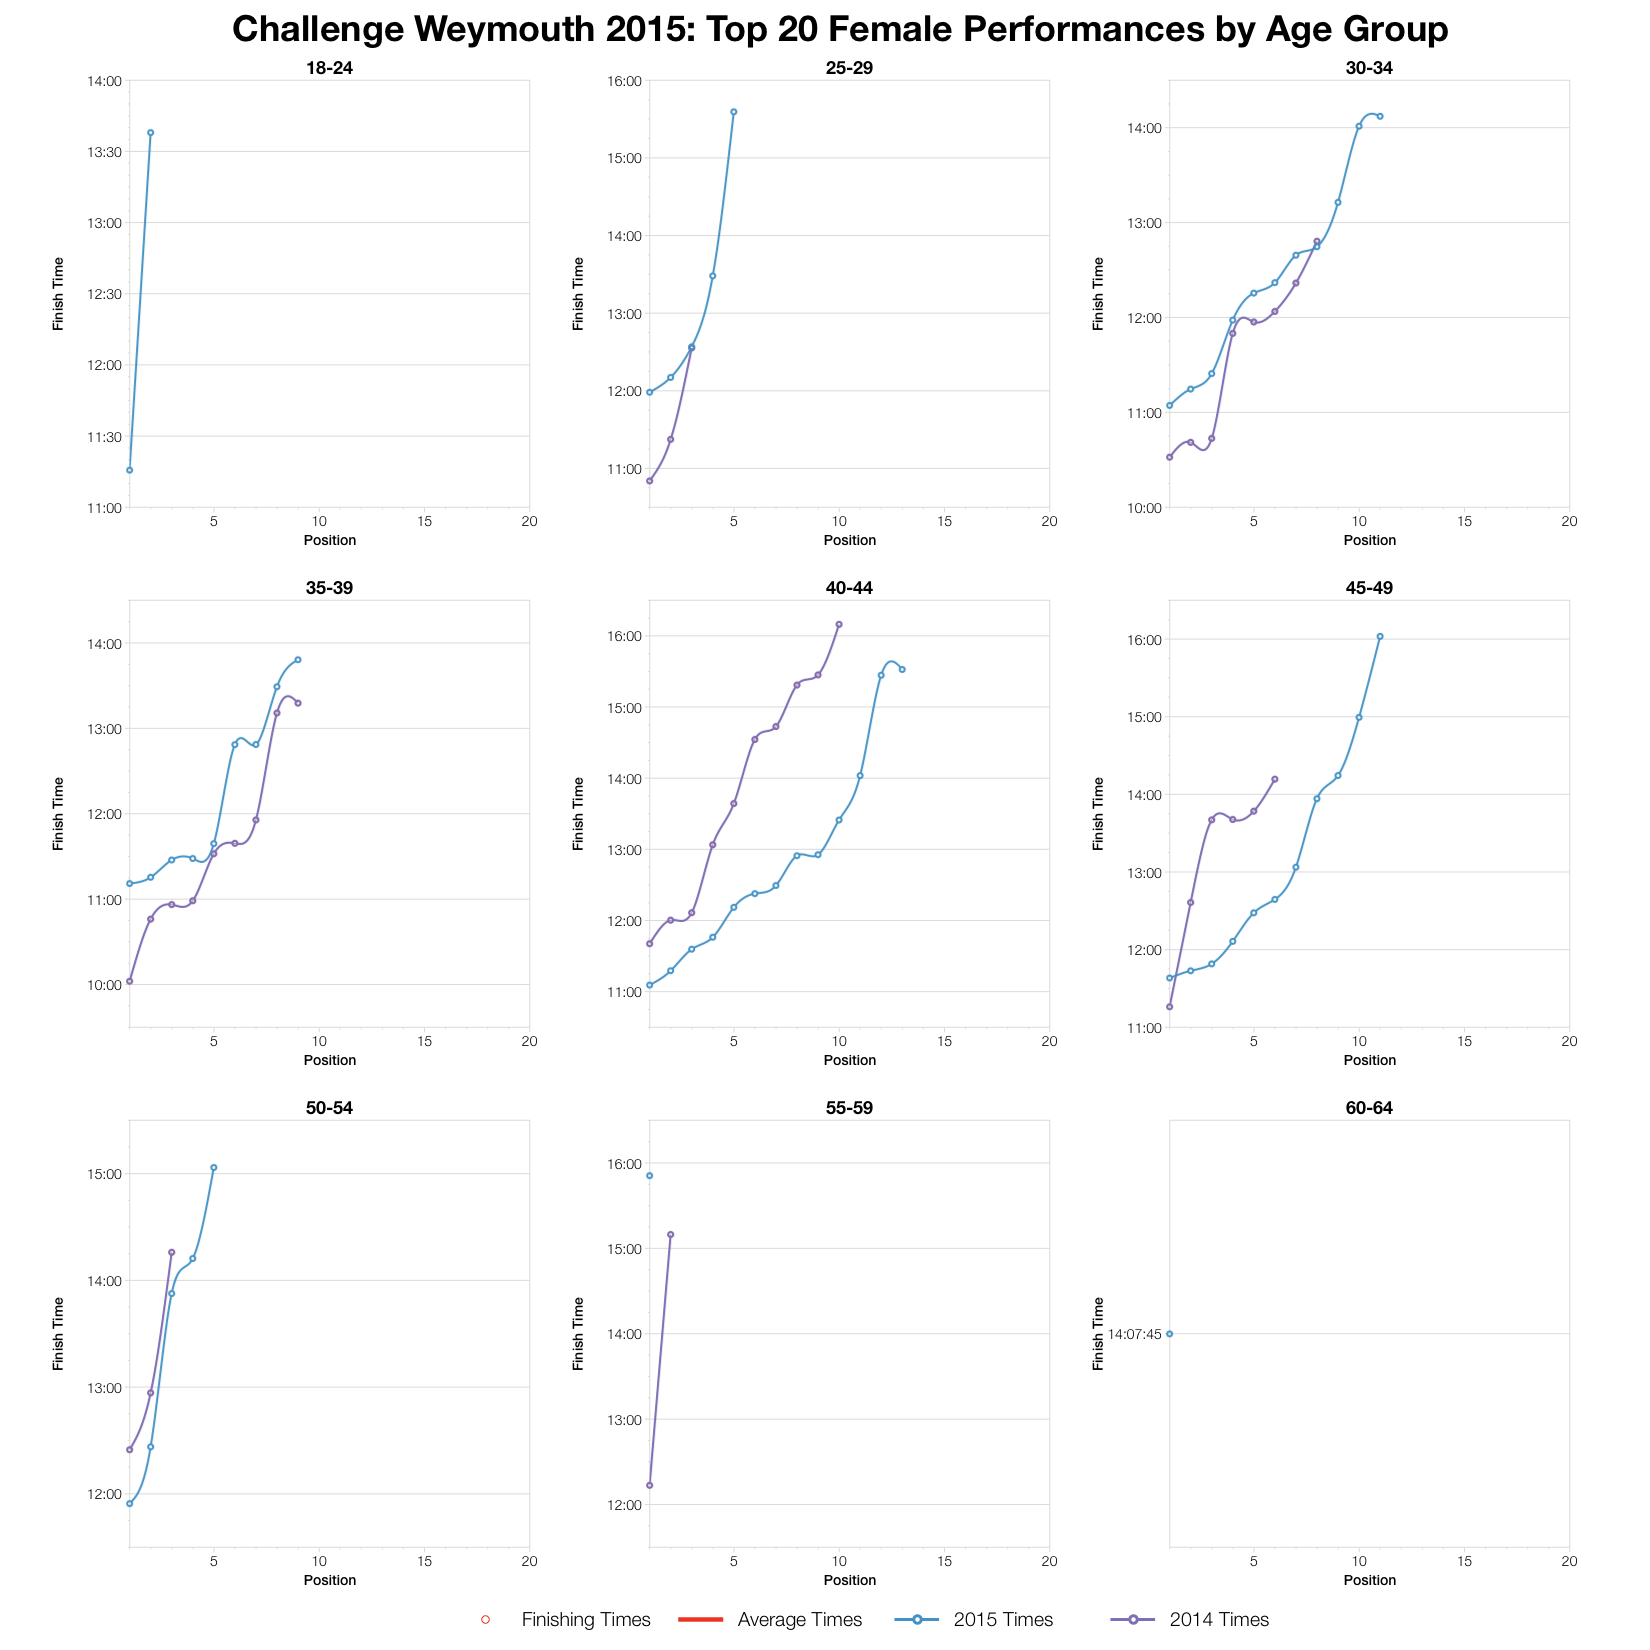
Finally the top twenty in each age group. As expected 2014 is the faster year, although it’s not as clear cut for the female age groups. Additional athletes signing up for the Ironman event will likely impact on these top 20 times. We’ll see by how much in my analysis on Monday.


