The second Ironman race of the weekend was a long standing event – Ironman Wisconsin. A race on a much bigger scale than Weymouth with well over 2,000 athletes on the start line. There were the normal 40 Kona slots on offer here and a standard distribution for them. This year’s race looks to have trended slightly slower than usual with a few more DNFs too.
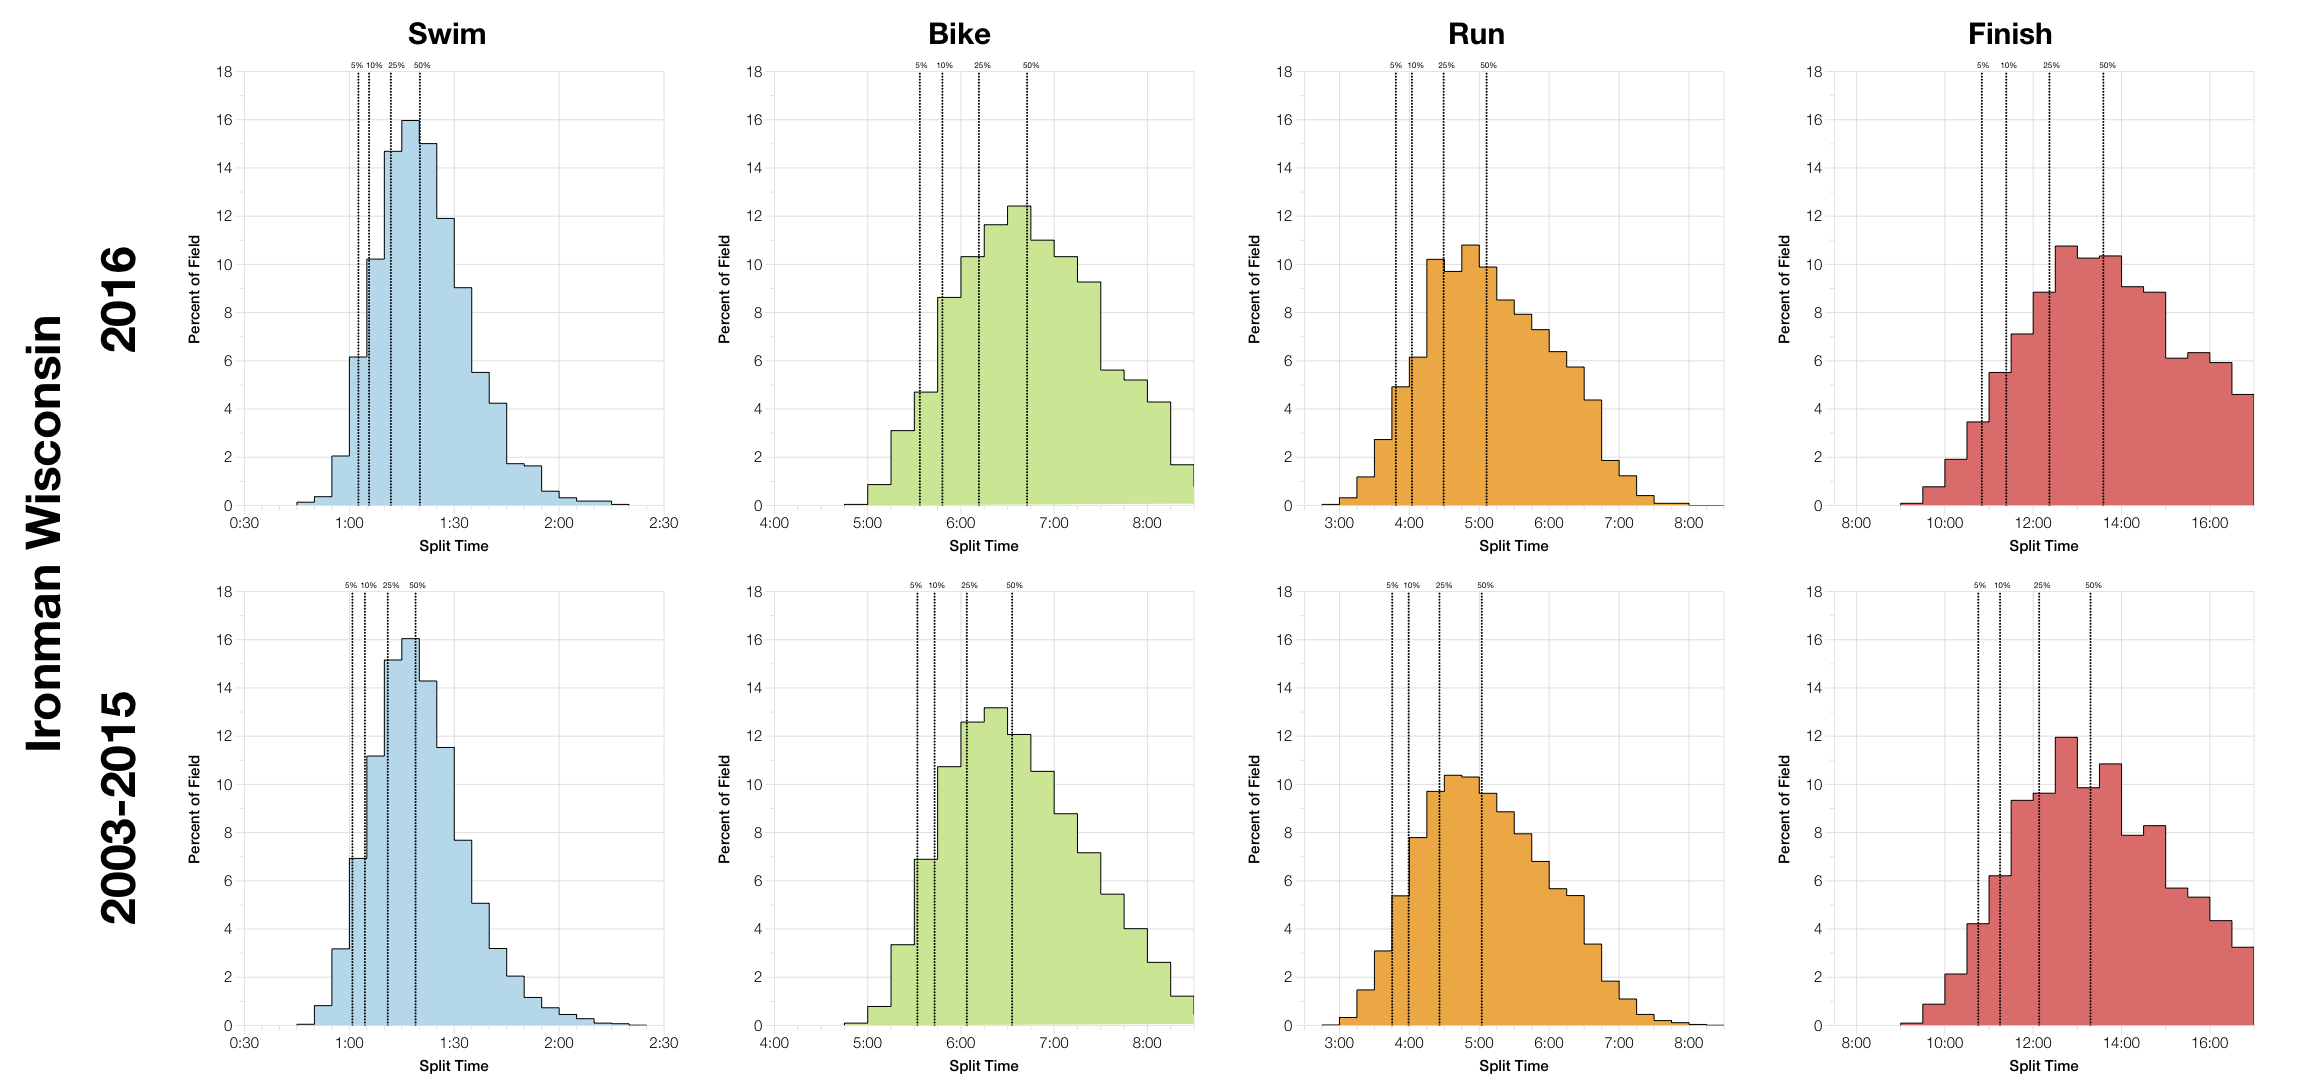
We can see this year’s race trends slower than the aggregated data from past races. It’s mostly on the bike where the differences come, but even so swim and run seem to be a little behind in 2016. This is still well within the bounds of racing at Wisconsin, a slower than average year, but not necessarily an exceptionally slow year.
| Listed Athletes | Swim Finish | Swim DNS/DNF | Bike Finish | Bike DNF | Run Finish | Run DNF | Overall DNS/DNF | |
|---|---|---|---|---|---|---|---|---|
| 2003 | 2012 | 1805 | 10.3% | 1705 | 5.5% | 1536 | 9.9% | 23.7% |
| 2004 | 2495 | 2139 | 14.3% | 2104 | 1.6% | 1973 | 6.2% | 20.9% |
| 2005 | 2245 | 2036 | 9.3% | 1873 | 8% | 1681 | 10.3% | 25.1% |
| 2006 | 2692 | 2415 | 10.3% | 2303 | 4.6% | 2172 | 5.7% | 19.3% |
| 2007 | 2472 | 2193 | 11.3% | 2161 | 1.5% | 2106 | 2.5% | 14.8% |
| 2008 | 2445 | 2206 | 9.8% | 2139 | 3% | 2082 | 2.7% | 14.8% |
| 2009 | 2699 | 2380 | 11.8% | 2307 | 3.1% | 2176 | 5.7% | 19.4% |
| 2010 | 2912 | 2522 | 13.4% | 2481 | 1.6% | 2397 | 3.4% | 17.7% |
| 2011 | 2797 | 2450 | 12.4% | 2362 | 3.6% | 2245 | 5% | 19.7% |
| 2012 | 2827 | 2449 | 13.4% | 2388 | 2.5% | 2337 | 2.1% | 17.3% |
| 2013 | 2543 | 2463 | 3.1% | 2390 | 3% | 2332 | 2.4% | 8.3% |
| 2014 | 2826 | 2478 | 12.3% | 2391 | 3.5% | 2320 | 3% | 17.9% |
| 2015 | 2990 | 2517 | 15.8% | 2433 | 3.3% | 2387 | 1.9% | 20.2% |
| 2016 | 2881 | 2395 | 16.9% | 2283 | 4.7% | 2206 | 3.4% | 23.4% |
What’s more noticeable is the upturn in DNF/DNS rates over previous years. 2016 saw one of the higher DNF/DNS rates for Wisconsin. One point to note – 2013 numbers appear to exclude DNS statistics, hence the much lower figures.
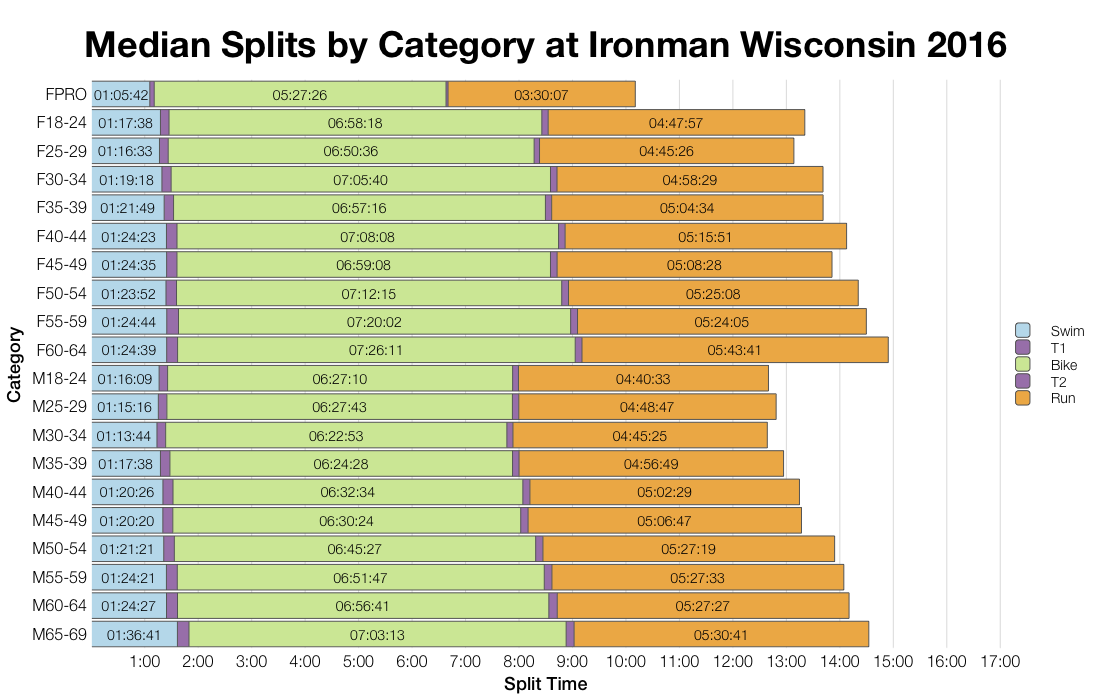
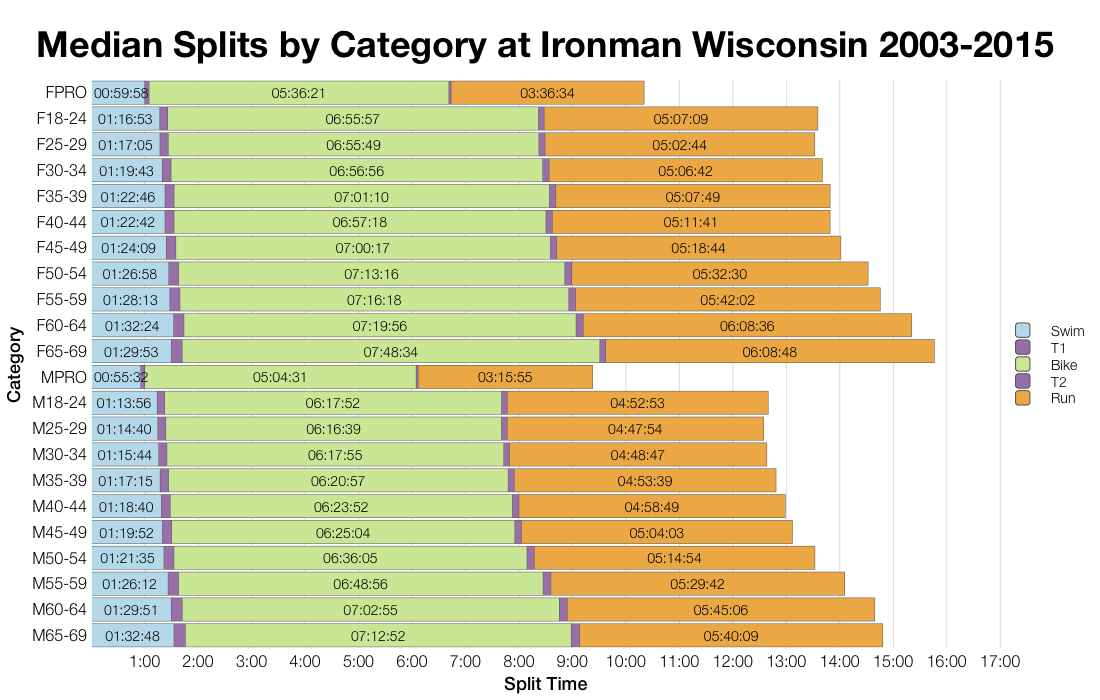
Comparing the medians splits for different age groups we can see that the difference does centre on the bike. Here the pattern is quite consistent – 2016 is slower. In swim and run there’s less of a trend and some age groups come out on the faster side of the medians.
| Count | Percentage | |
|---|---|---|
| United States | 2725 | 94.6 |
| Canada | 44 | 1.5 |
| United Kingdom | 16 | 0.6 |
| Mexico | 15 | 0.5 |
| Germany | 8 | 0.3 |
| Philippines | 7 | 0.2 |
| France | 5 | 0.2 |
| Colombia | 4 | 0.1 |
| Japan | 4 | 0.1 |
| Netherlands | 3 | 0.1 |
Wisconsin is a very clear American race with the a very low percentage of athletes coming from outside the US or Canada.
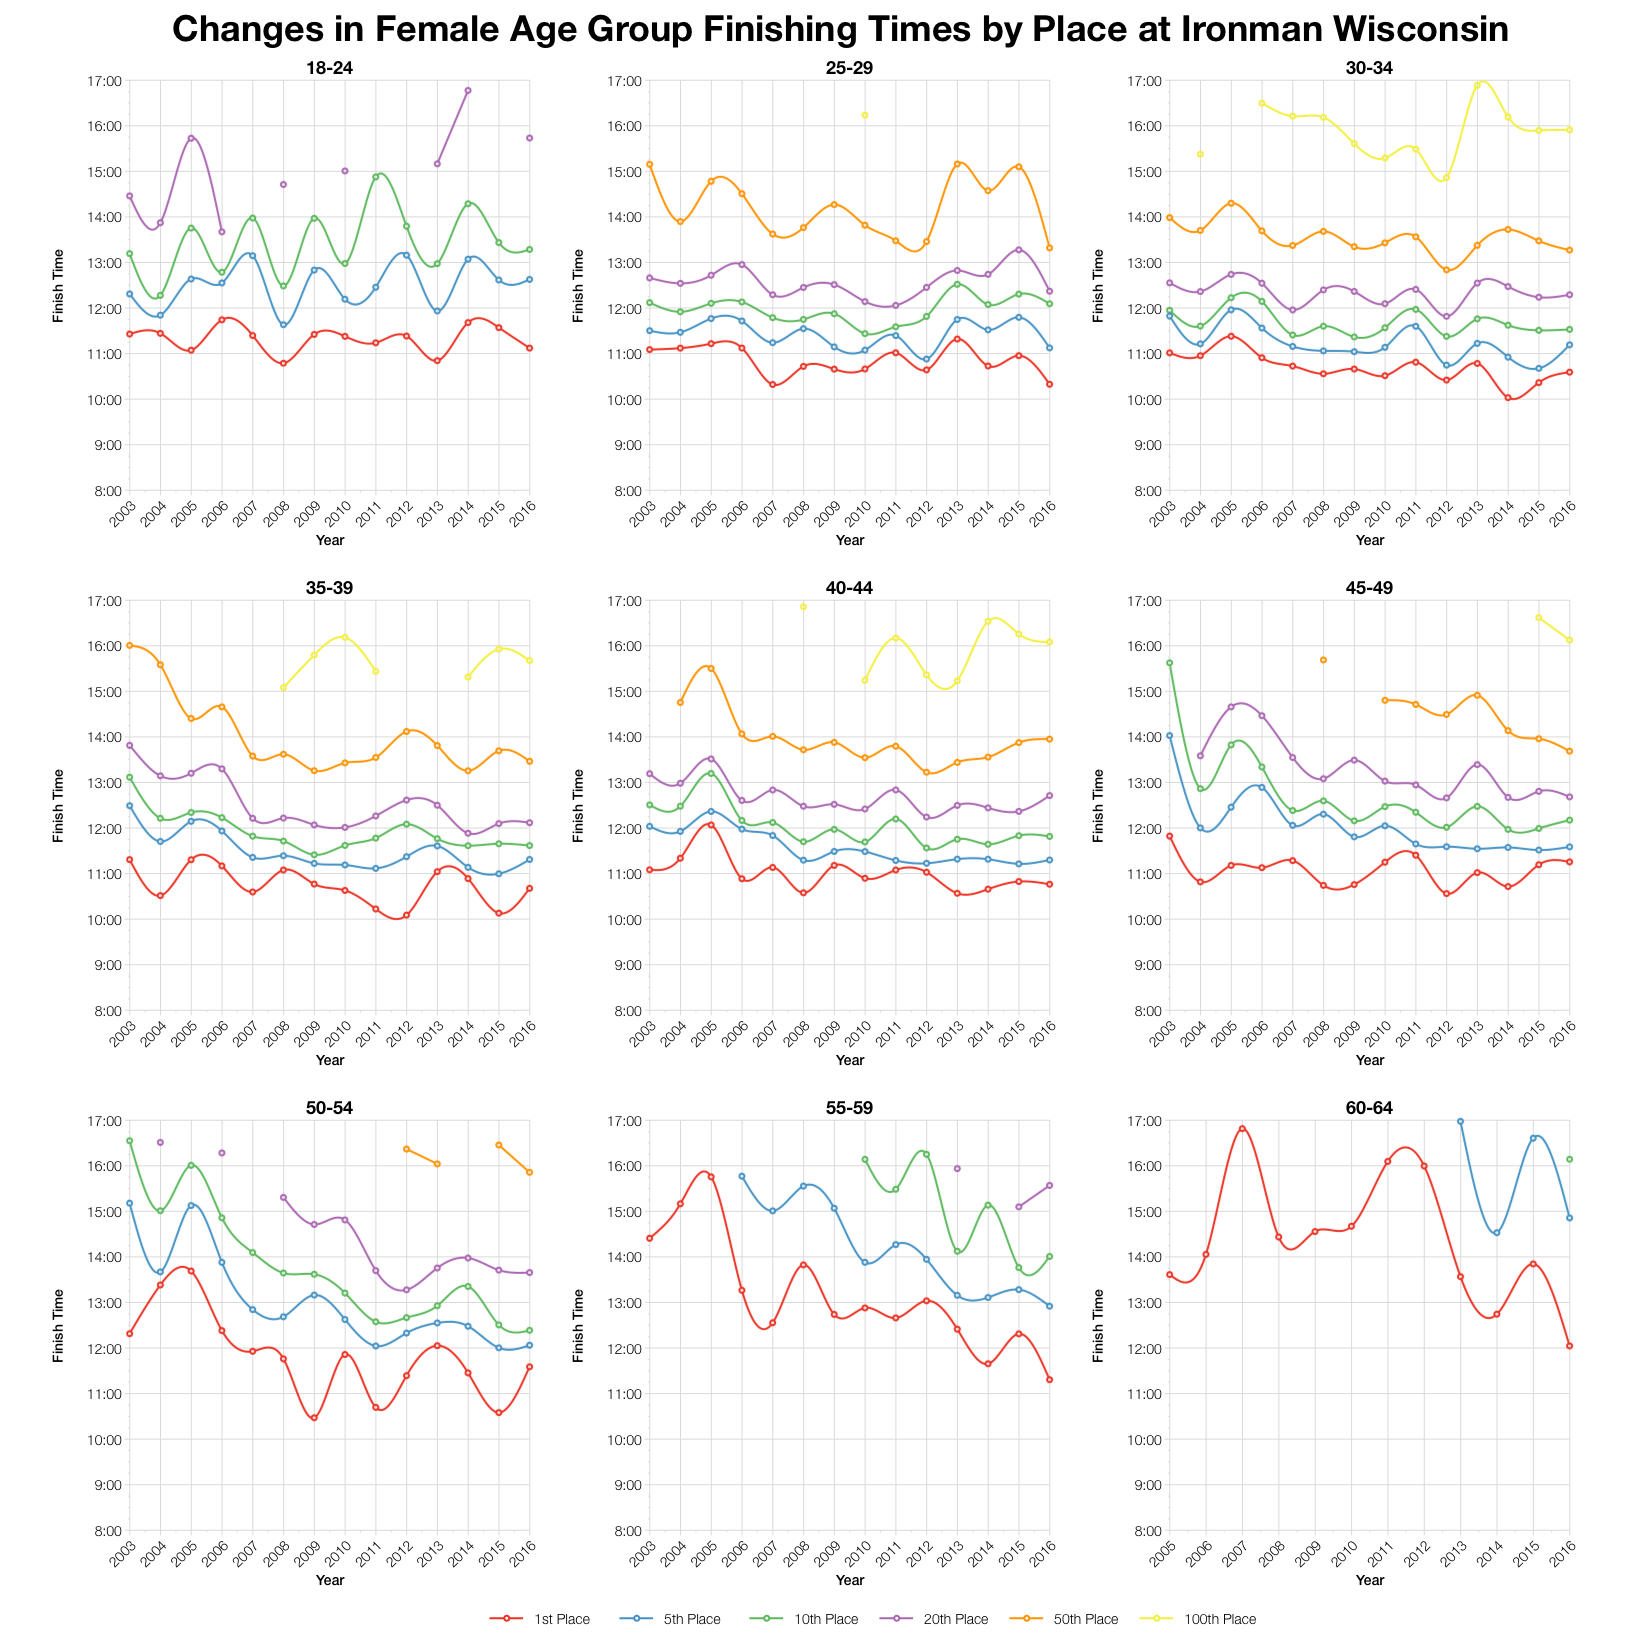
This year’s race is by no means the slowest seen in Wisconsin, but it does point towards the slower end of the spectrum for many age groups. There are divisions and places that sped up in this year, but for the most part it’s a downturn over the previous couple of years.
| Slots | Winner | Average Kona Qualifier | Final Qualifier | |
|---|---|---|---|---|
| M18-24 | 1 | 10:36:45 | 10:36:45 | 10:36:45 |
| M25-29 | 2 | 9:14:52 | 9:23:09 | 9:31:27 |
| M30-34 | 3 | 9:07:43 | 9:29:59 | 9:41:15 |
| M35-39 | 3 | 9:36:24 | 9:40:37 | 9:43:21 |
| M40-44 | 3 | 9:51:24 | 9:58:13 | 10:02:09 |
| M45-49 | 3 | 9:56:38 | 10:04:56 | 10:10:51 |
| M50-54 | 3 | 9:33:16 | 10:15:16 | 10:43:34 |
| M55-59 | 2 | 10:43:12 | 10:47:56 | 10:52:41 |
| M60-64 | 2 | 12:00:58 | 12:10:18 | 12:19:39 |
| M65-69 | 1 | 12:56:15 | 12:56:15 | 12:56:15 |
| M70-74 | 1 | 13:46:19 | 13:46:19 | 13:46:19 |
| F18-24 | 1 | 11:07:25 | 11:07:25 | 11:07:25 |
| F25-29 | 2 | 10:19:47 | 10:29:34 | 10:39:21 |
| F30-34 | 2 | 10:35:44 | 10:47:44 | 10:59:45 |
| F35-39 | 2 | 10:40:46 | 10:52:02 | 11:03:19 |
| F40-44 | 2 | 10:46:09 | 10:55:14 | 11:04:20 |
| F45-49 | 2 | 11:15:34 | 11:17:35 | 11:19:37 |
| F50-54 | 2 | 11:35:28 | 11:39:29 | 11:43:30 |
| F55-59 | 1 | 11:18:28 | 11:18:28 | 11:18:28 |
| F60-64 | 1 | 12:02:56 | 12:02:56 | 12:02:56 |
Based on the athlete tracker I’ve predicted the number of Kona slots that will be assigned to each age group (actual numbers depend on the exact start numbers). From there I can determine the automatic qualifying times in each age group, the times that are guaranteed a place without roll down. You can compare these figures with other races on my Kona qualification page.
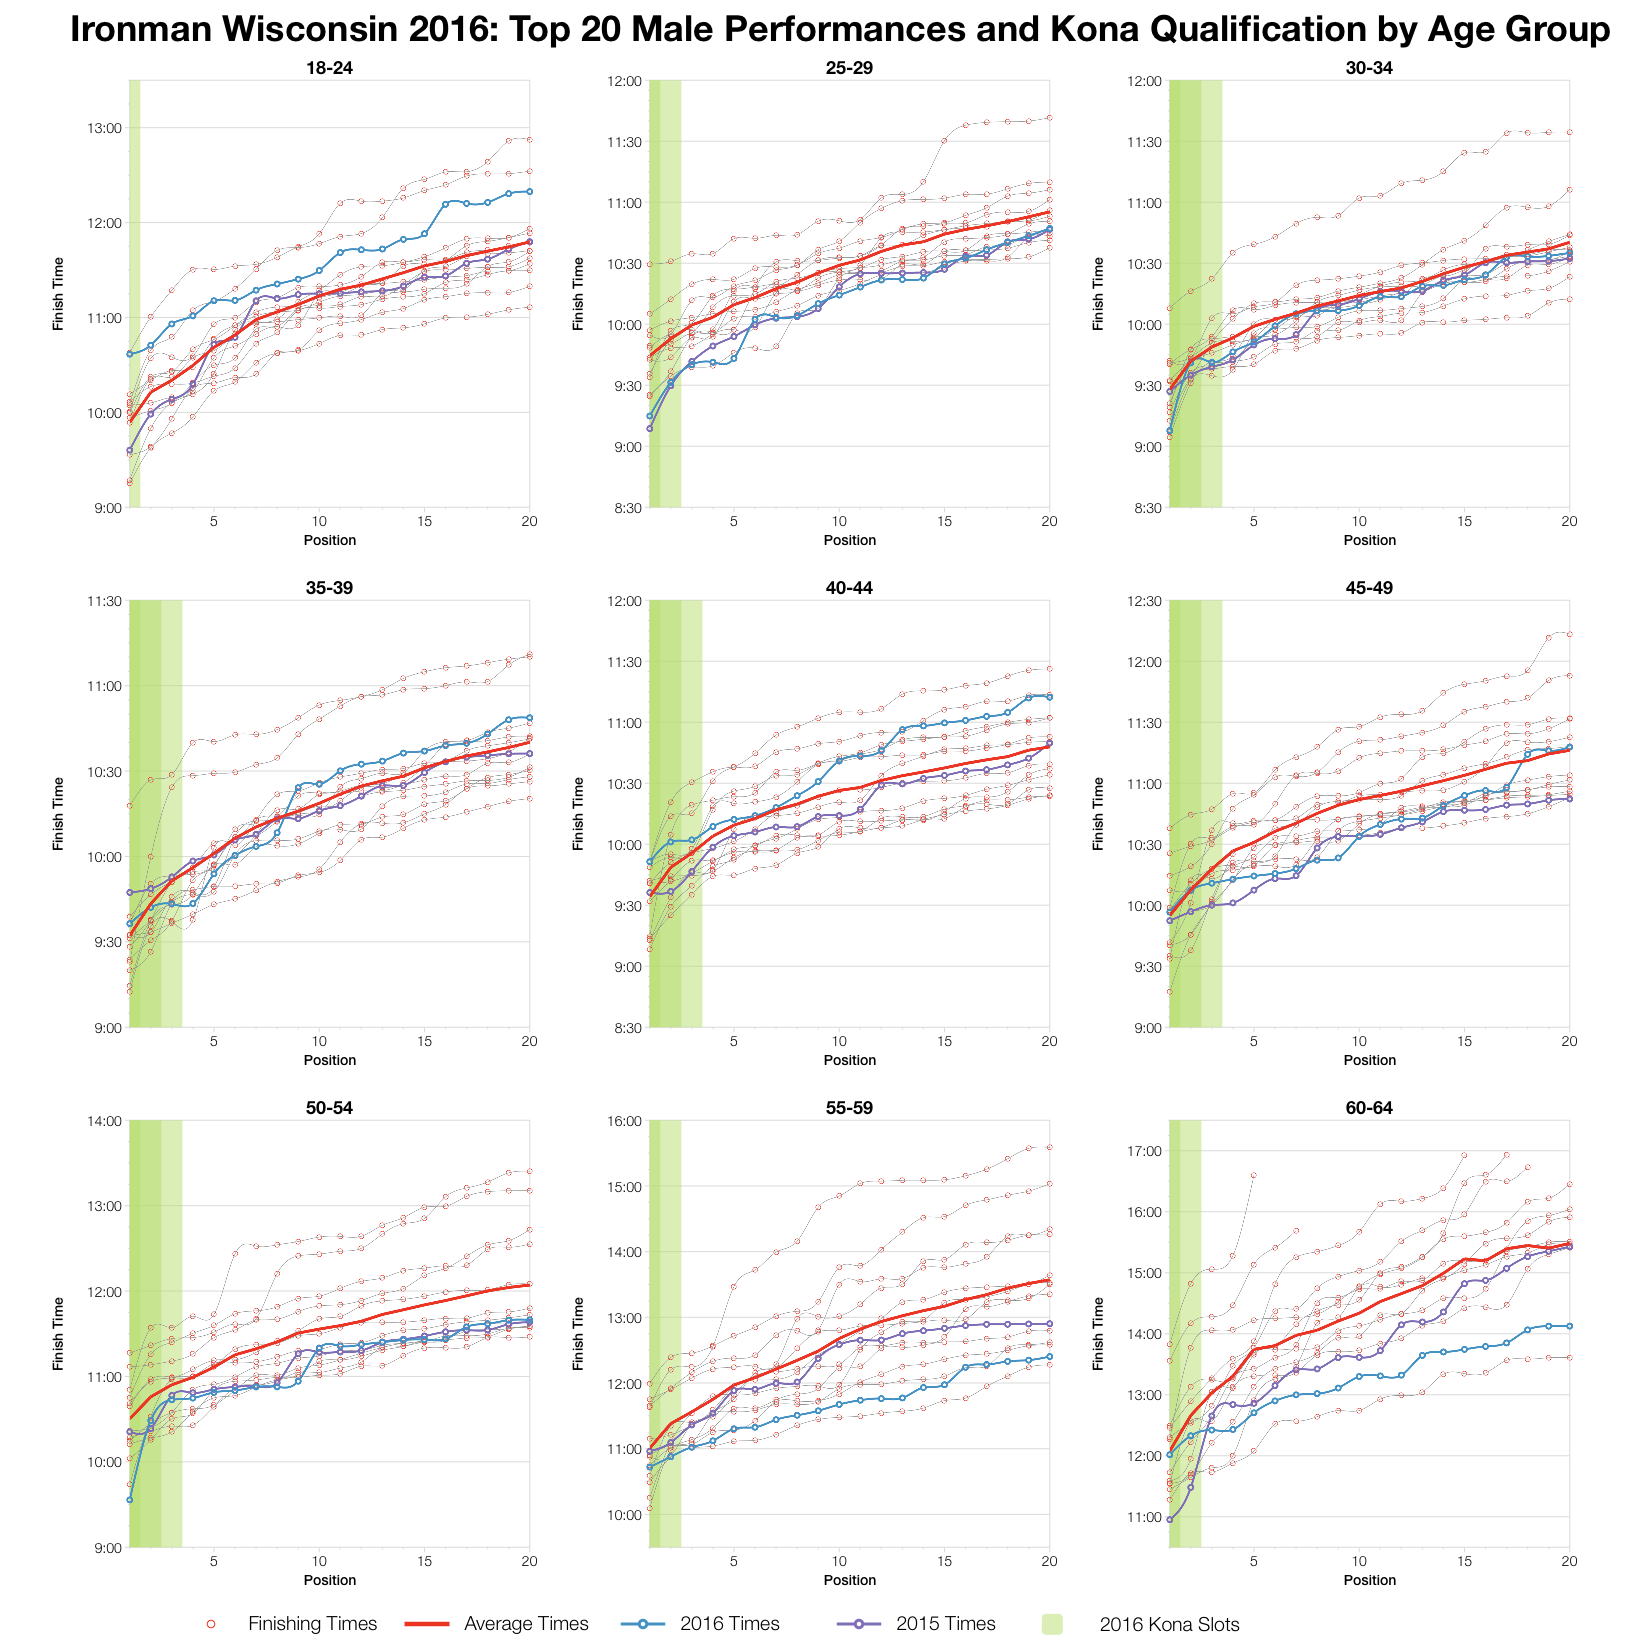
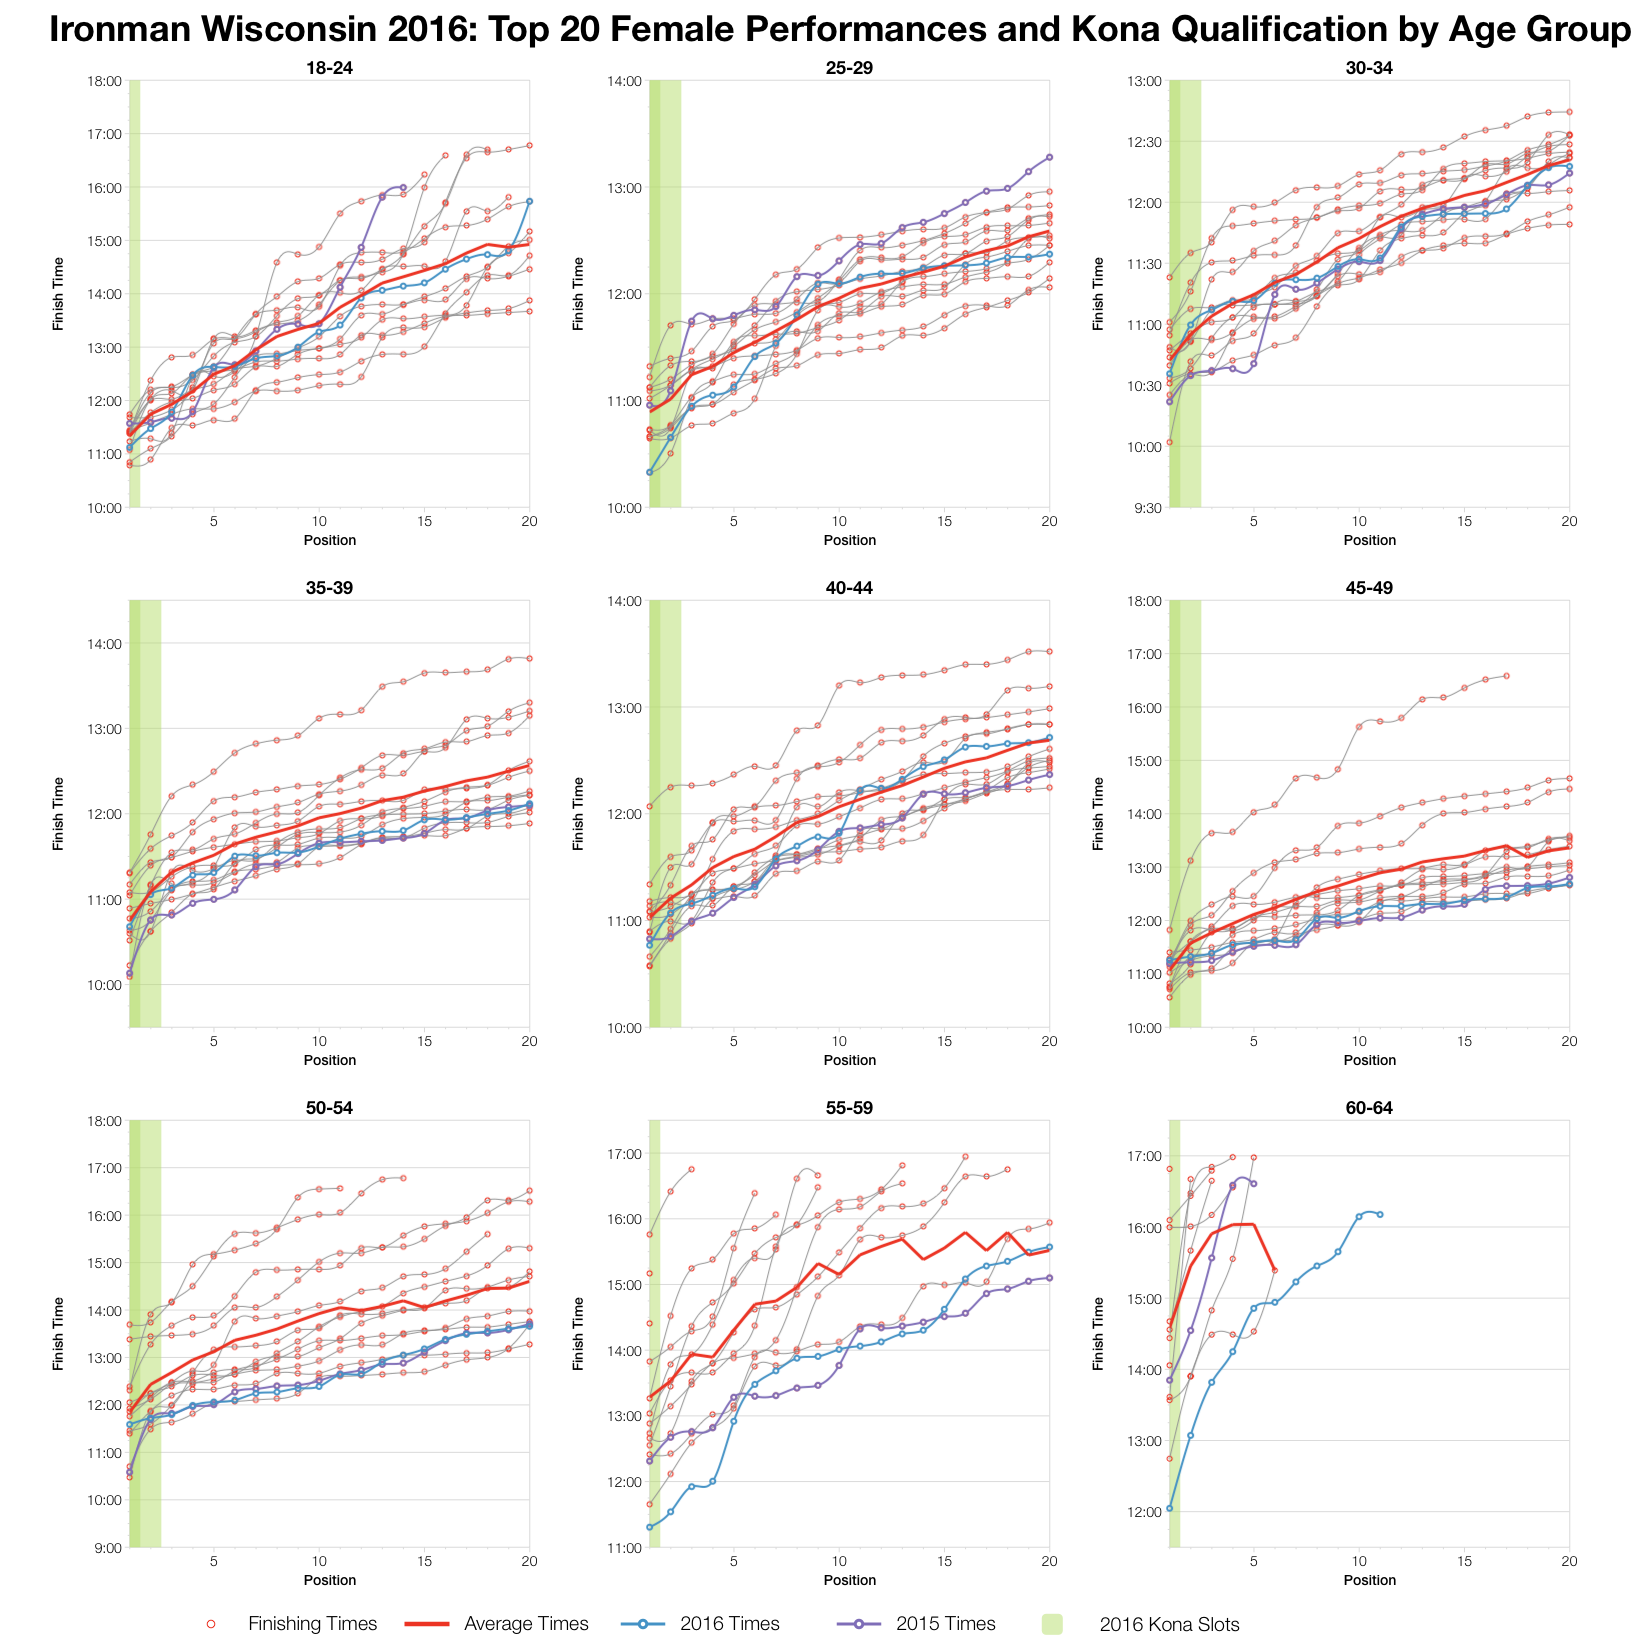
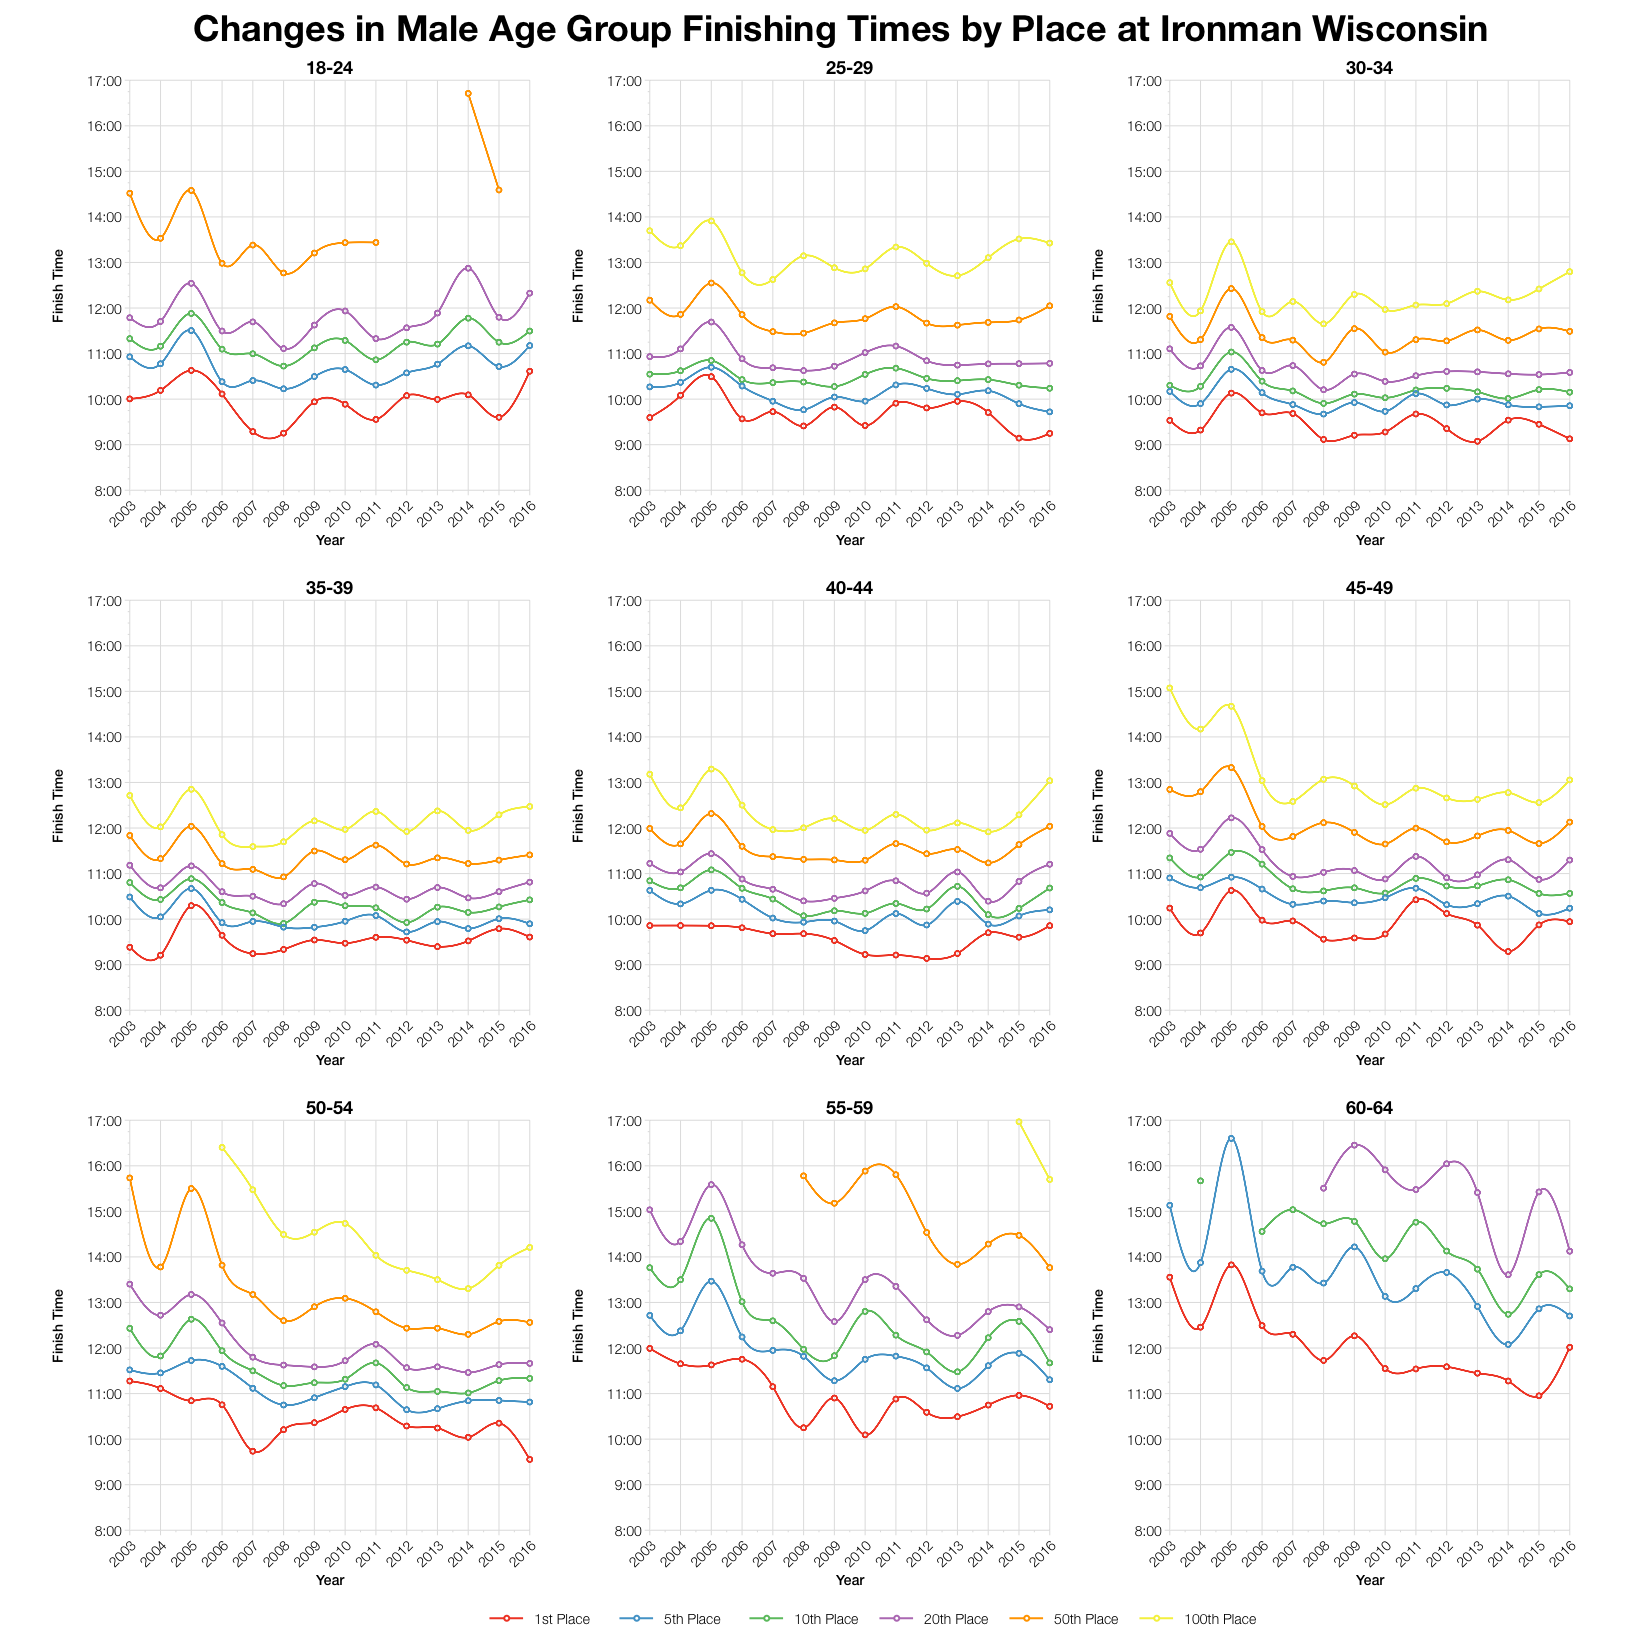
For the top twenty in each age group the trend is less clear. While a few age divisions have results behind the average, as many or more have results that are average or better. If anything I’d say the front end of the race was as fast as ever and very competitive. For the women this is definitely the case and the race appears to have been quicker than usual. It’s in some of the tiger male age groups where we see the slower than average times.
So, Ironman Wisconsin 2016 was probably a little slower for the majority of athletes. However, this wasn’t universal and the front of the age group race, the competition for Kona slots was as fast as ever (perhaps a little faster).
You can access a spreadsheet of the full results and splits from Ironman Wisconsin 2016 on my Google Drive.


