Ironman Wales is the last of this year’s UK races and our second qualifier for Kona 2017. Wales has a deserved reputation as one of the toughest Ironman courses, up there with the likes of Lanzarote. Conditions on the day can have a big impact on times, although this year’s race looks to have been fairly benign. The standard 40 Kona slots were on offer to the competitive field – besides being a tough course, Wales is not an easy qualifier.
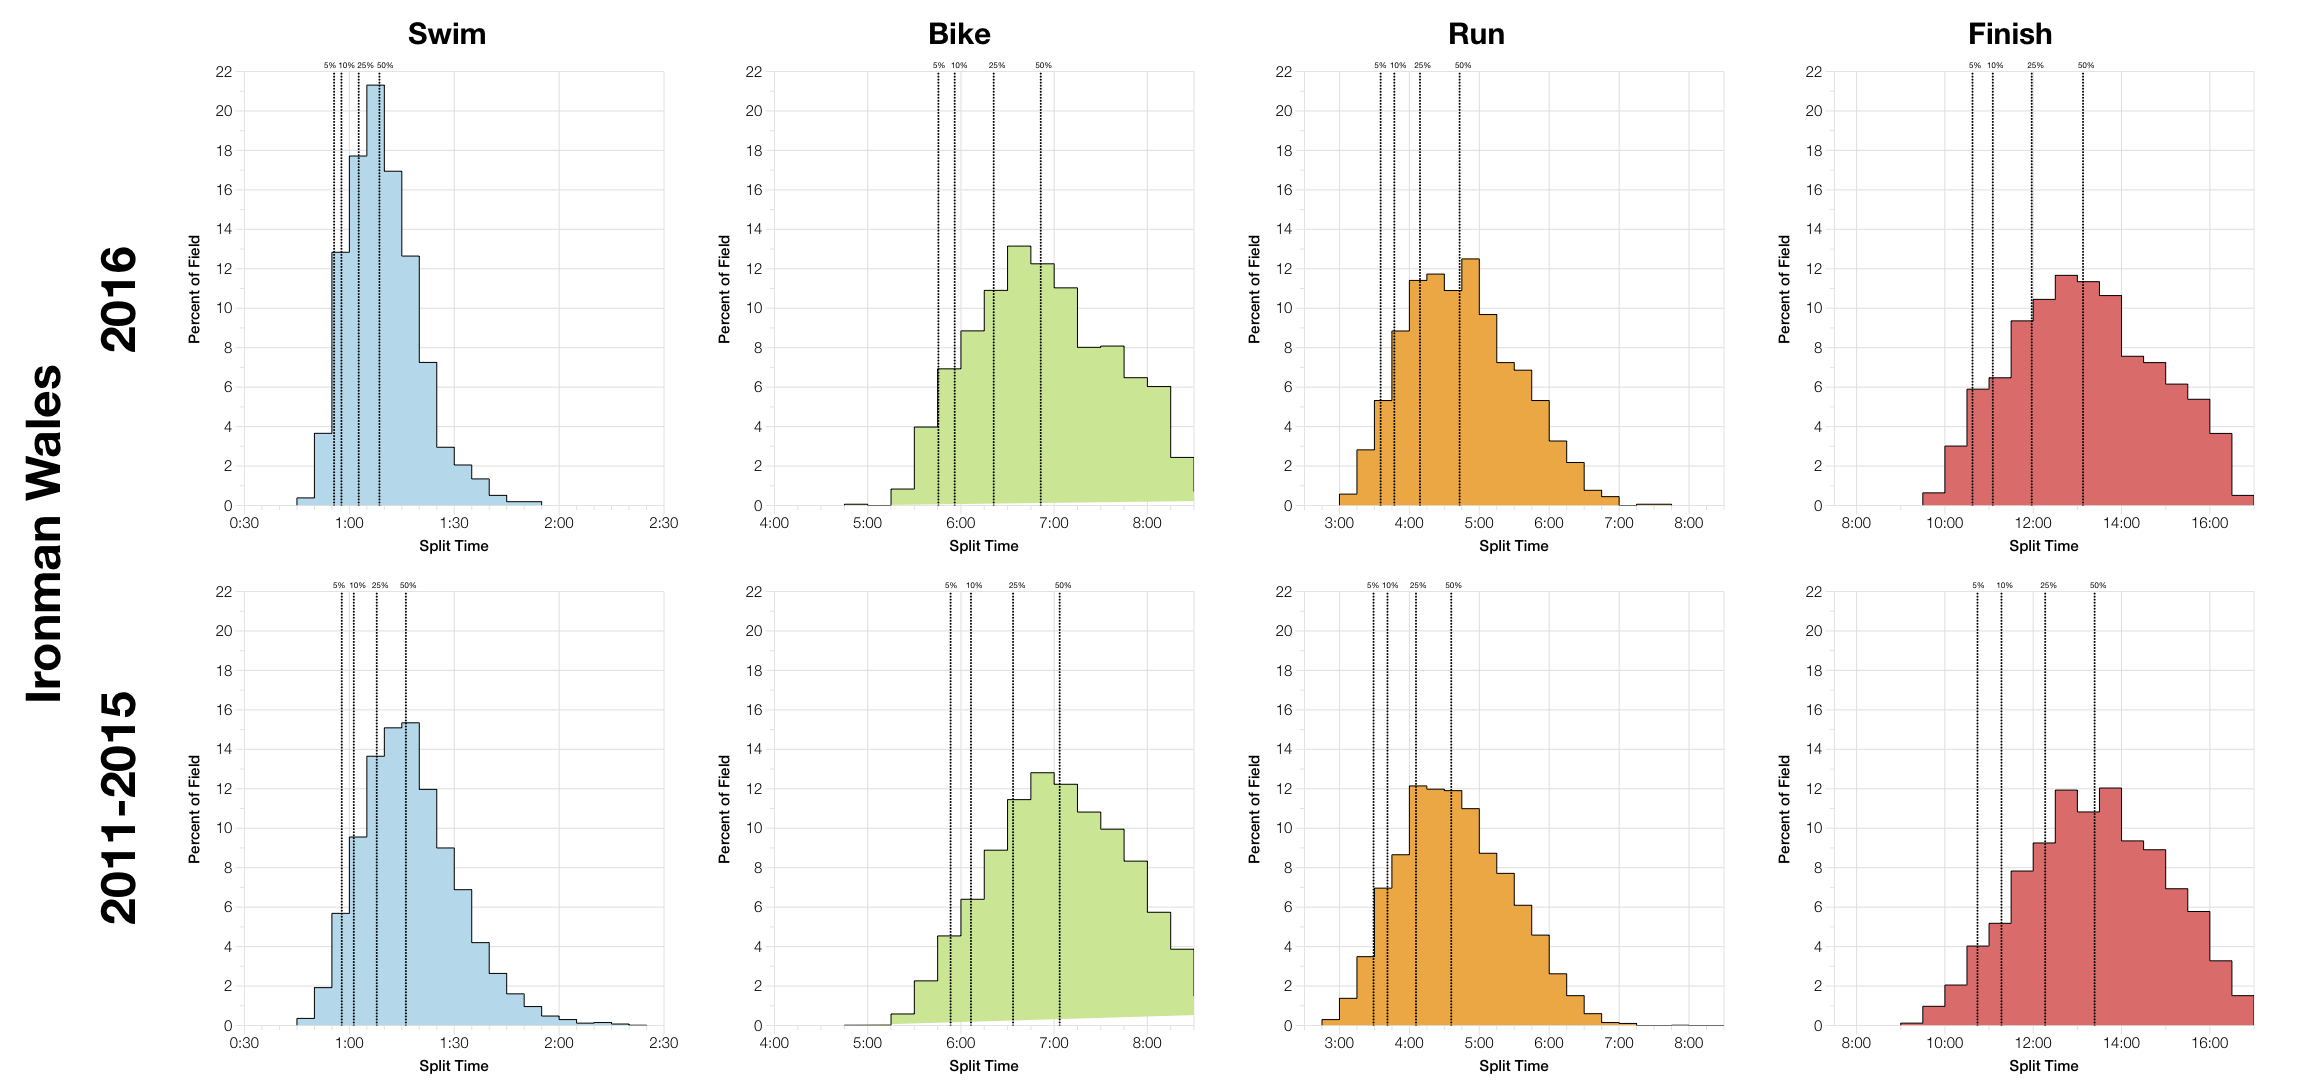
Both swim and bike times at this year’s race trend much faster than the aggregated course times. That would certainly support mild racing conditions without the high winds or strong currents some years have seen. Interestingly we do see a drop in run times, but this may be attributed to changes in the run course. On balance though, 2016 was a slightly faster year in Tenby.
| Listed Athletes | Swim Finish | Swim DNS/DNF | Bike Finish | Bike DNF | Run Finish | Run DNF | Overall DNS/DNF | |
|---|---|---|---|---|---|---|---|---|
| 2011 | 1508 | 1266 | 16% | 1198 | 5.4% | 1122 | 6.3% | 25.6% |
| 2012 | 1320 | 1312 | 0.6% | 1296 | 1.2% | 1215 | 6.3% | 8% |
| 2013 | 1677 | 1432 | 14.6% | 1370 | 4.3% | 1280 | 6.6% | 23.7% |
| 2014 | 2085 | 1774 | 14.9% | 1707 | 3.8% | 1612 | 5.6% | 22.7% |
| 2015 | 2030 | 1728 | 14.9% | 1664 | 3.7% | 1551 | 6.8% | 23.5% |
| 2016 | 1915 | 1677 | 12.4% | 1618 | 3.5% | 1575 | 2.7% | 17.8% |
The DNF/DNS rate are possibly the lowest seen. The listing method was slightly different in 2012, excluding DNS numbers while all the other years include them, so we can’t make a perfect comparison. We can say for certain that this is the lowest combined rate of DNS/DNF seen by quite a large margin. Given the fast swim times I’d anticipate that the swim DNF rate would be similar to 2012 so chances are the overall DNF rate would be the lowest. The major difference seems to be a greater completion rate on the run – perhaps the better/faster conditions earlier in the day helped, or the new course ensured more finished.
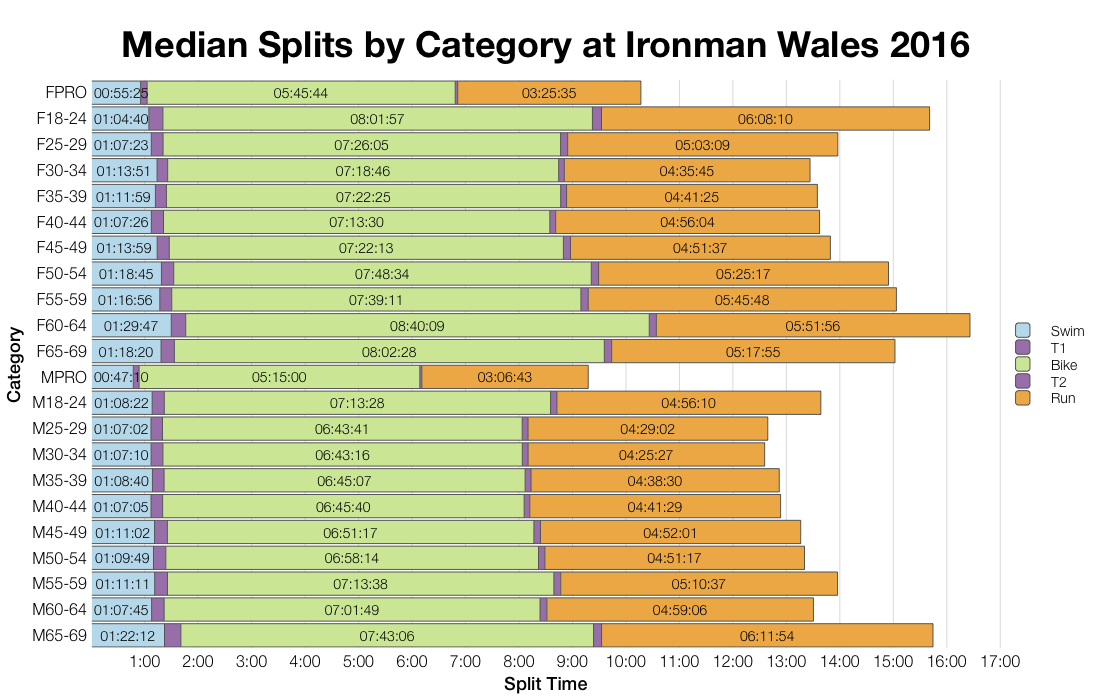
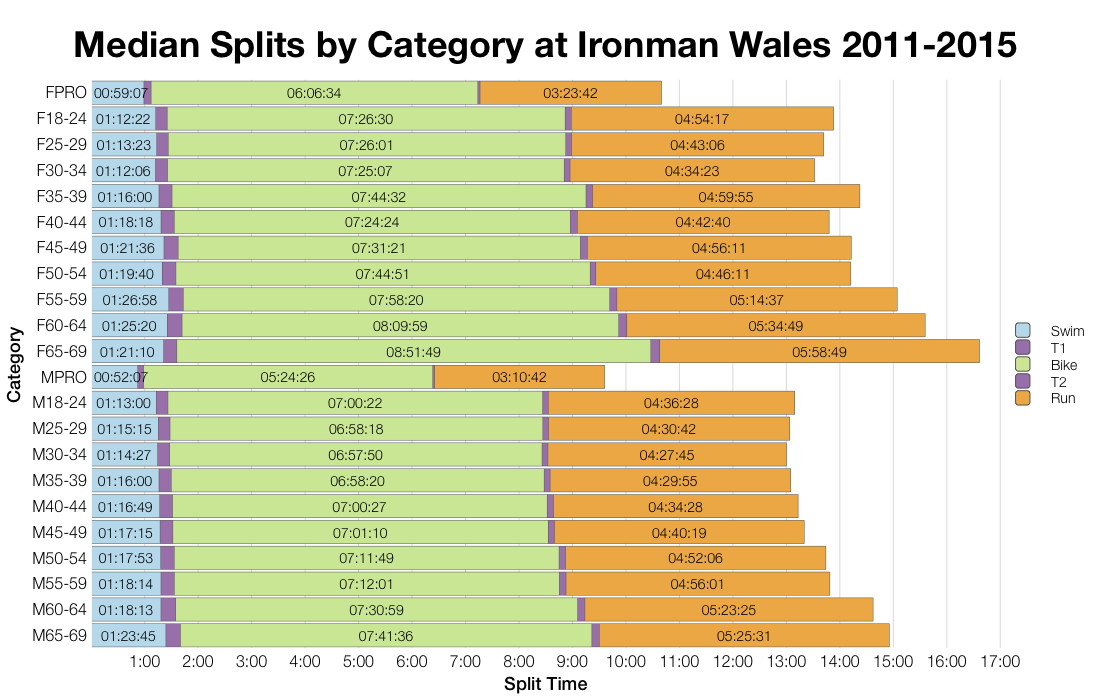
By and large the age group medians follow the same pattern as the distributions. We see that swim times are faster and so too are bike times. It’s less consistent, especially within the smaller age groups, but the broad trend remains. Run times show a slightly more consistent change towards slower times.
| Count | Percentage | |
|---|---|---|
| United Kingdom | 1611 | 84.1 |
| Ireland | 66 | 3.4 |
| Germany | 53 | 2.8 |
| France | 23 | 1.2 |
| United States | 15 | 0.8 |
| South Africa | 14 | 0.7 |
| Spain | 14 | 0.7 |
| Switzerland | 13 | 0.7 |
| Belgium | 12 | 0.6 |
| Australia | 10 | 0.5 |
As expected, the vast majority of the field come from the UK. After that Ireland takes the second spot with the remainder of places fairly evenly spread.
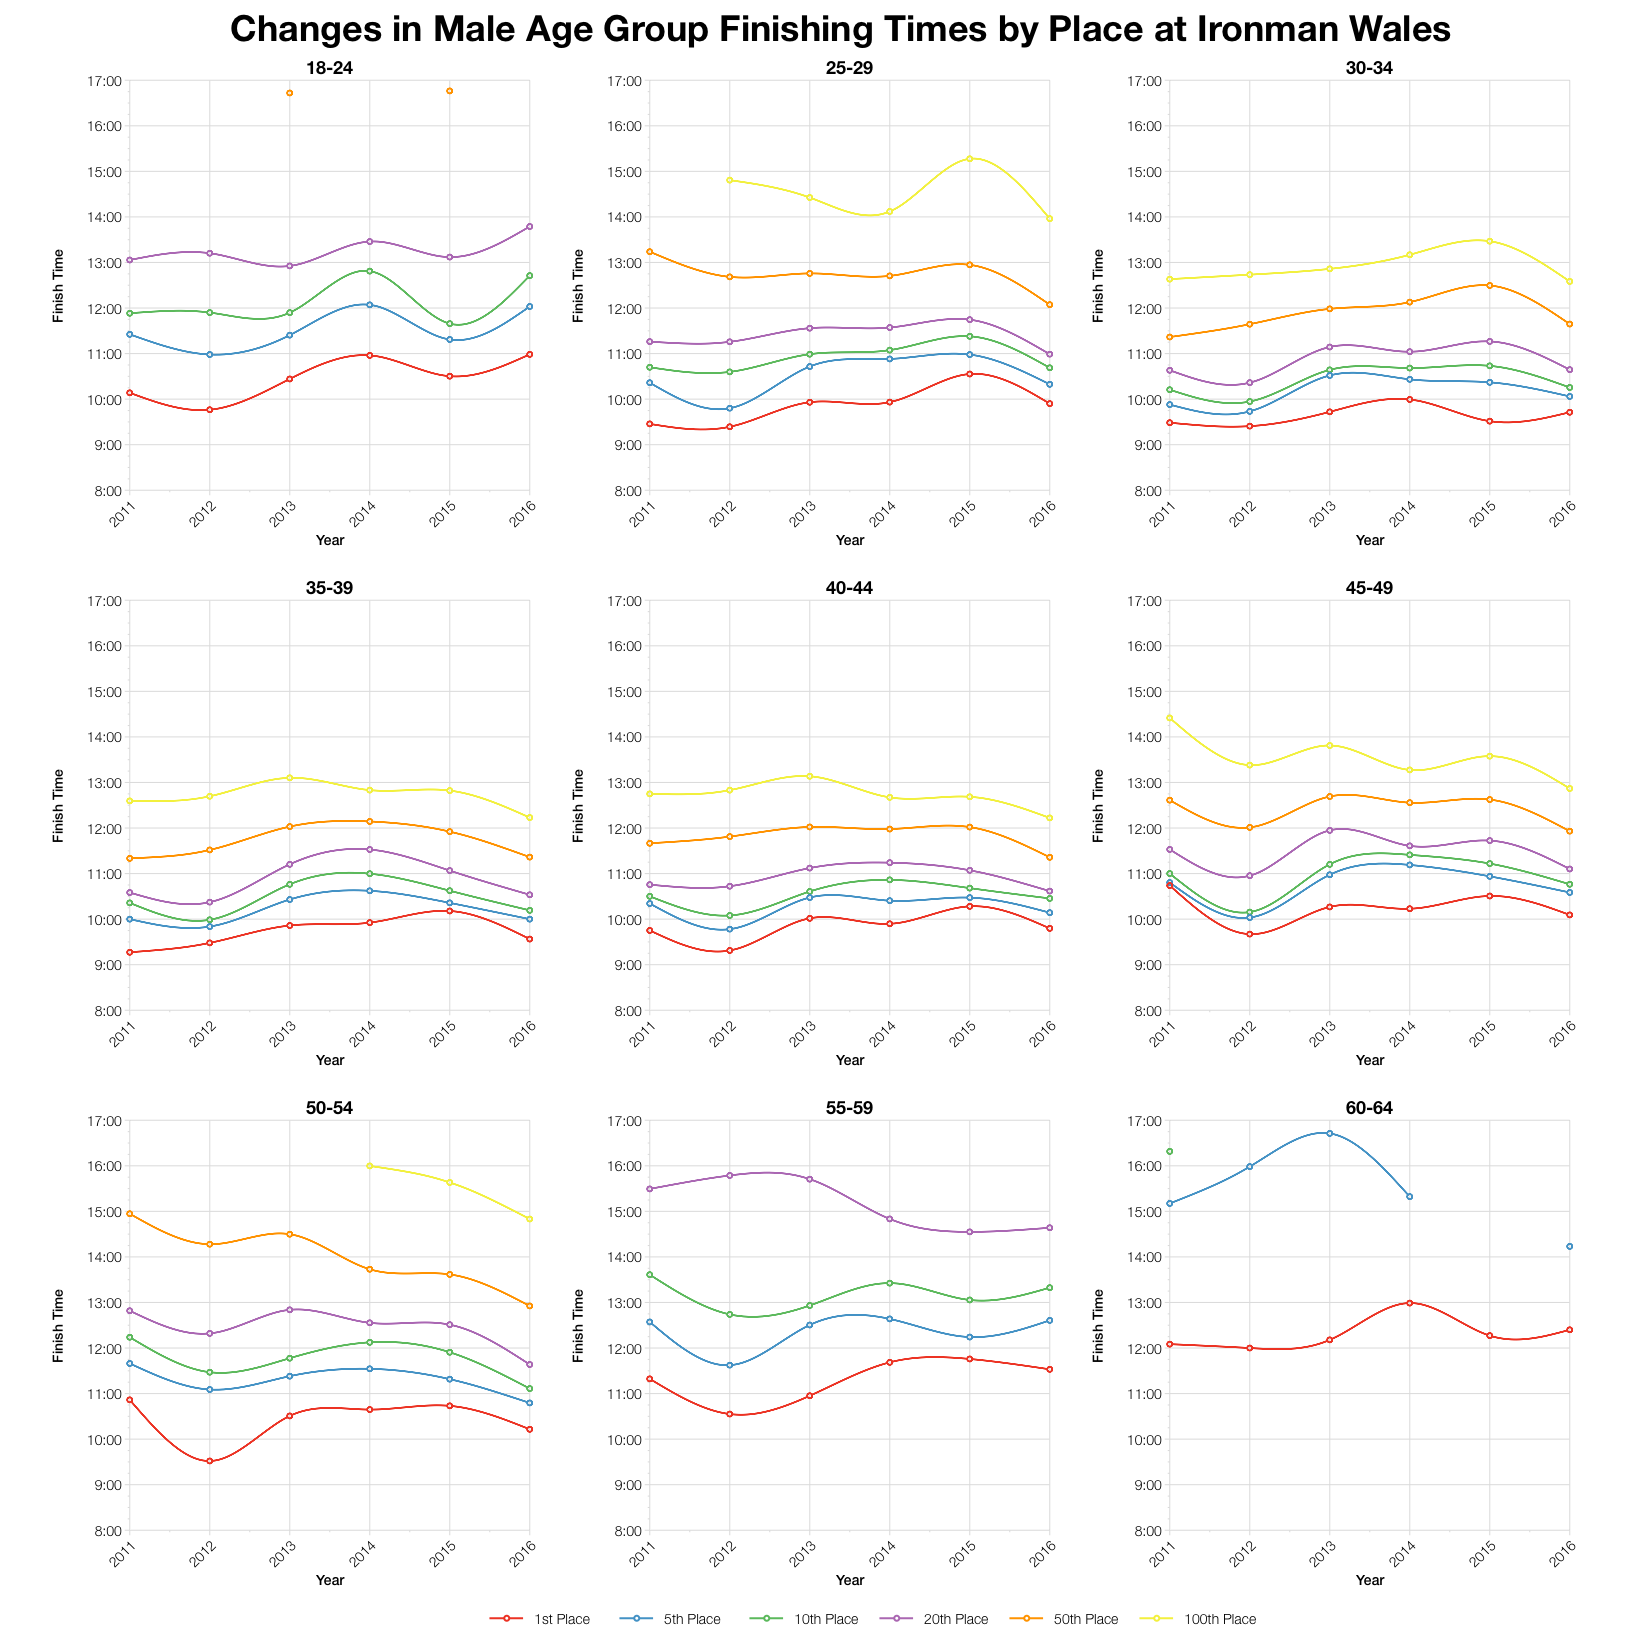
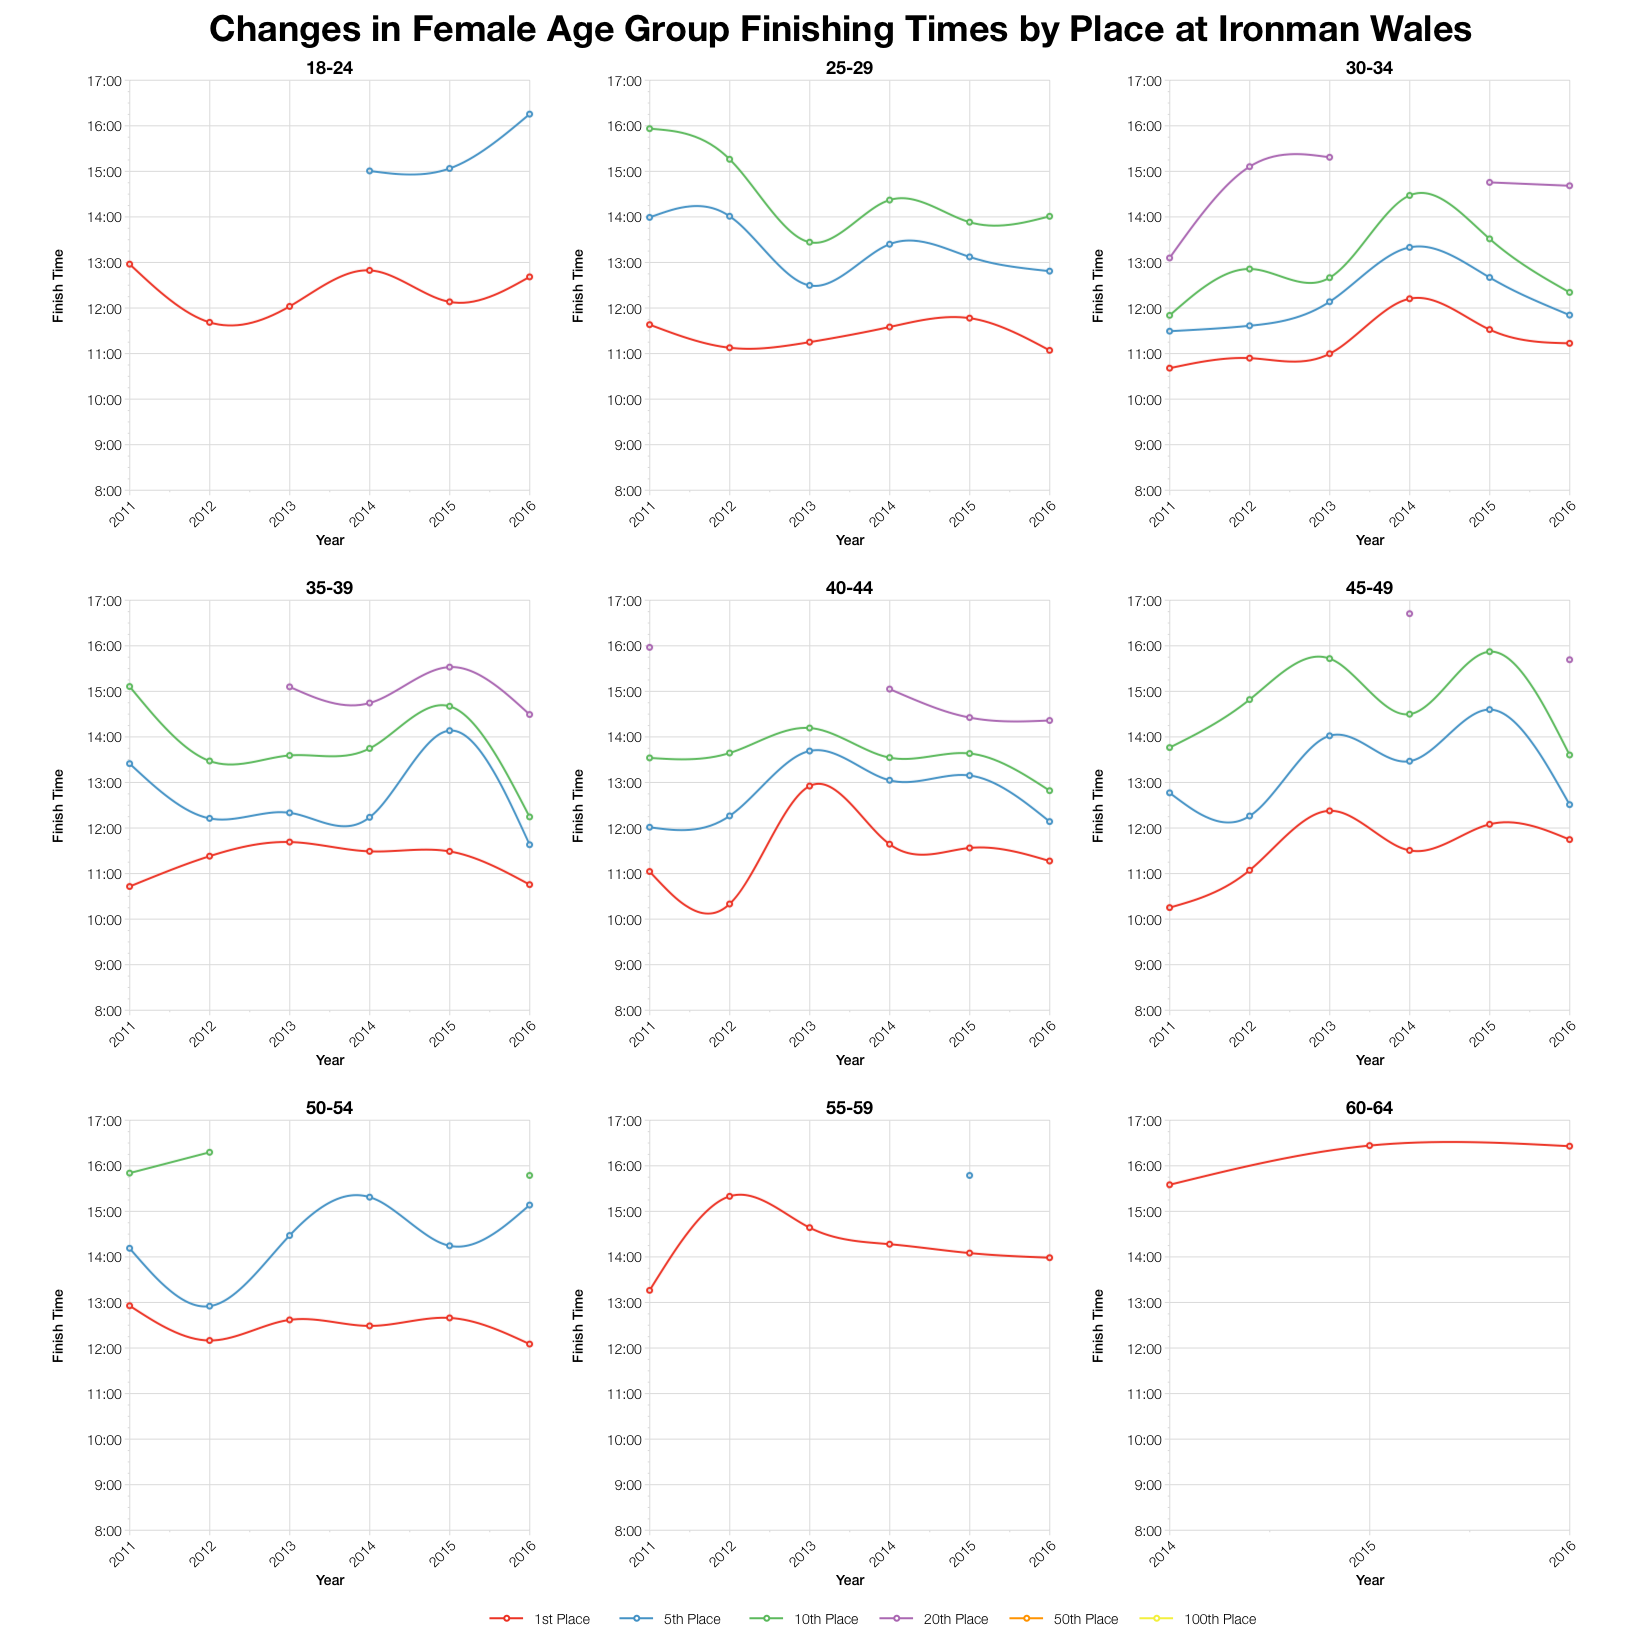
Tracking finishing times for different age group positions we generally see an increase in speed over the previous couple of years. Conditions in Tenby have varied quite a lot and have a big impact on the results. This year appears to have been better than the last two, but by no means the fastest. Of course we also have to bear in mind that 2012 had a shorter marathon which helps it come out on top.
| Slots | Winner | Average Kona Qualifier | Final Qualifier | |
|---|---|---|---|---|
| M18-24 | 2 | 10:58:58 | 11:13:38 | 11:28:19 |
| M25-29 | 3 | 9:54:05 | 10:02:17 | 10:06:41 |
| M30-34 | 4 | 9:42:45 | 9:49:13 | 9:57:04 |
| M35-39 | 5 | 9:33:46 | 9:50:54 | 10:00:00 |
| M40-44 | 5 | 9:47:50 | 10:02:16 | 10:08:30 |
| M45-49 | 4 | 10:05:33 | 10:26:06 | 10:34:45 |
| M50-54 | 3 | 10:12:59 | 10:19:35 | 10:27:47 |
| M55-59 | 1 | 11:31:58 | 11:31:58 | 11:31:58 |
| M60-64 | 1 | 12:24:00 | 12:24:00 | 12:24:00 |
| M65-69 | 1 | 15:36:05 | 15:36:05 | 15:36:05 |
| F18-24 | 1 | 12:41:14 | 12:41:14 | 12:41:14 |
| F25-29 | 1 | 11:04:26 | 11:04:26 | 11:04:26 |
| F30-34 | 1 | 11:13:43 | 11:13:43 | 11:13:43 |
| F35-39 | 1 | 10:45:41 | 10:45:41 | 10:45:41 |
| F40-44 | 1 | 11:16:46 | 11:16:46 | 11:16:46 |
| F45-49 | 1 | 11:44:59 | 11:44:59 | 11:44:59 |
| F50-54 | 1 | 12:05:24 | 12:05:24 | 12:05:24 |
| F55-59 | 1 | 13:59:10 | 13:59:10 | 13:59:10 |
| F60-64 | 1 | 16:26:01 | 16:26:01 | 16:26:01 |
| F65-69 | 1 | 15:01:51 | 15:01:51 | 15:01:51 |
I’ve predicted Kona slot allocations based on numbers in the athlete tracker, the precise number of starters will affect the final allocation. Based on those numbers the above time represent an automatic qualification – as long as you’re at roll down and want it, you can have a slot. Again, roll down will affect the final time needed in some age groups. You can compare these times with other races on my Kona qualification page.
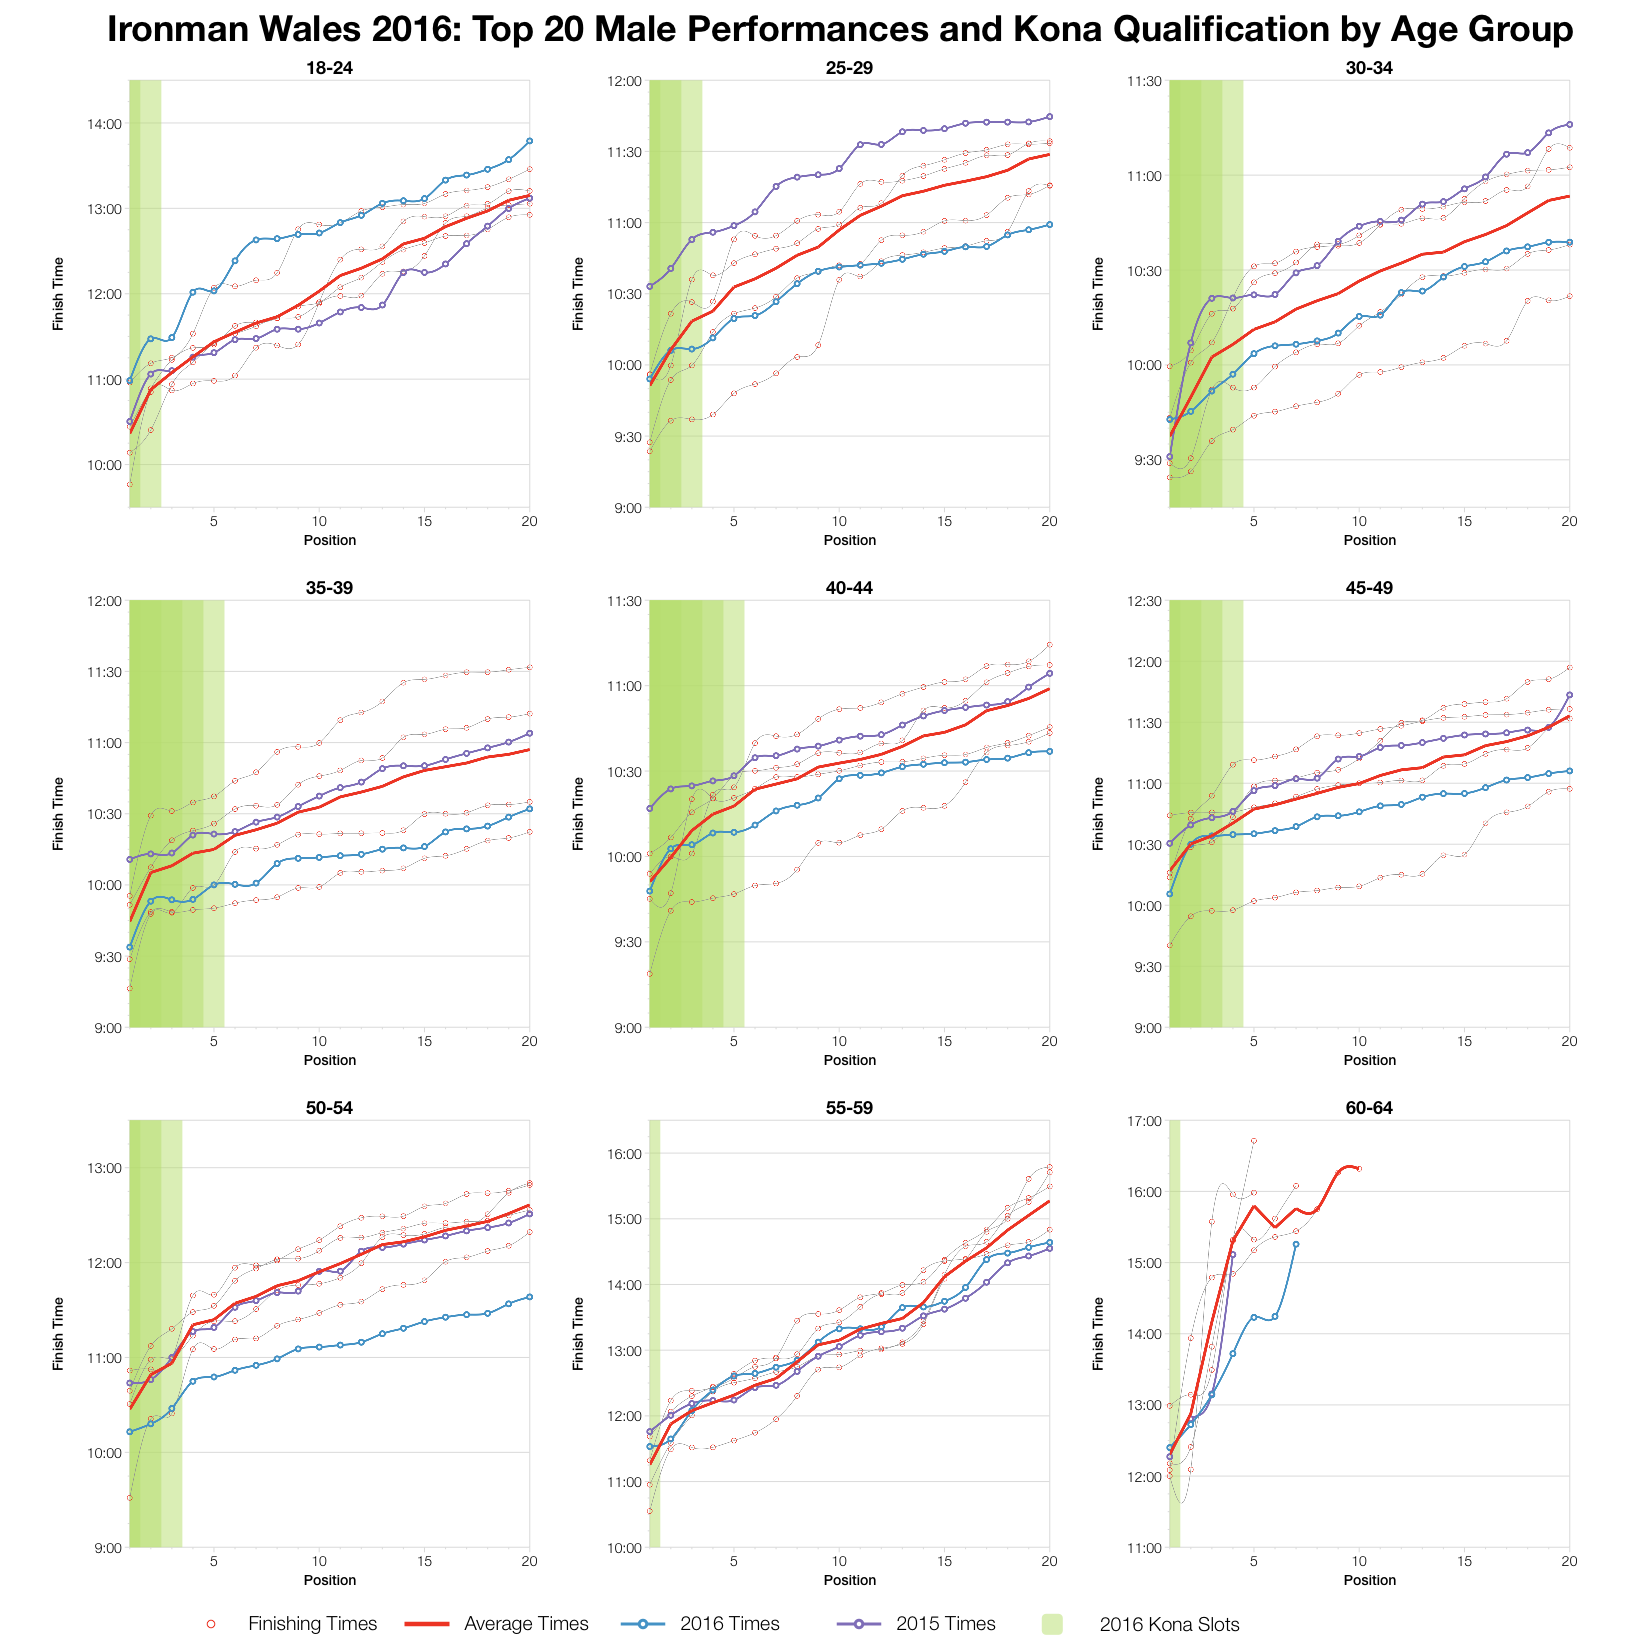

For the majority of age groups, top twenty times were ahead of the average at this year’s race. The only standout to this is M18-24 whose times lag behind. For the rest the results come out faster, although this isn’t necessarily by huge margins and with a couple of exceptions is not the fastest for the course. Overall it looks like moderate conditions allowed for slightly faster competition on the Tenby course.
You can access a spreadsheet of the full results and splits from Ironman Wales 2016 on my Google Drive.


