Entering it’s third year (alongside Ironman Mallorca) at the weekend was Ironman Chattanooga. This is going to be a quick analysis. Conditions in Chattanooga were hot and humid and the impact was extreme. The 2016 race is the slowest seen on the course by a large margin and the DNF rate was through the roof. That pretty neatly sums up what we’ll see in the following charts.
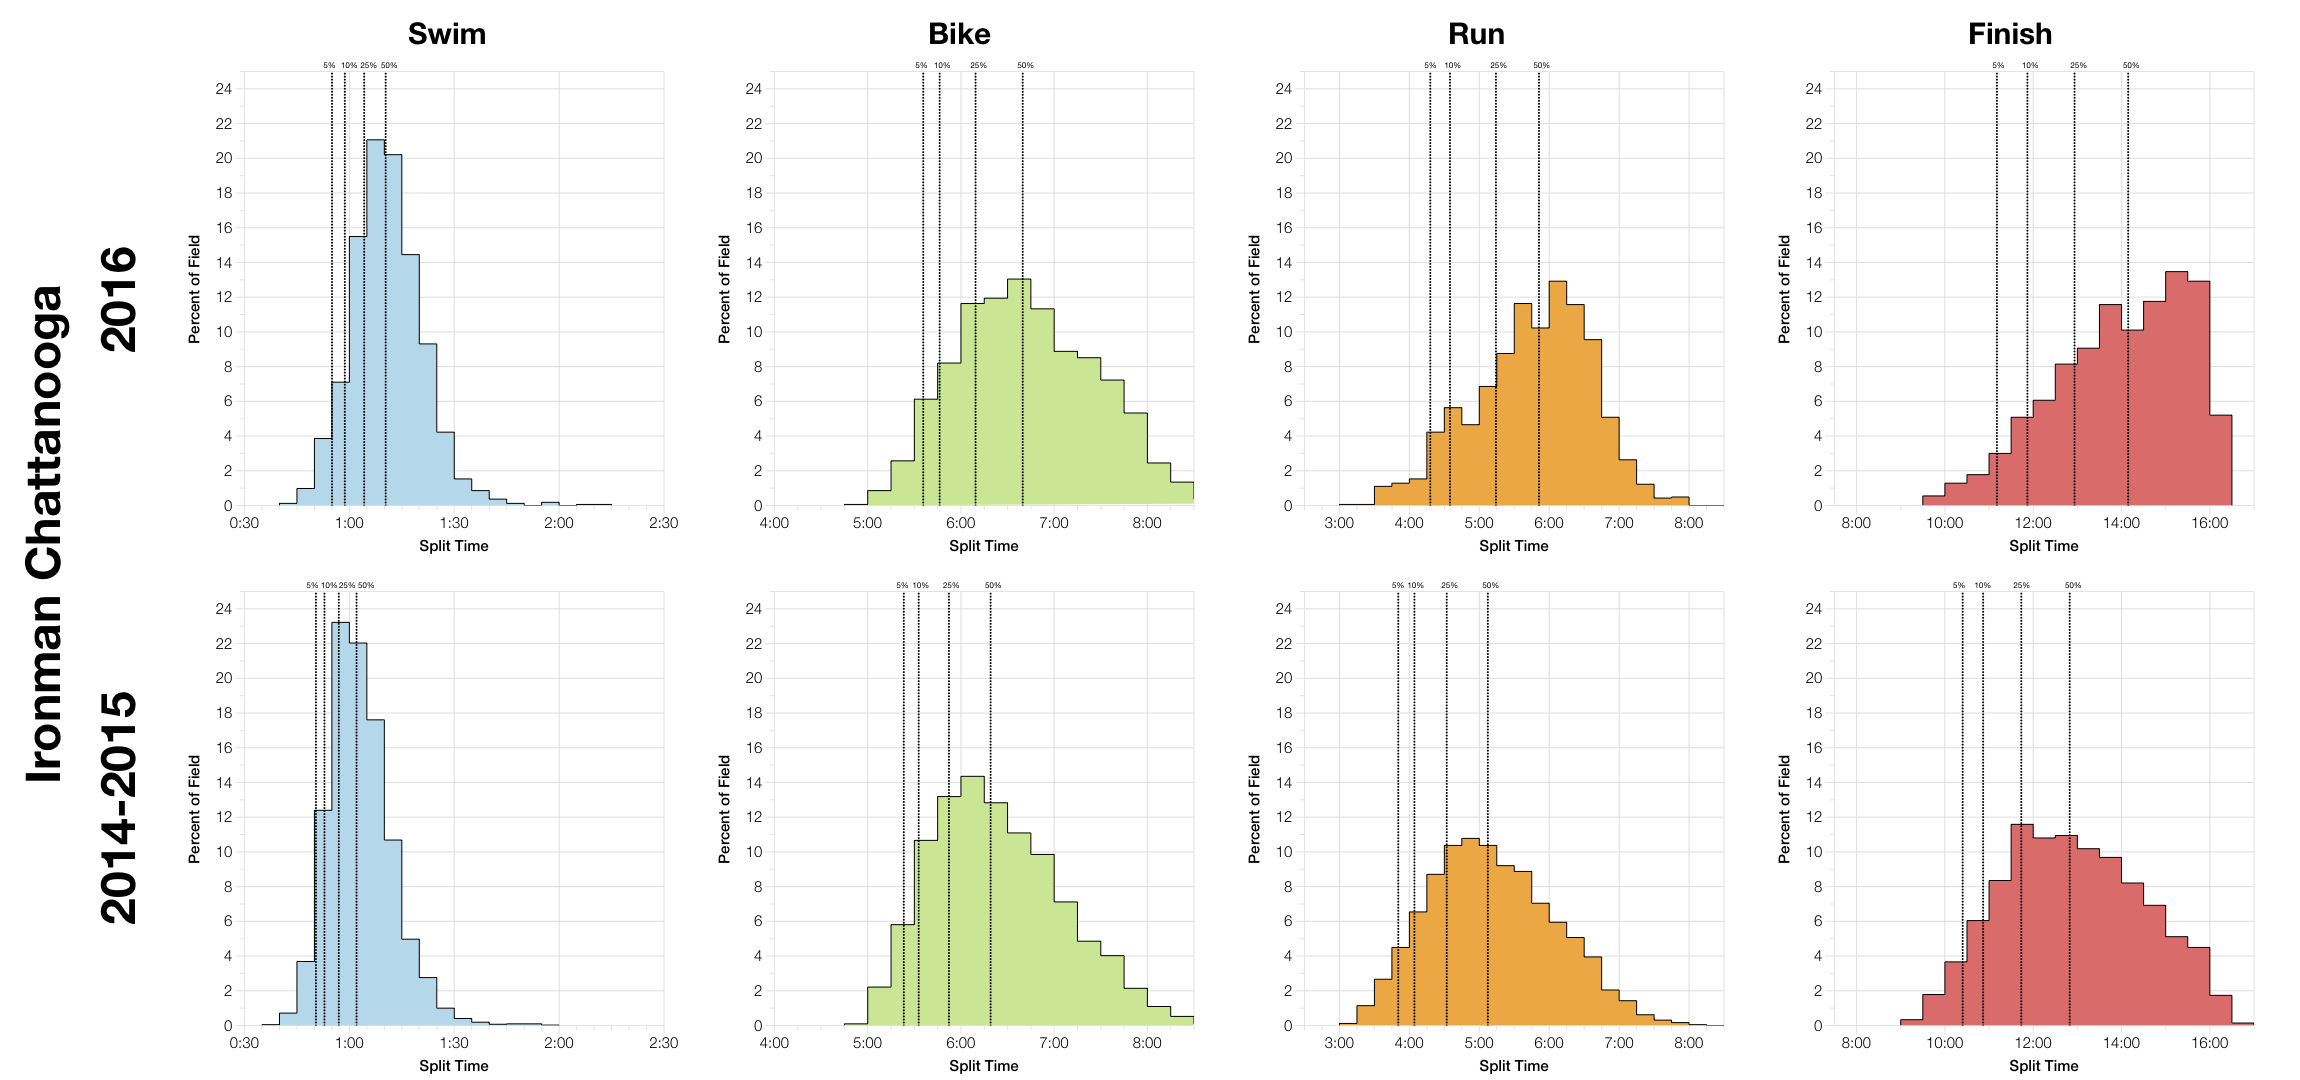
There is a massive shift in the results distributions for 2016. Overall we’re looking at a minimum of a 1 hour difference in finishing times; it’s not often I’ve seen that big an impact. Every stage of this race was slower, but it’s worth noting that the previous swim distribution is particularly fast and it’s really the bike and run that make the difference.
| Listed Athletes | Swim Finish | Swim DNS/DNF | Bike Finish | Bike DNF | Run Finish | Run DNF | Overall DNS/DNF | |
|---|---|---|---|---|---|---|---|---|
| 2014 | 2349 | 2315 | 1.4% | 2287 | 1.2% | 2233 | 2.4% | 4.9% |
| 2015 | 2674 | 2245 | 16% | 2193 | 2.3% | 2079 | 5.2% | 22.3% |
| 2016 | 2716 | 2213 | 18.5% | 2036 | 8% | 1651 | 18.9% | 39.2% |
To confuse matters we have differing records for start numbers – the 2014 figures don’t include DNS numbers, but both 2015 and 2016 do. The athlete tracker includes those who didn’t start the event, so for this analysis I can’t separate them out. What we can take away is the DNF rate is much higher than normal and we can see in the individual bike and run numbers a huge increase. A DNF rate of 18% on the run is massive, up there with the most extreme.
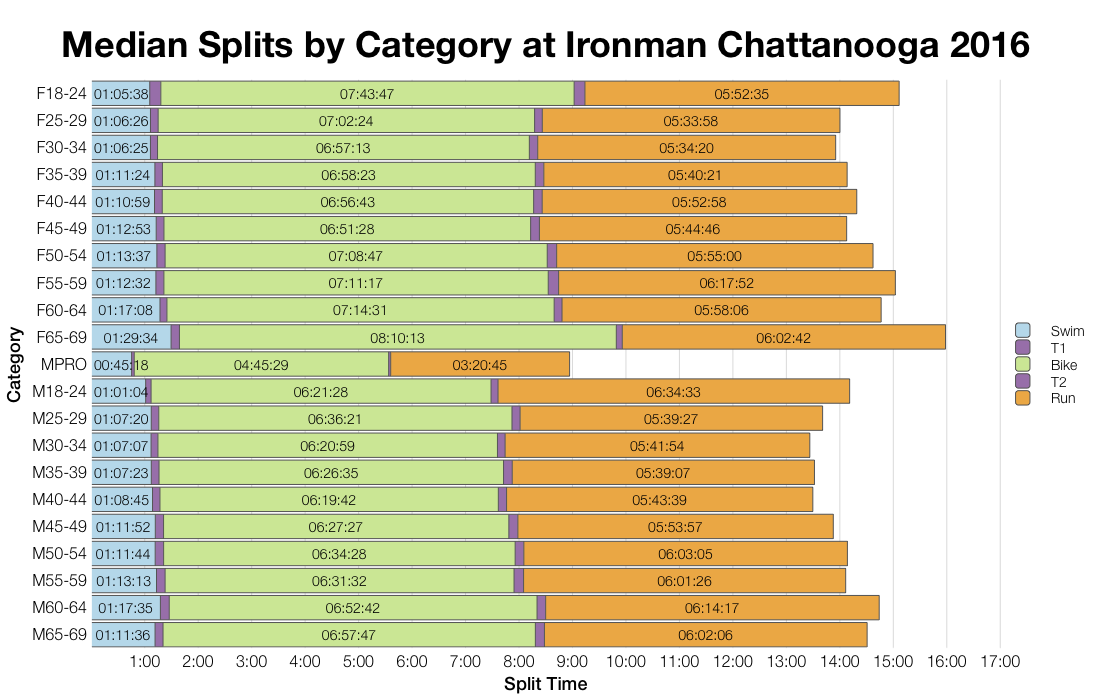
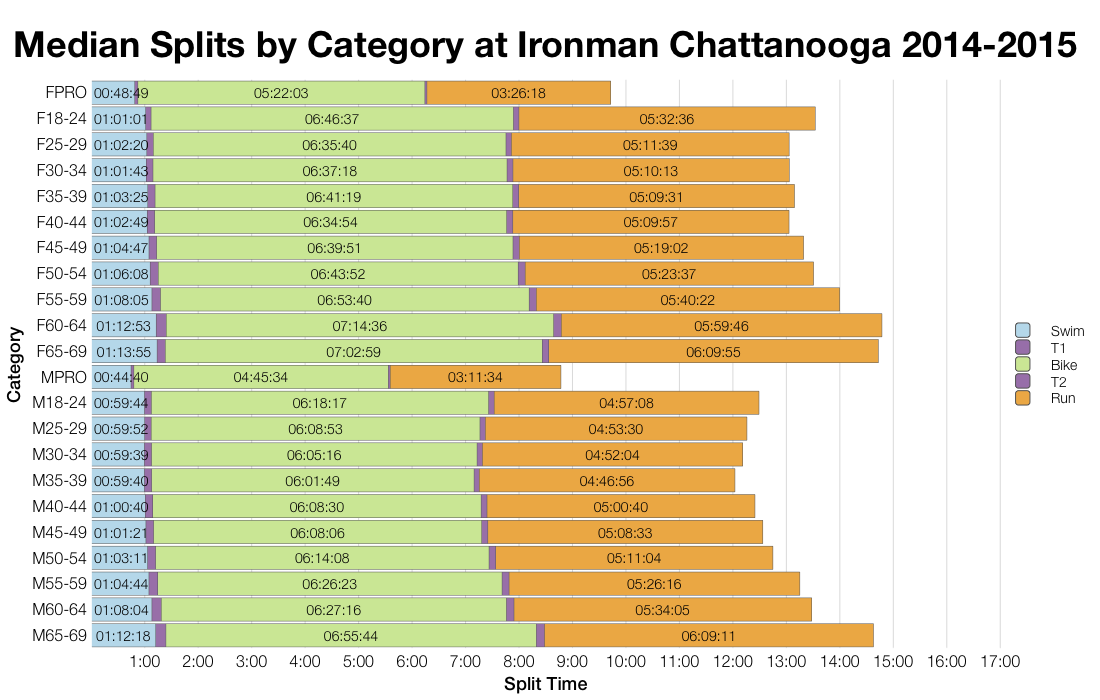
Of course age group medians show the same slower pattern. Only the male pros raced comparably with previous years, and even then their run was slower.
| Country | Percentage of Slots | Percentage of Field |
|---|---|---|
| United States | 90.0 | 92.4 |
| Germany | 5.0 | 0.2 |
| United Kingdom | 5.0 | 0.8 |
| South Africa | 5.0 | 0.2 |
Assuming little roll down, almost all of the 40 Kona slots available in Chattanooga will have gone to US age groupers. Not surprising given they make up over 90% of the competitive field.
| Count | Percentage | |
|---|---|---|
| United States | 2510 | 92.4 |
| Canada | 38 | 1.4 |
| United Kingdom | 23 | 0.8 |
| Mexico | 22 | 0.8 |
| Puerto Rico | 17 | 0.6 |
| Ireland | 7 | 0.3 |
| Philippines | 7 | 0.3 |
| South Africa | 6 | 0.2 |
| Germany | 6 | 0.2 |
| Colombia | 6 | 0.2 |
As noted, most athletes came from North America, but there’s a small selection from around the world.
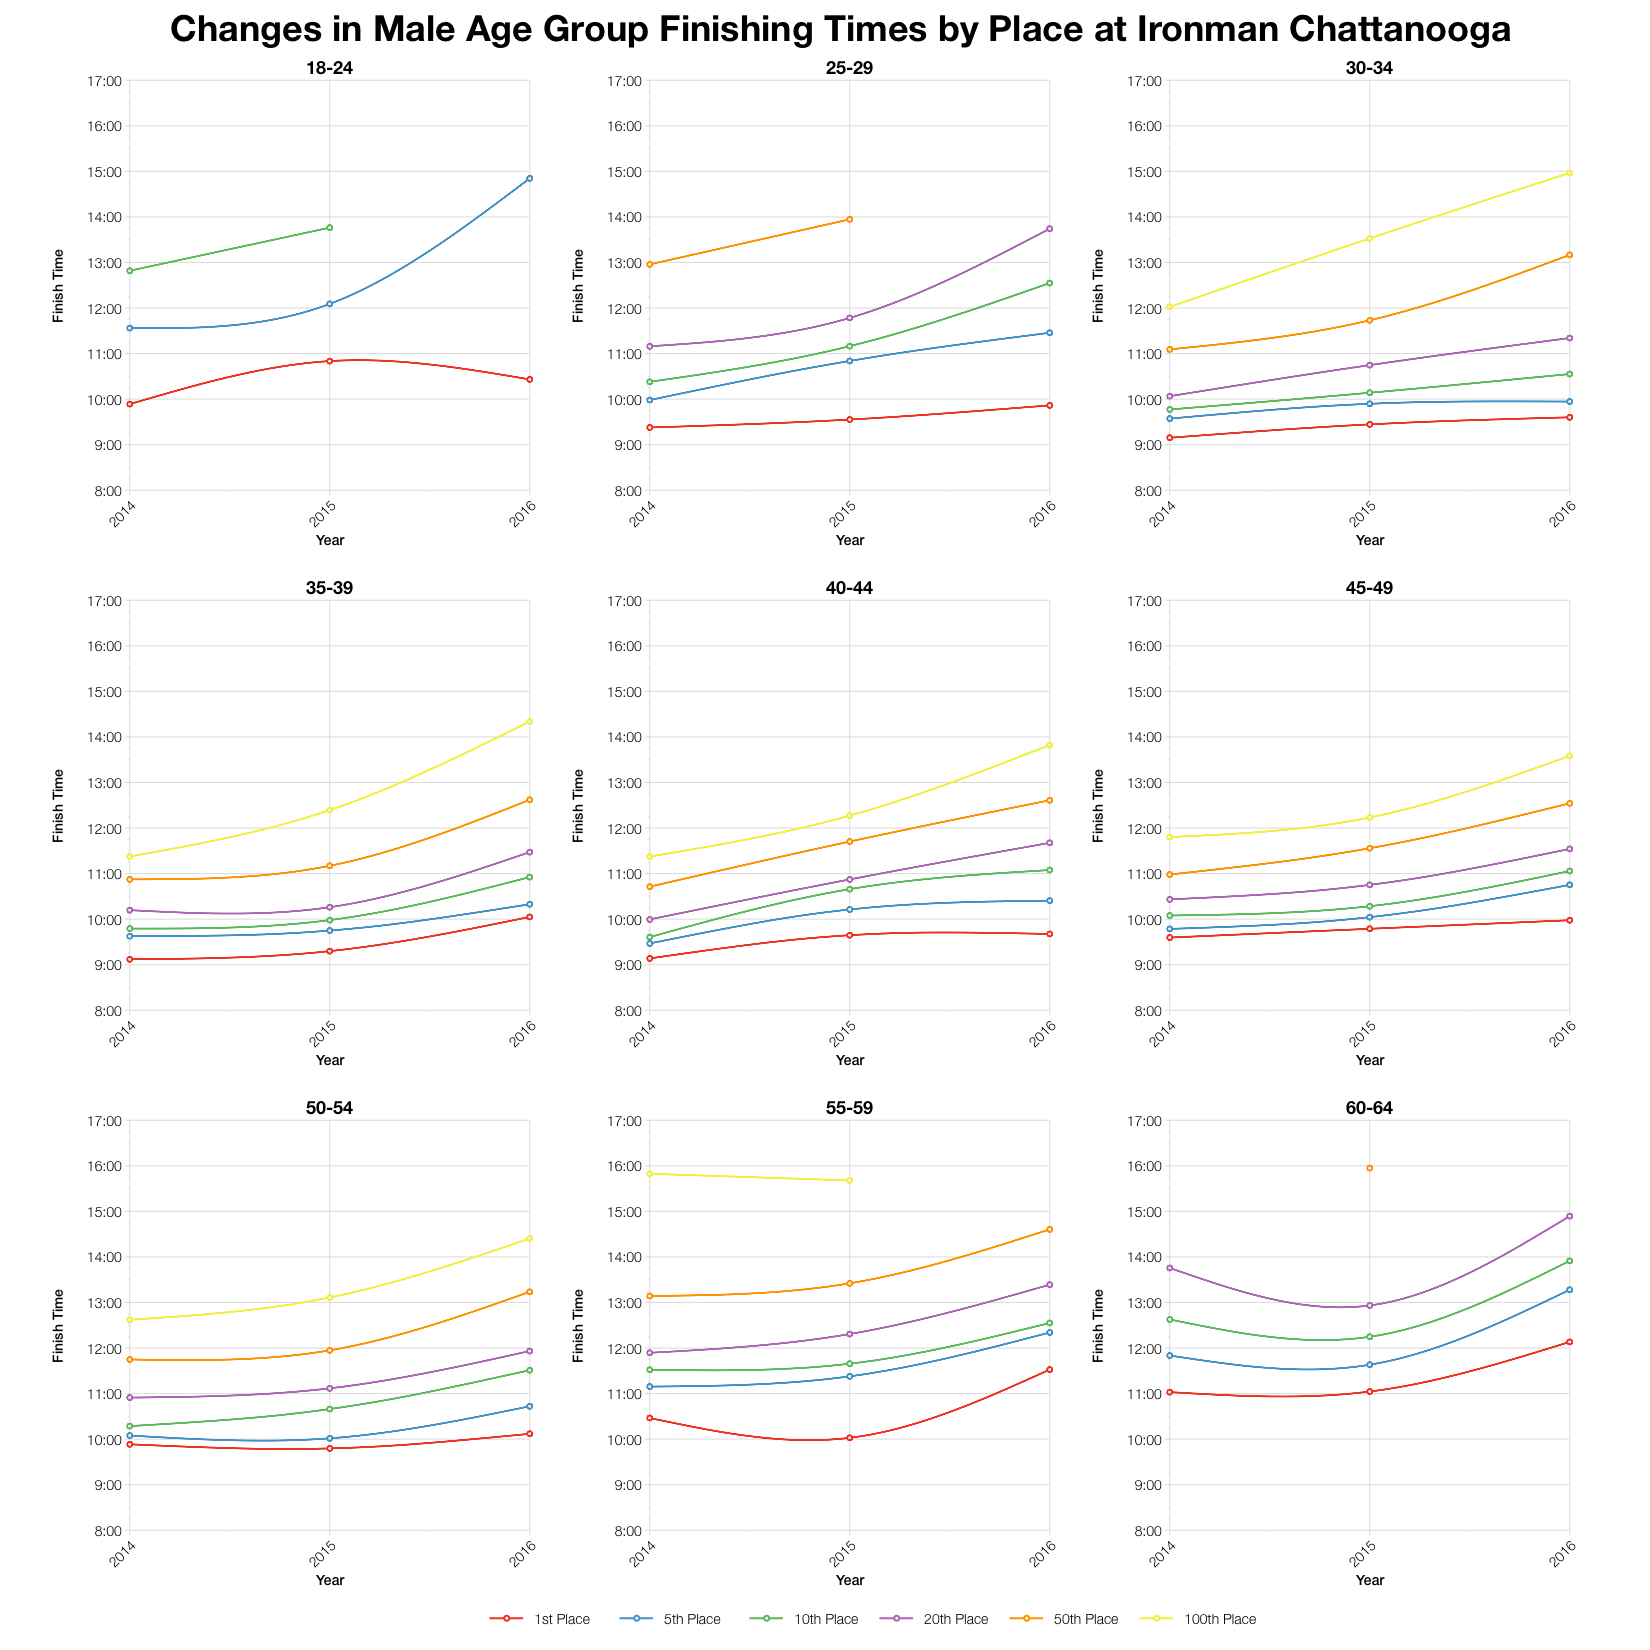
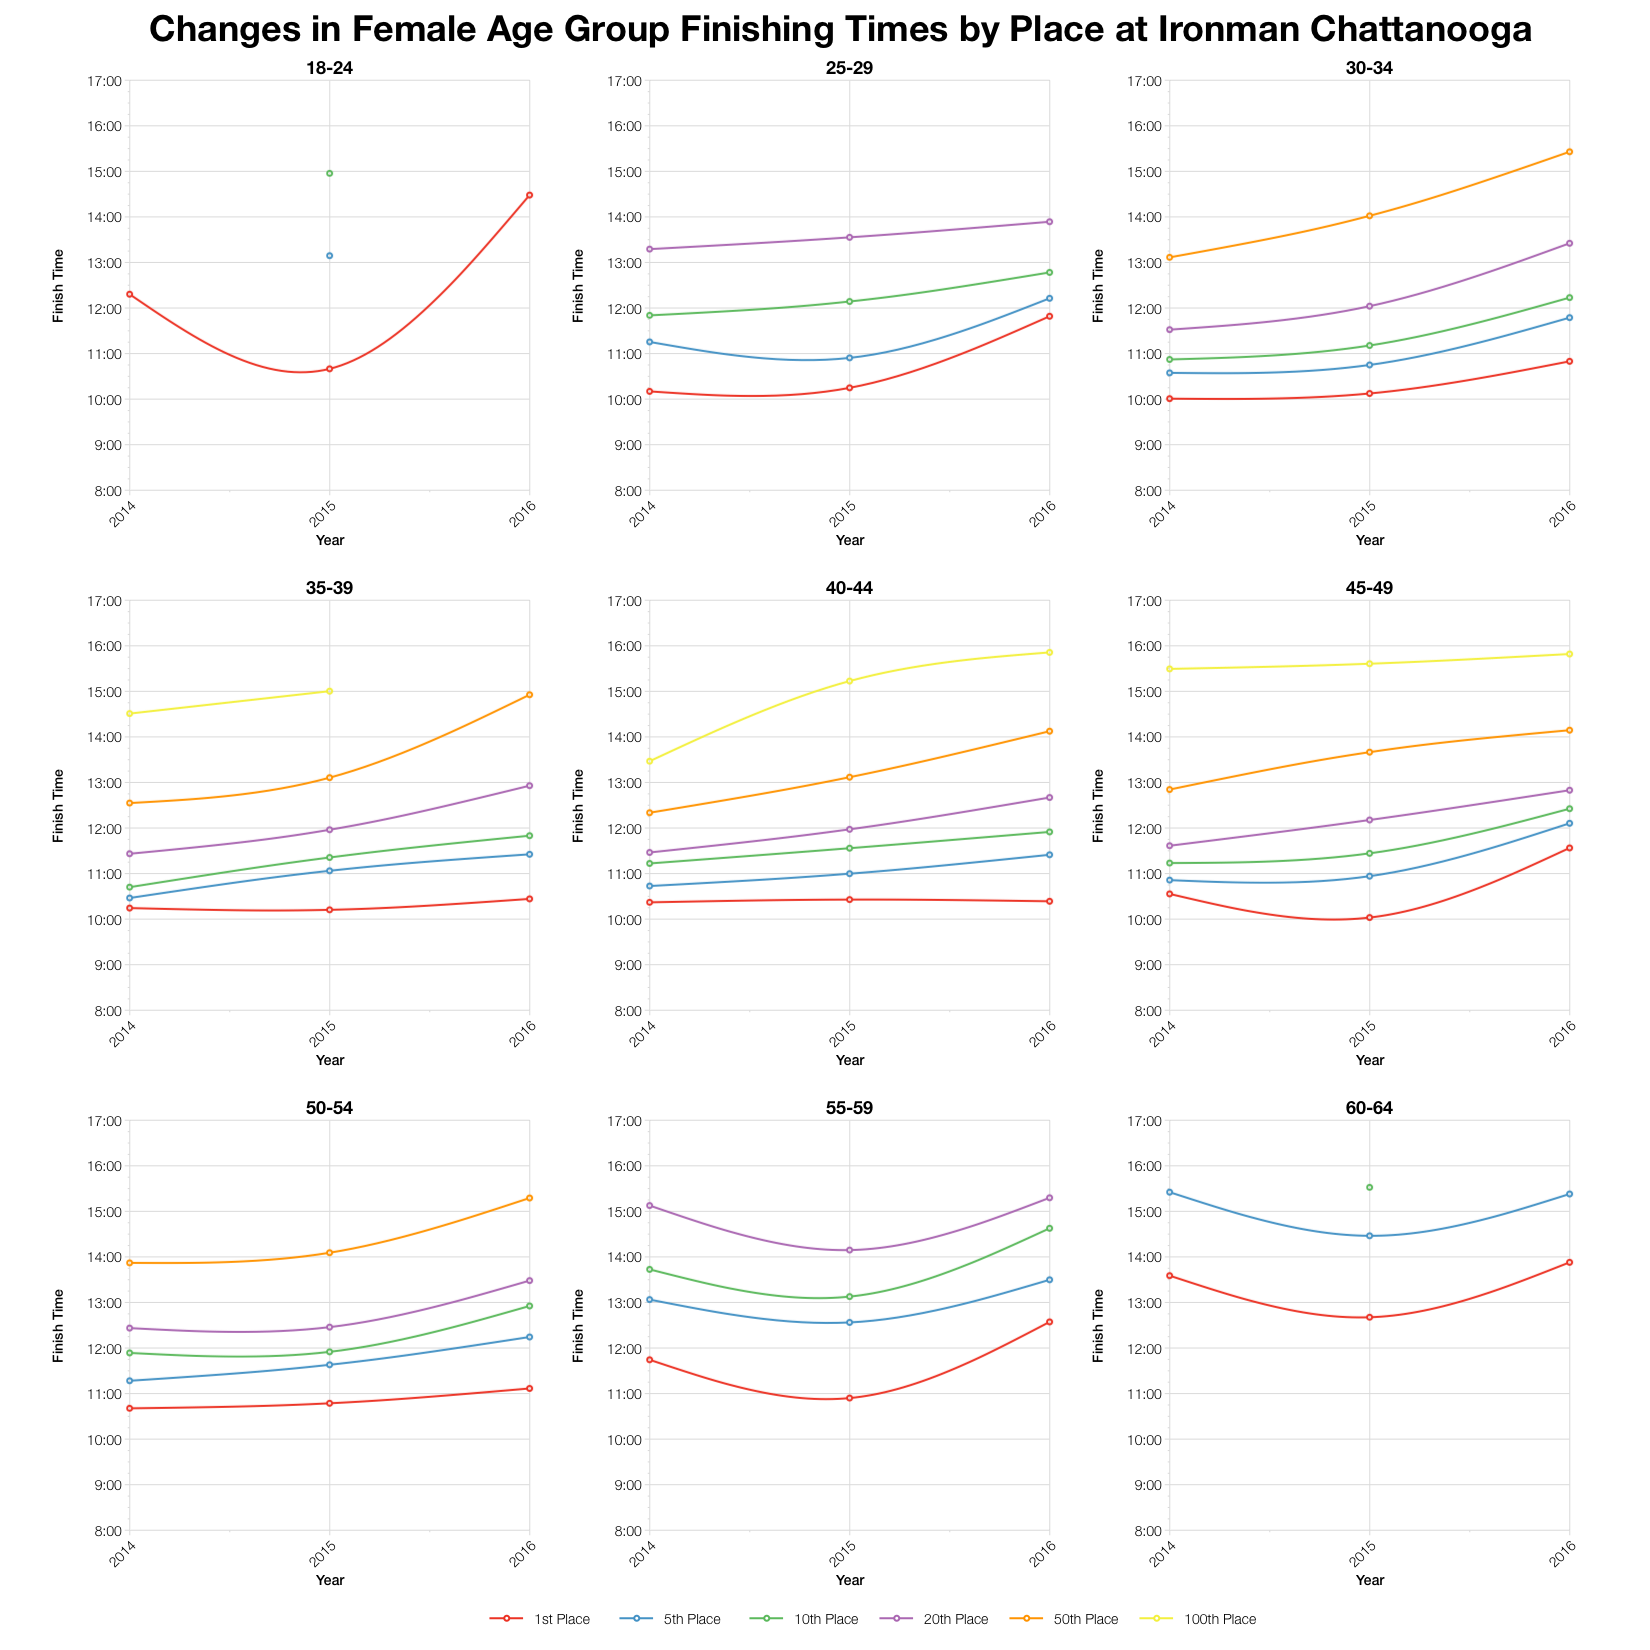
If you need further confirmation we can compare finishing time by position across different age groups. There’s a large up turn in times for almost every age group and position.
| Slots | Winner | Average Kona Qualifier | Final Qualifier | |
|---|---|---|---|---|
| M18-24 | 1 | 10:26:01 | 10:26:01 | 10:26:01 |
| M25-29 | 1 | 9:51:48 | 9:51:48 | 9:51:48 |
| M30-34 | 2 | 9:36:04 | 9:44:14 | 9:52:24 |
| M35-39 | 3 | 10:02:54 | 10:09:42 | 10:17:05 |
| M40-44 | 3 | 9:40:29 | 9:53:41 | 10:09:29 |
| M45-49 | 4 | 9:58:34 | 10:20:30 | 10:41:13 |
| M50-54 | 3 | 10:07:02 | 10:19:00 | 10:31:43 |
| M55-59 | 2 | 11:31:35 | 11:38:21 | 11:45:07 |
| M60-64 | 2 | 12:08:02 | 12:16:40 | 12:25:18 |
| M65-69 | 1 | 13:19:31 | 13:19:31 | 13:19:31 |
| M70-74 | 1 | 15:12:45 | 15:12:45 | 15:12:45 |
| F18-24 | 1 | 14:28:59 | 14:28:59 | 14:28:59 |
| F25-29 | 1 | 11:49:21 | 11:49:21 | 11:49:21 |
| F30-34 | 2 | 10:50:01 | 10:56:25 | 11:02:50 |
| F35-39 | 2 | 10:26:53 | 10:28:57 | 10:31:02 |
| F40-44 | 2 | 10:23:43 | 10:27:54 | 10:32:05 |
| F45-49 | 2 | 11:33:59 | 11:39:53 | 11:45:48 |
| F50-54 | 2 | 11:06:58 | 11:30:31 | 11:54:05 |
| F55-59 | 1 | 12:34:37 | 12:34:37 | 12:34:37 |
| F60-64 | 1 | 13:53:04 | 13:53:04 | 13:53:04 |
| F65-69 | 1 | 15:58:34 | 15:58:34 | 15:58:34 |
Using the numbers in the athlete tracker I’ve estimate the slot distribution for Chattanooga, the actual allocation will use start numbers on the day. From that I can estimate the automatic qualifying times for the event, assuming no roll down. You can compare these times with those of other races on my Kona qualification page.
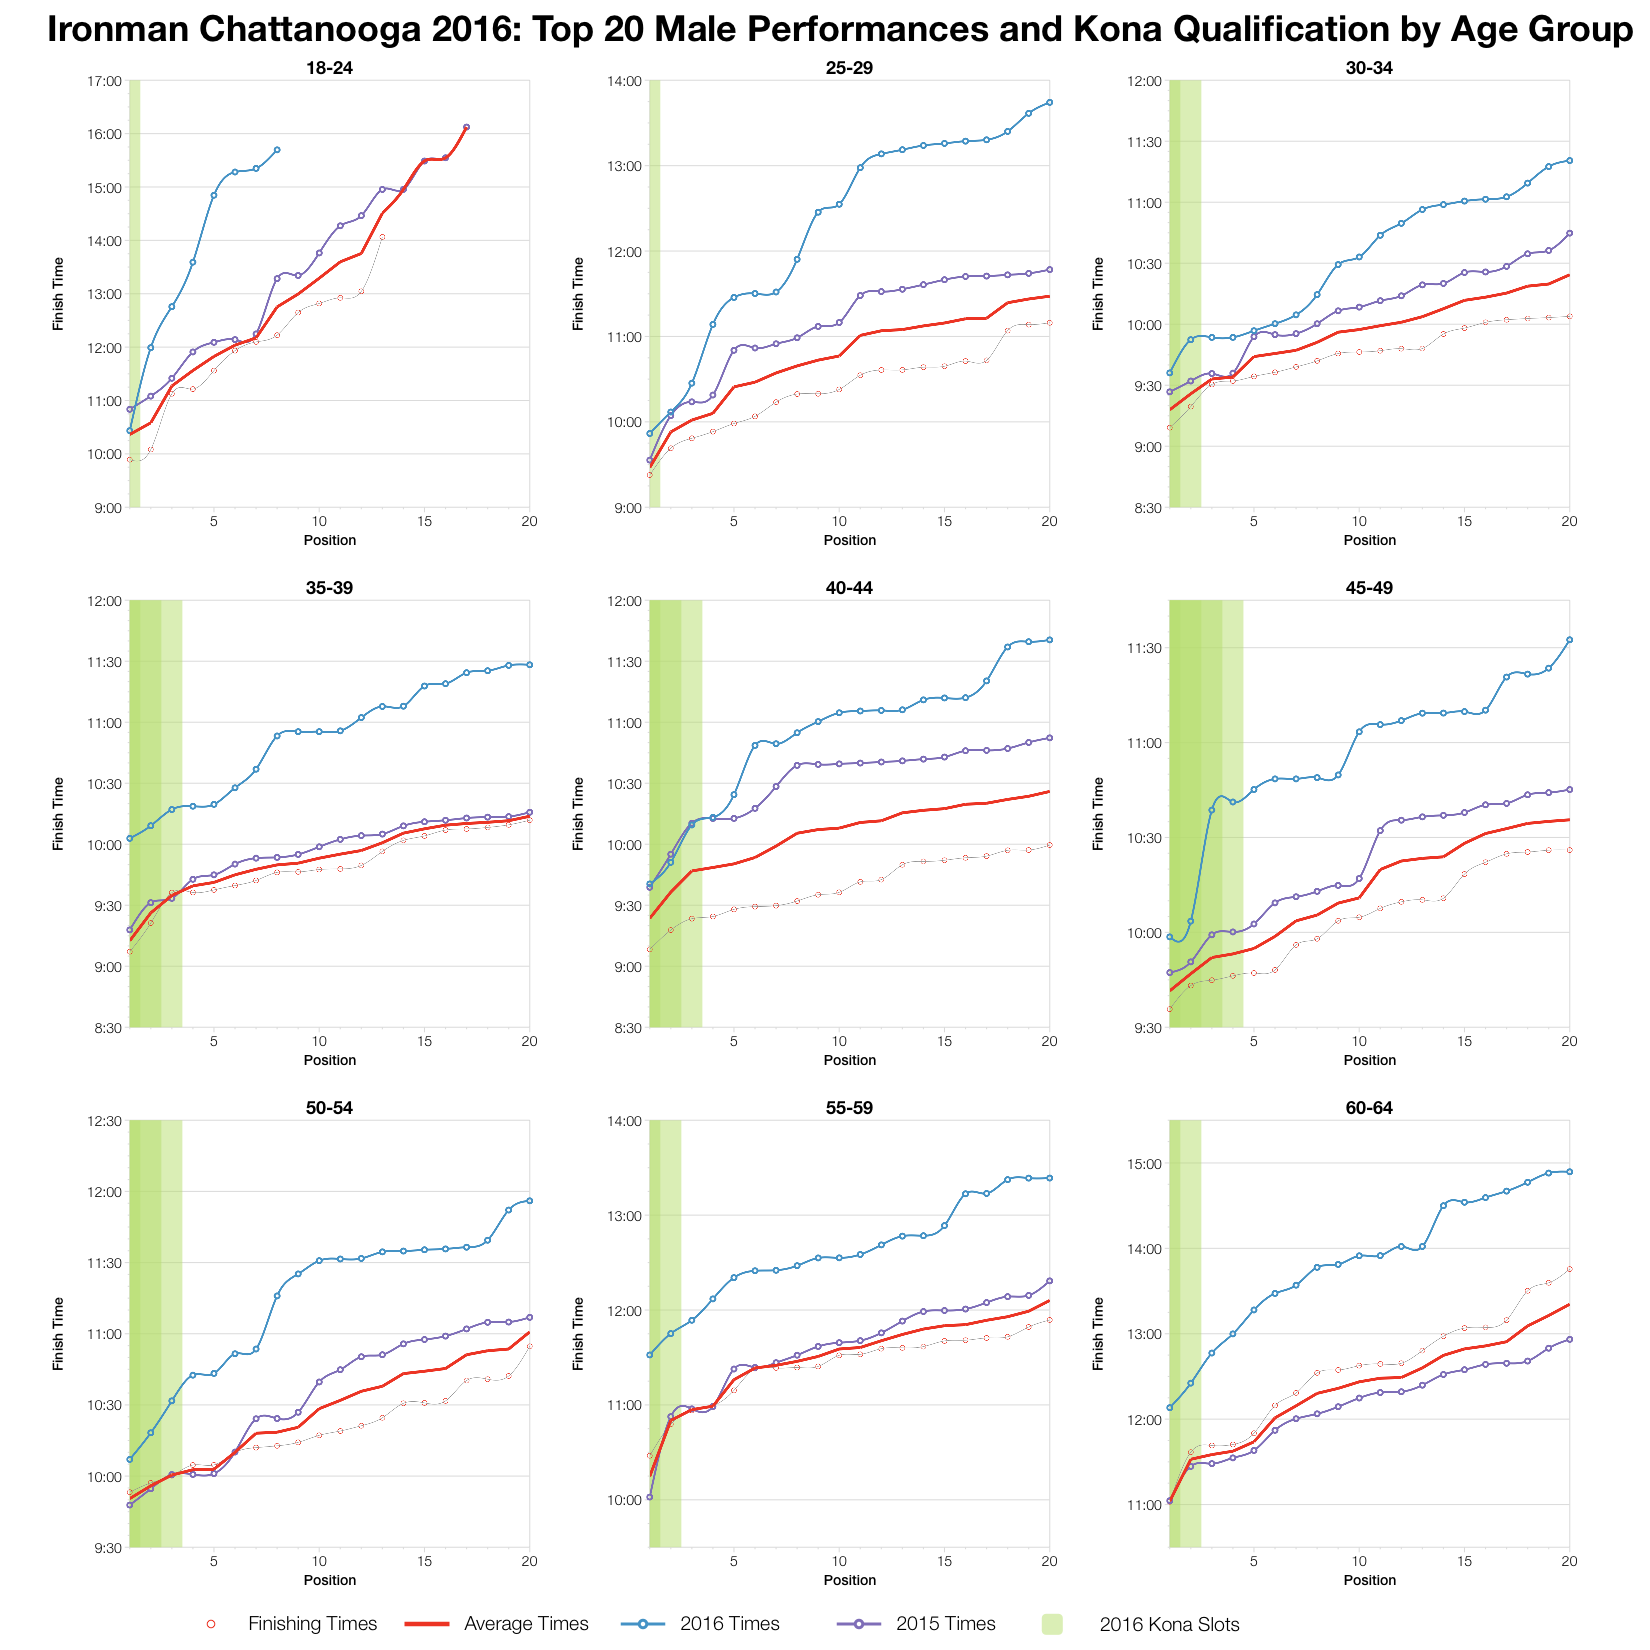
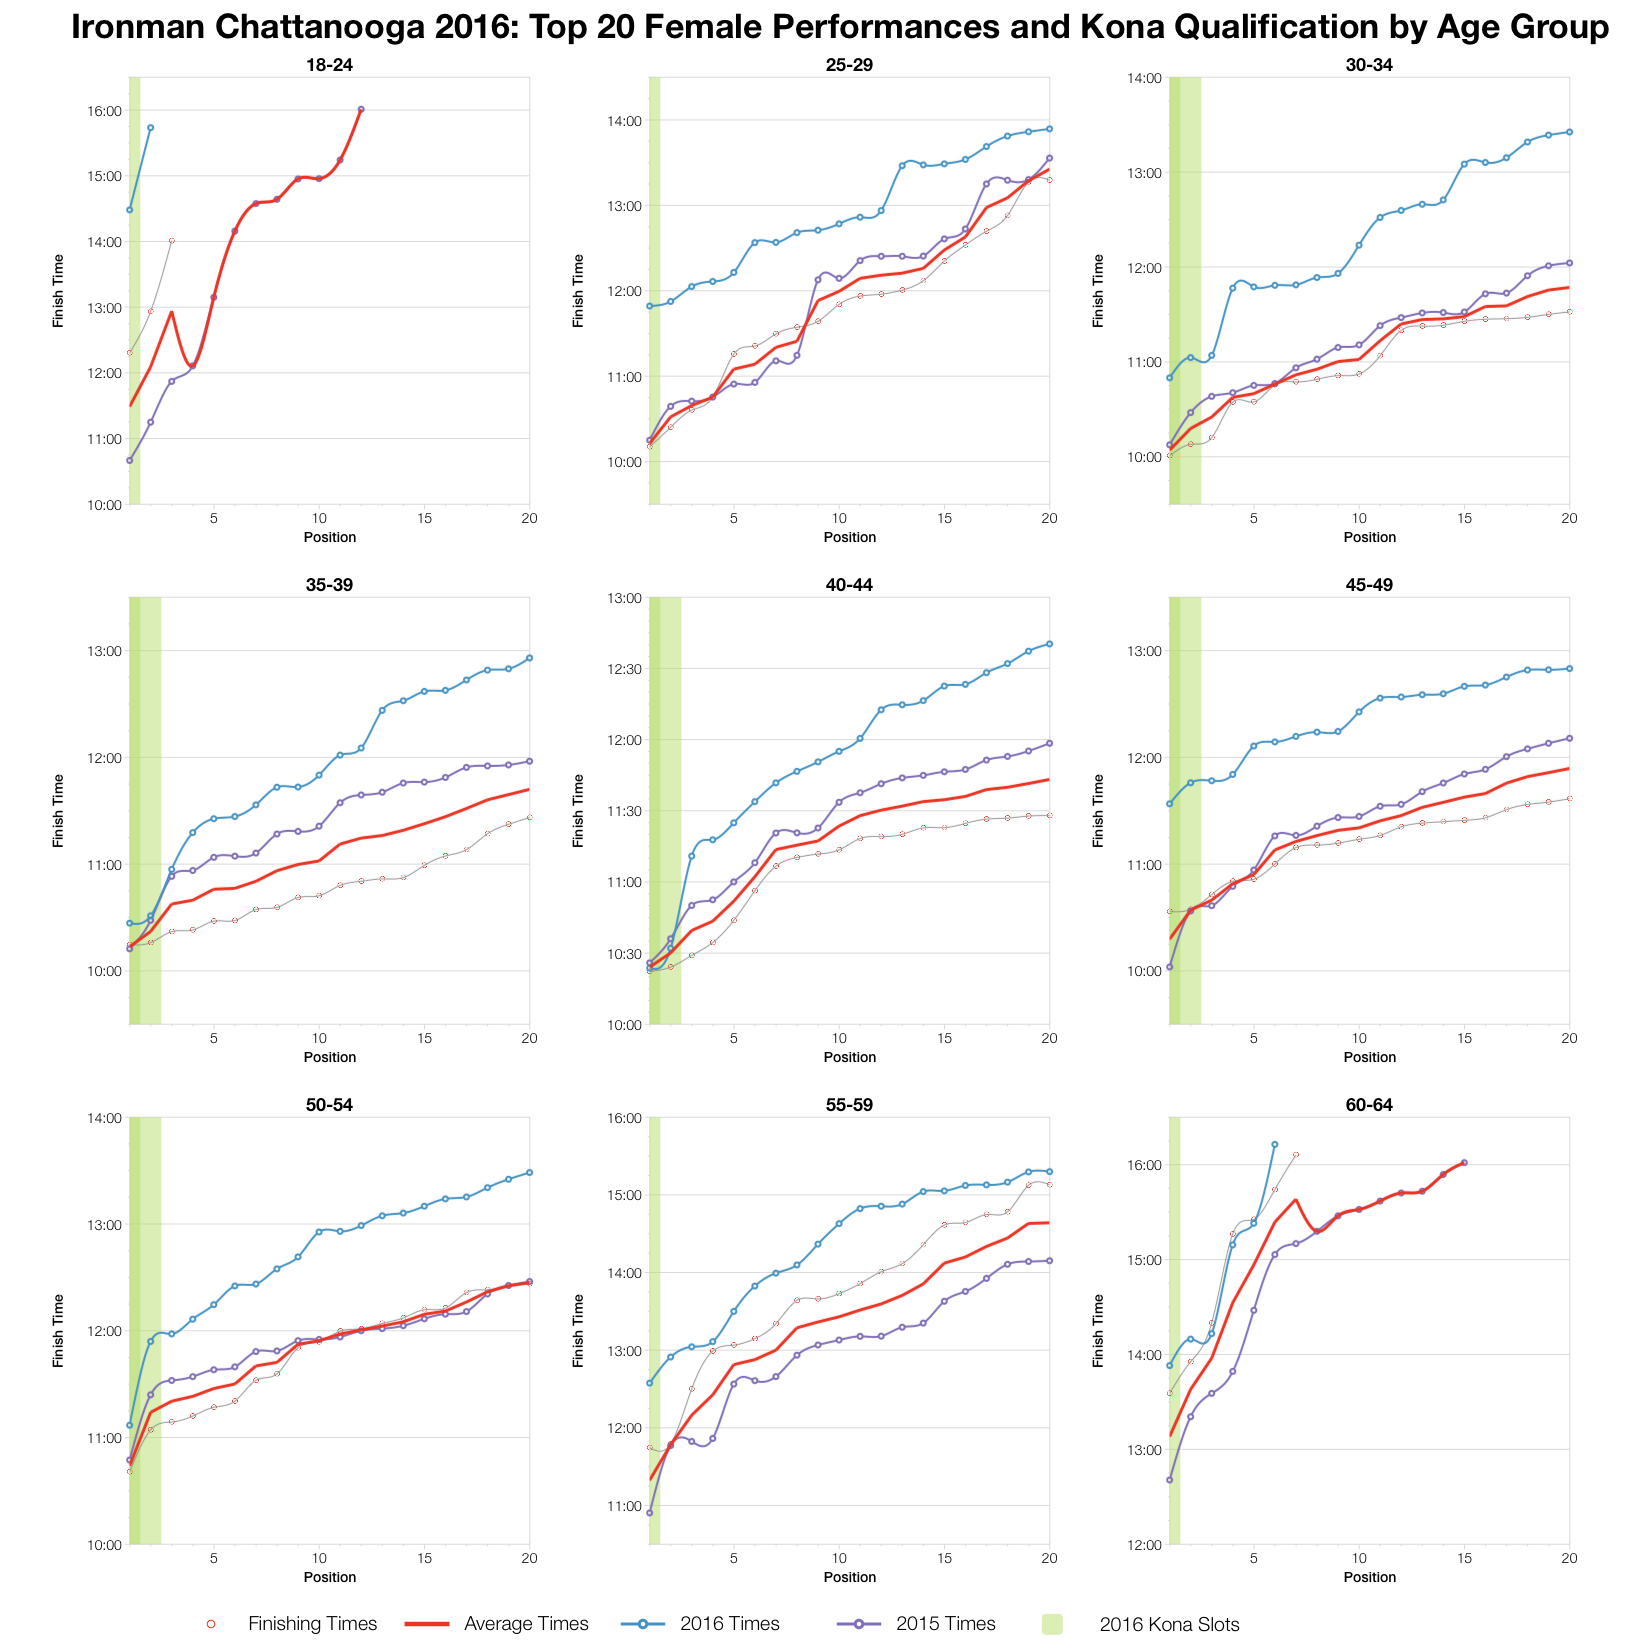
To finish off this analysis, the top twenty times from the age groups. Again, slower. There are a few athletes, Kona qualifiers at the front of their age groups, who matched last year’s times, but the majority are well behind the average for this course. For almost every age grouper this was a much slower year.
You can access a spreadsheet of the full results and splits from Ironman Chattanooga 2016 on my Google Drive.


