It was a fast and competitive year at Ironman South Africa. Some of this can be attributed to course changes that have given a speed bump to the event in the last few years, and the African Championship has always been able to draw competitive age groupers thanks to its 75 Kona slots on offer. However, this year’s improvements spread further back than the top age groupers, suggesting good racing conditions on the day.
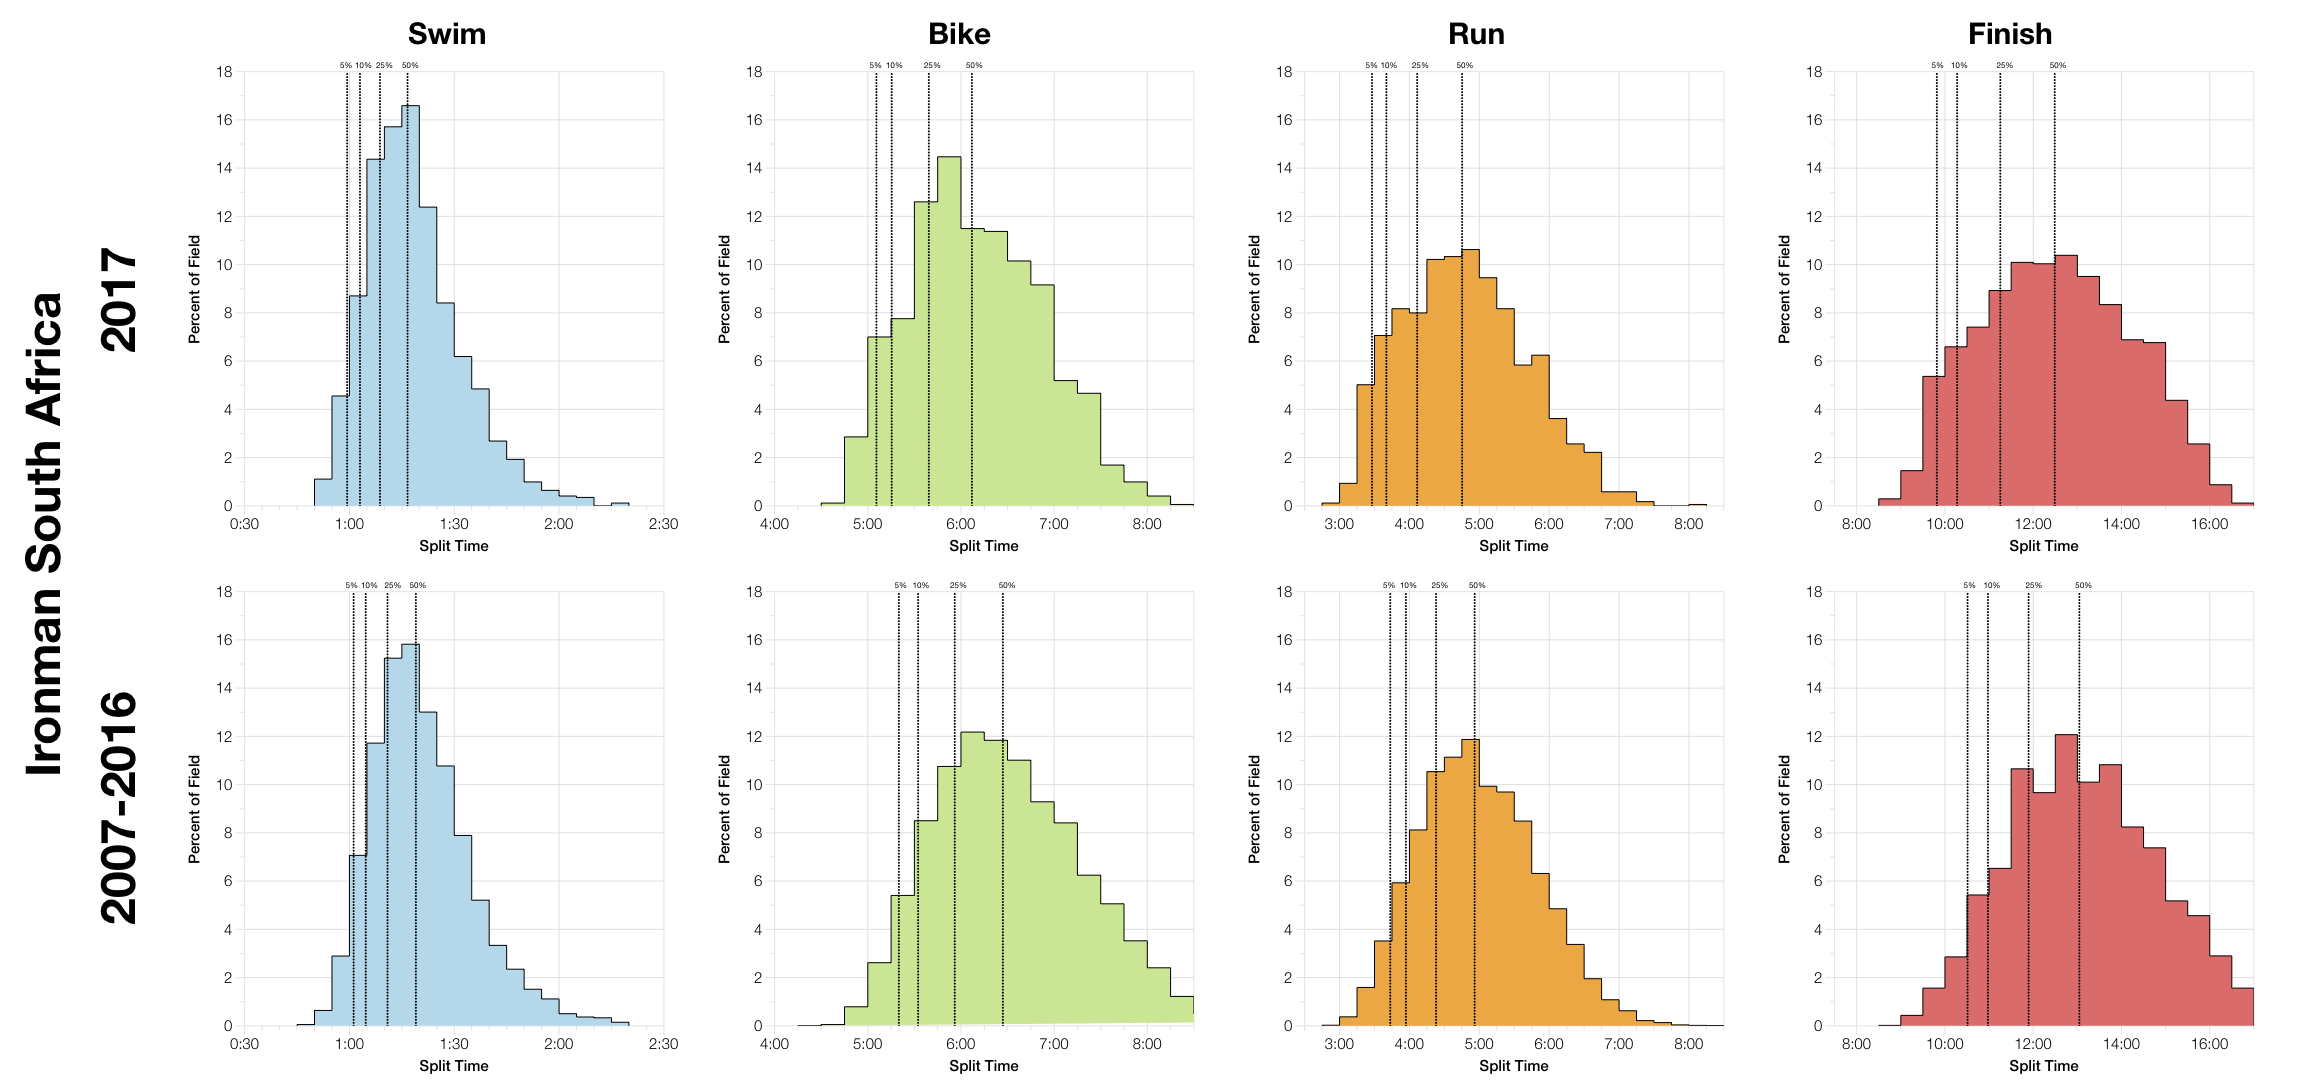
It’s quite clear that the histograms for each discipline – swim, bike and run – trend faster in 2017 than the previous 10 year aggregate. I should emphasise the impact of course changes on this, in recent years the bike course has been modified which has helped bring down times. So a slower, older course drags back the historical data. Still it’s a significant jump in finishing times, 30 minutes faster at the median.
| Listed Athletes | Swim Finish | Swim DNS/DNF | Bike Finish | Bike DNF | Run Finish | Run DNF | Overall DNS/DNF | |
|---|---|---|---|---|---|---|---|---|
| 2007 | 1572 | 1366 | 13.1% | 1324 | 3.1% | 1305 | 1.4% | 17% |
| 2008 | 1567 | 1432 | 8.6% | 1420 | 0.8% | 1403 | 1.2% | 10.5% |
| 2009 | 1520 | 1408 | 7.4% | 1390 | 1.3% | 1305 | 6.1% | 14.2% |
| 2010 | 1654 | 1614 | 2.4% | 1590 | 1.5% | 1548 | 2.6% | 6.4% |
| 2011 | 1733 | 1584 | 8.6% | 1553 | 2% | 1505 | 3.1% | 13.2% |
| 2012 | 1635 | 1580 | 3.4% | 1429 | 9.6% | 1384 | 3.1% | 15.4% |
| 2013 | 1784 | 1615 | 9.5% | 1592 | 1.4% | 1541 | 3.2% | 13.6% |
| 2014 | 2374 | 2084 | 12.2% | 2012 | 3.5% | 1883 | 6.4% | 20.6% |
| 2015 | 2032 | 1741 | 14.3% | 1690 | 2.9% | 1586 | 6.2% | 21.9% |
| 2016 | 1856 | 1664 | 10.3% | 1638 | 1.6% | 1566 | 4.4% | 15.6% |
| 2017 | 1898 | 1877 | 1.1% | 1830 | 2.5% | 1757 | 4% | 7.4% |
Comparisons of DNF rates always suffer a little due to variations in how DNS numbers are recorded. Some years it’s just those who register at the venue in the tracker, on others everyone who entered is included. Typically, where we see higher, two-digit swim DNF/DNS numbers we should expect it to be the latter case. This year appears to be the former, with a low swim DNS/DNF rate, and bike and run DNF rates that fall somewhere in the middle of previous years. Essentially the numbers suggest a decent year at South Africa, although there’s nothing exceptional about them.
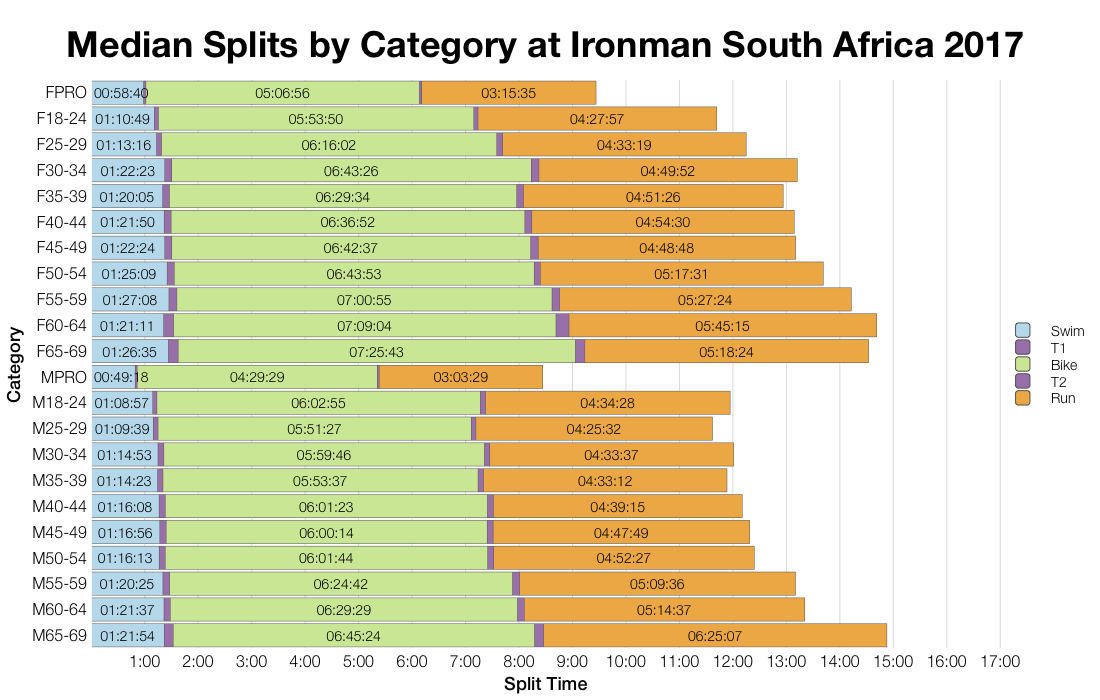
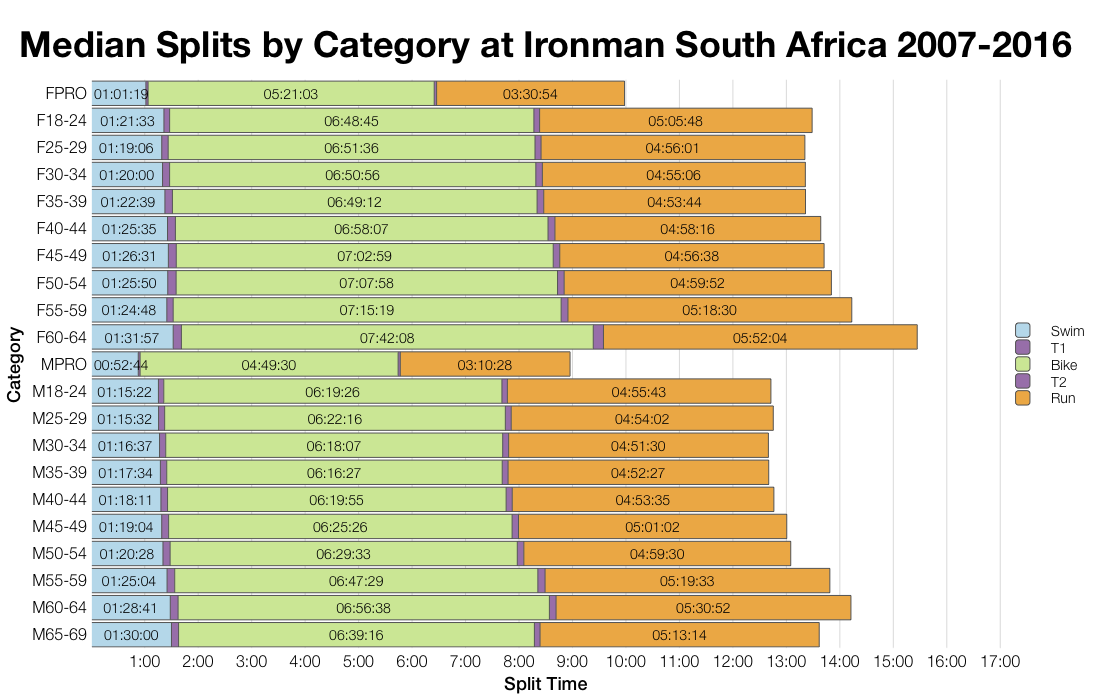
Comparing medians gives a little more detail for individual age groups. As we’d expect the trend is consistent with the distribution charts above for age groupers and pros alike. Once again though we should note the impact of course changes in this data. The older medians will be affected by what looks to have been a slower course.
| Count | Percentage | |
|---|---|---|
| South Africa | 1200 | 63.2 |
| United Kingdom | 86 | 4.5 |
| Germany | 64 | 3.4 |
| France | 61 | 3.2 |
| United States | 40 | 2.1 |
| Spain | 39 | 2.1 |
| Sweden | 30 | 1.6 |
| Denmark | 29 | 1.5 |
| Australia | 29 | 1.5 |
| Switzerland | 26 | 1.4 |
South Africa has always attracted a very diverse field with almost 40% of competitors coming from overseas. As mentioned, it’s high Kona slot allocation and, at least in the past, perception as a relatively steady race have tended to attract Koan slot hunters.
| Country | Percentage of Slots | Percentage of Field |
|---|---|---|
| South Africa | 24.0 | 63.2 |
| United Kingdom | 10.7 | 4.5 |
| Spain | 8.0 | 2.1 |
| France | 6.7 | 3.2 |
| Belgium | 6.7 | 0.8 |
| Australia | 5.3 | 1.5 |
| Denmark | 5.3 | 1.5 |
| Finland | 4.0 | 0.5 |
| Germany | 4.0 | 3.4 |
| Norway | 4.0 | 0.5 |
| Sweden | 2.7 | 1.6 |
| Israel | 2.7 | 0.3 |
| Canada | 2.7 | 0.5 |
| Italy | 2.7 | 1.2 |
| Ireland | 1.3 | 0.5 |
| Netherlands | 1.3 | 0.6 |
| Argentinia | 1.3 | 1.3 |
| Brazil | 1.3 | 0.7 |
| Uruguay | 1.3 | 0.1 |
| Luxembourg | 1.3 | 0.4 |
| Poland | 1.3 | 0.8 |
| Portugal | 1.3 | 0.5 |
The proportion of slots going to overseas athletes would back this up too. While most slots stayed in South Africa, compared to the number of athletes racing, locals underperformed. A wide range of visitors were able to grab slots at the race.
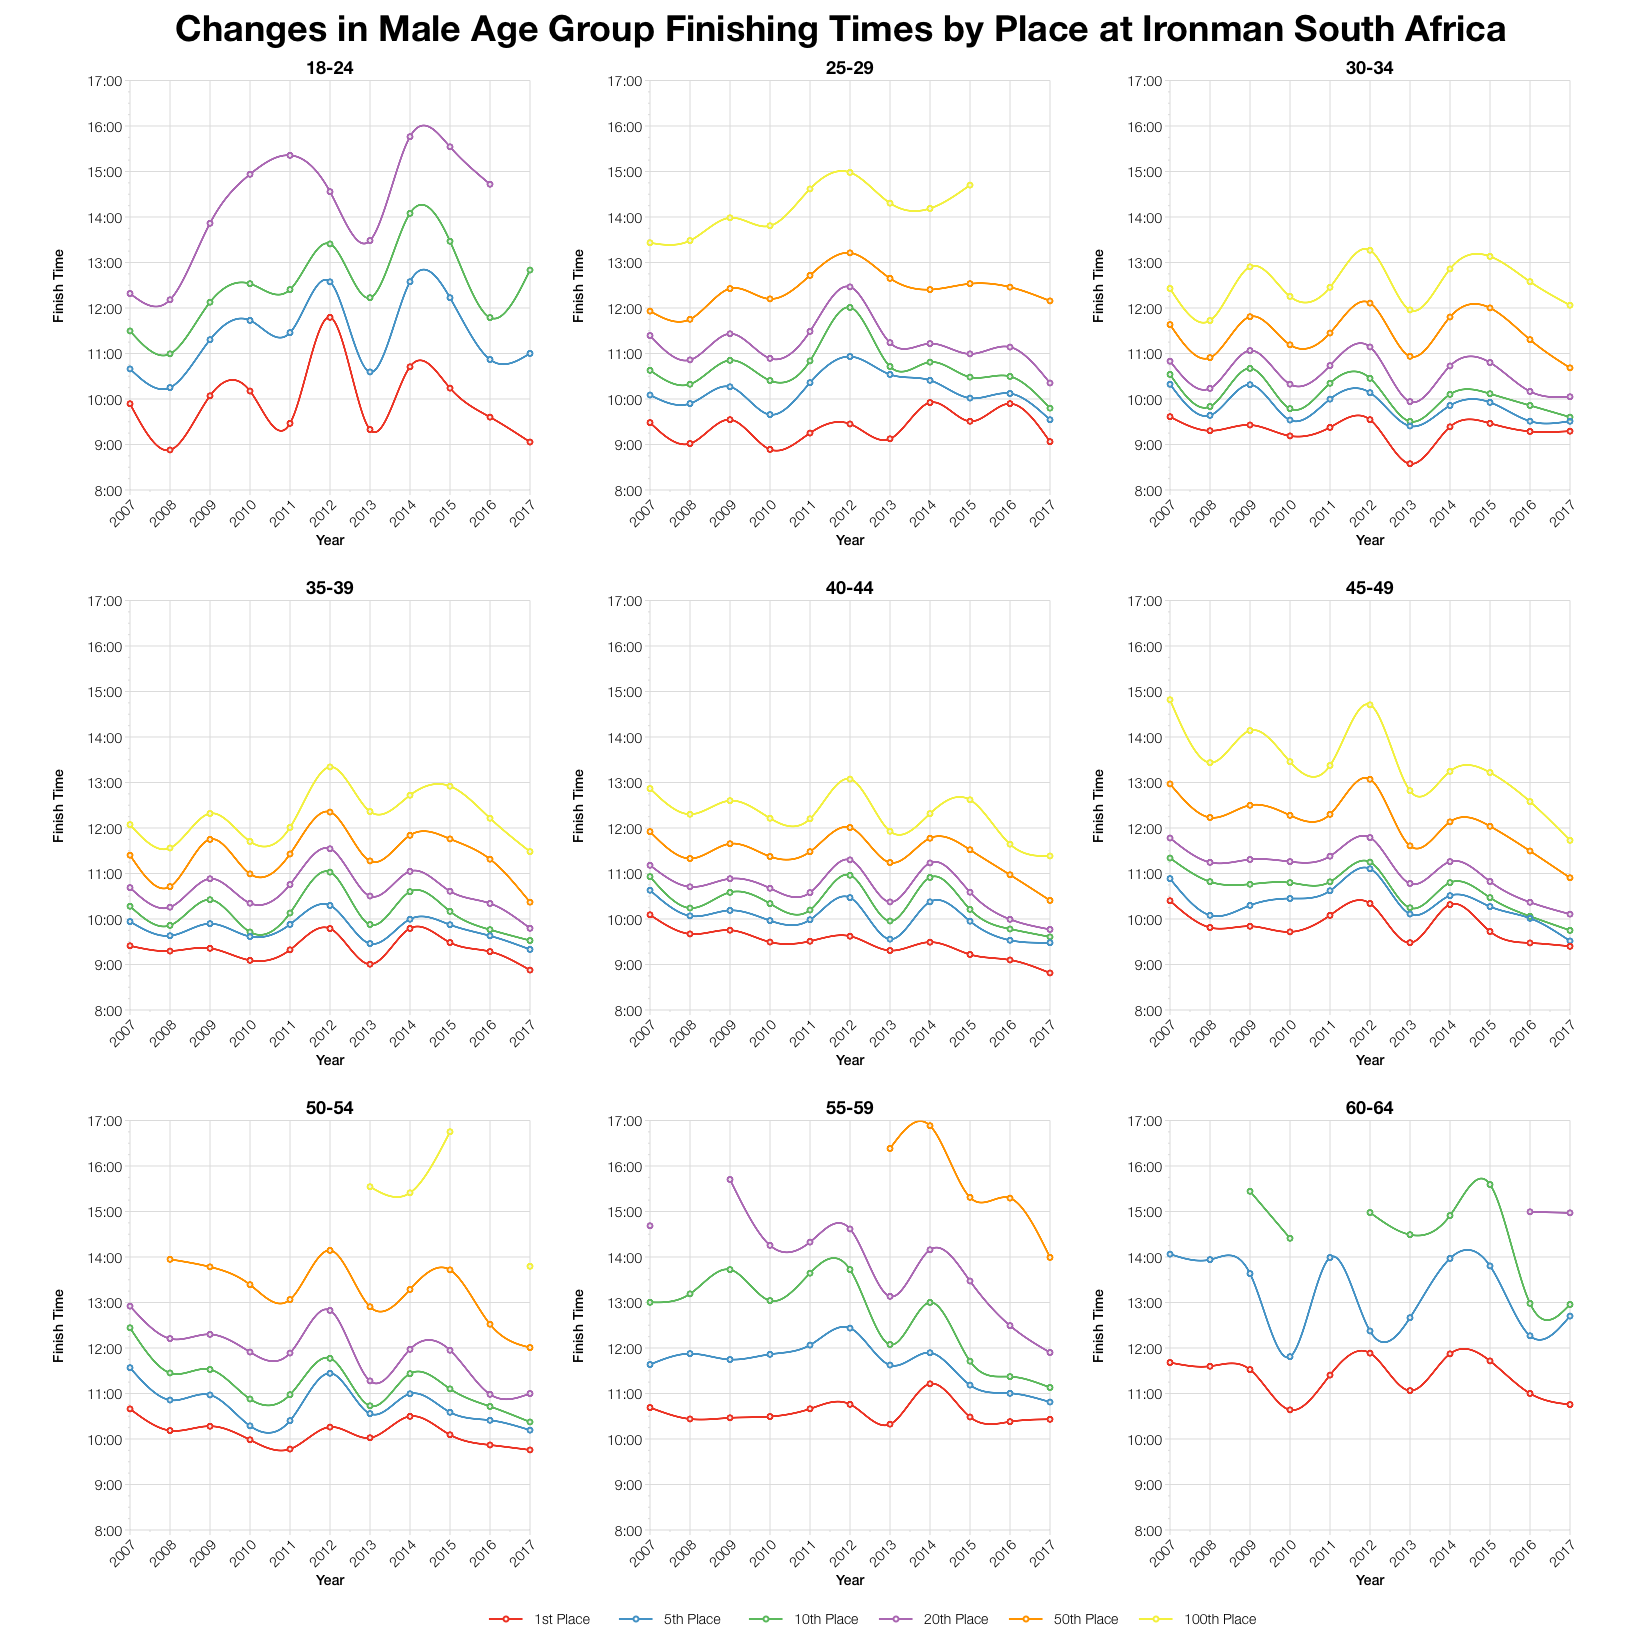
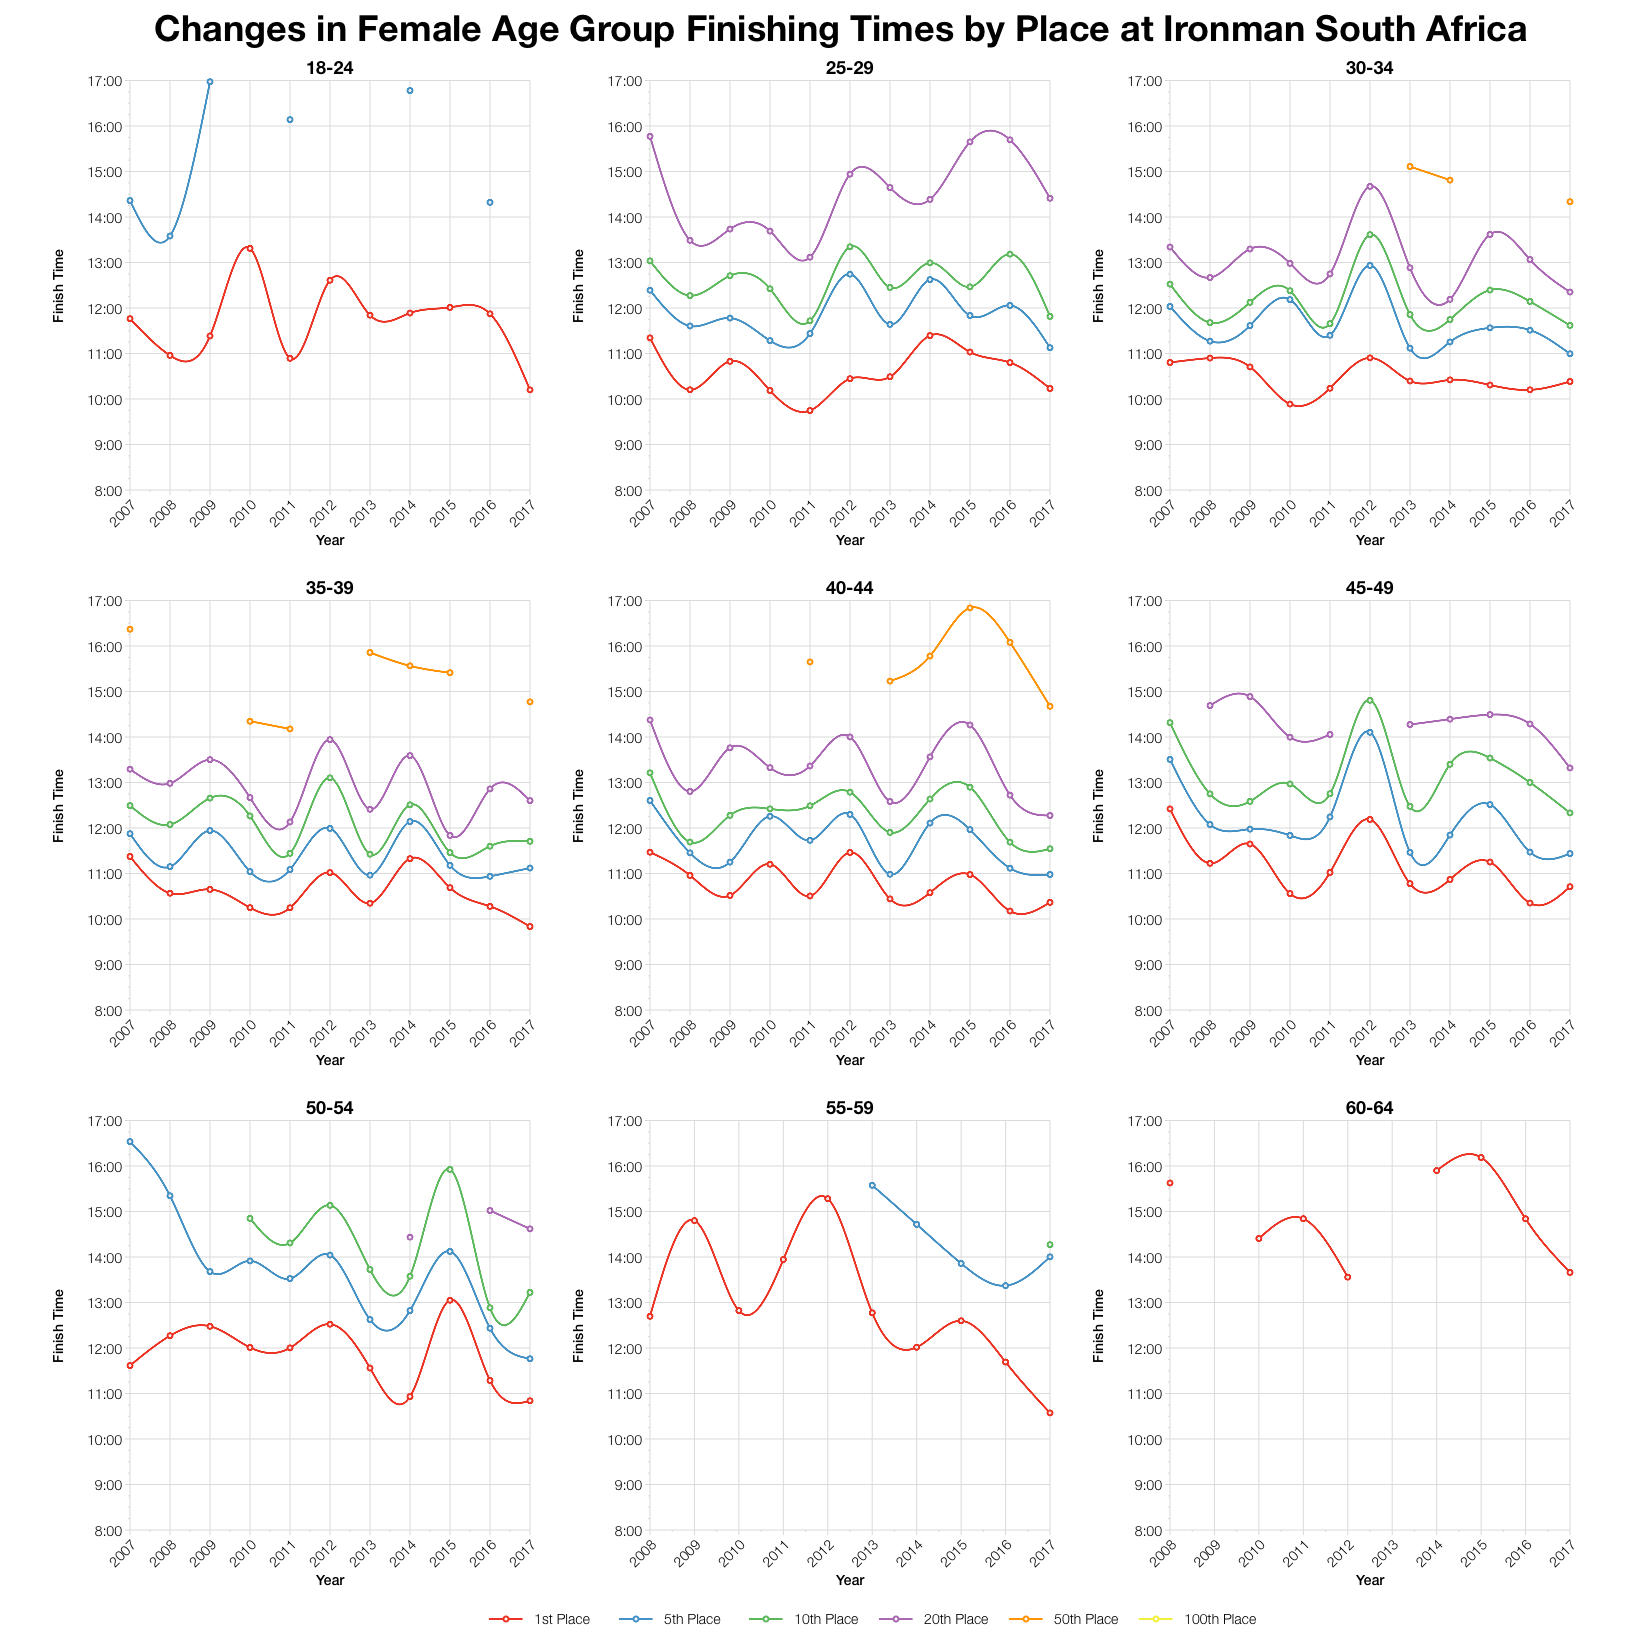
Comparing times across a range of finishers over the last decade places 2017 at the front. While it’s not always the fastest year, it is always one of the fastest. The trend over the last 4-5 years in particular is one of generally improving times. There are age groups that buck the trend, but for many there’s a consistent improvement here. This is most strongly seen in the biggest male age groups, from 35 to 50.
| Slots | Winner | Average Kona Qualifier | Final Qualifier | |
|---|---|---|---|---|
| M18-24 | 2 | 9:03:15 | 9:09:32 | 9:15:50 |
| M25-29 | 4 | 9:03:40 | 9:16:25 | 9:29:32 |
| M30-34 | 7 | 9:17:36 | 9:26:28 | 9:31:31 |
| M35-39 | 9 | 8:52:38 | 9:14:29 | 9:29:11 |
| M40-44 | 11 | 8:48:49 | 9:20:29 | 9:36:43 |
| M45-49 | 10 | 9:24:01 | 9:34:03 | 9:45:01 |
| M50-54 | 5 | 9:45:33 | 9:56:23 | 10:11:43 |
| M55-59 | 4 | 10:26:02 | 10:35:16 | 10:46:35 |
| M60-64 | 2 | 10:45:24 | 10:59:13 | 11:13:02 |
| M65-69 | 1 | 11:41:02 | 11:41:02 | 11:41:02 |
| M70-74 | 1 | 13:31:28 | 13:31:28 | 13:31:28 |
| F18-24 | 1 | 10:11:59 | 10:11:59 | 10:11:59 |
| F25-29 | 2 | 10:13:51 | 10:24:19 | 10:34:48 |
| F30-34 | 3 | 10:23:04 | 10:41:15 | 10:53:56 |
| F35-39 | 3 | 9:50:03 | 10:16:34 | 10:48:32 |
| F40-44 | 3 | 10:21:59 | 10:32:36 | 10:39:01 |
| F45-49 | 2 | 10:42:32 | 10:43:46 | 10:45:00 |
| F50-54 | 2 | 10:50:22 | 11:00:50 | 11:11:18 |
| F55-59 | 1 | 10:34:22 | 10:34:22 | 10:34:22 |
| F60-64 | 1 | 13:39:39 | 13:39:39 | 13:39:39 |
| F65-69 | 1 | 14:32:17 | 14:32:17 | 14:32:17 |
Based on the number of competitors and the slot count I’ve calculated the likely allocation of slots and from that the expected Kona qualification times in the results. Final slot allocation may vary based on exact start numbers and roll downs will affect the final qualifier times. You can find more information on qualifying times at Ironman races on my Kona qualification page.
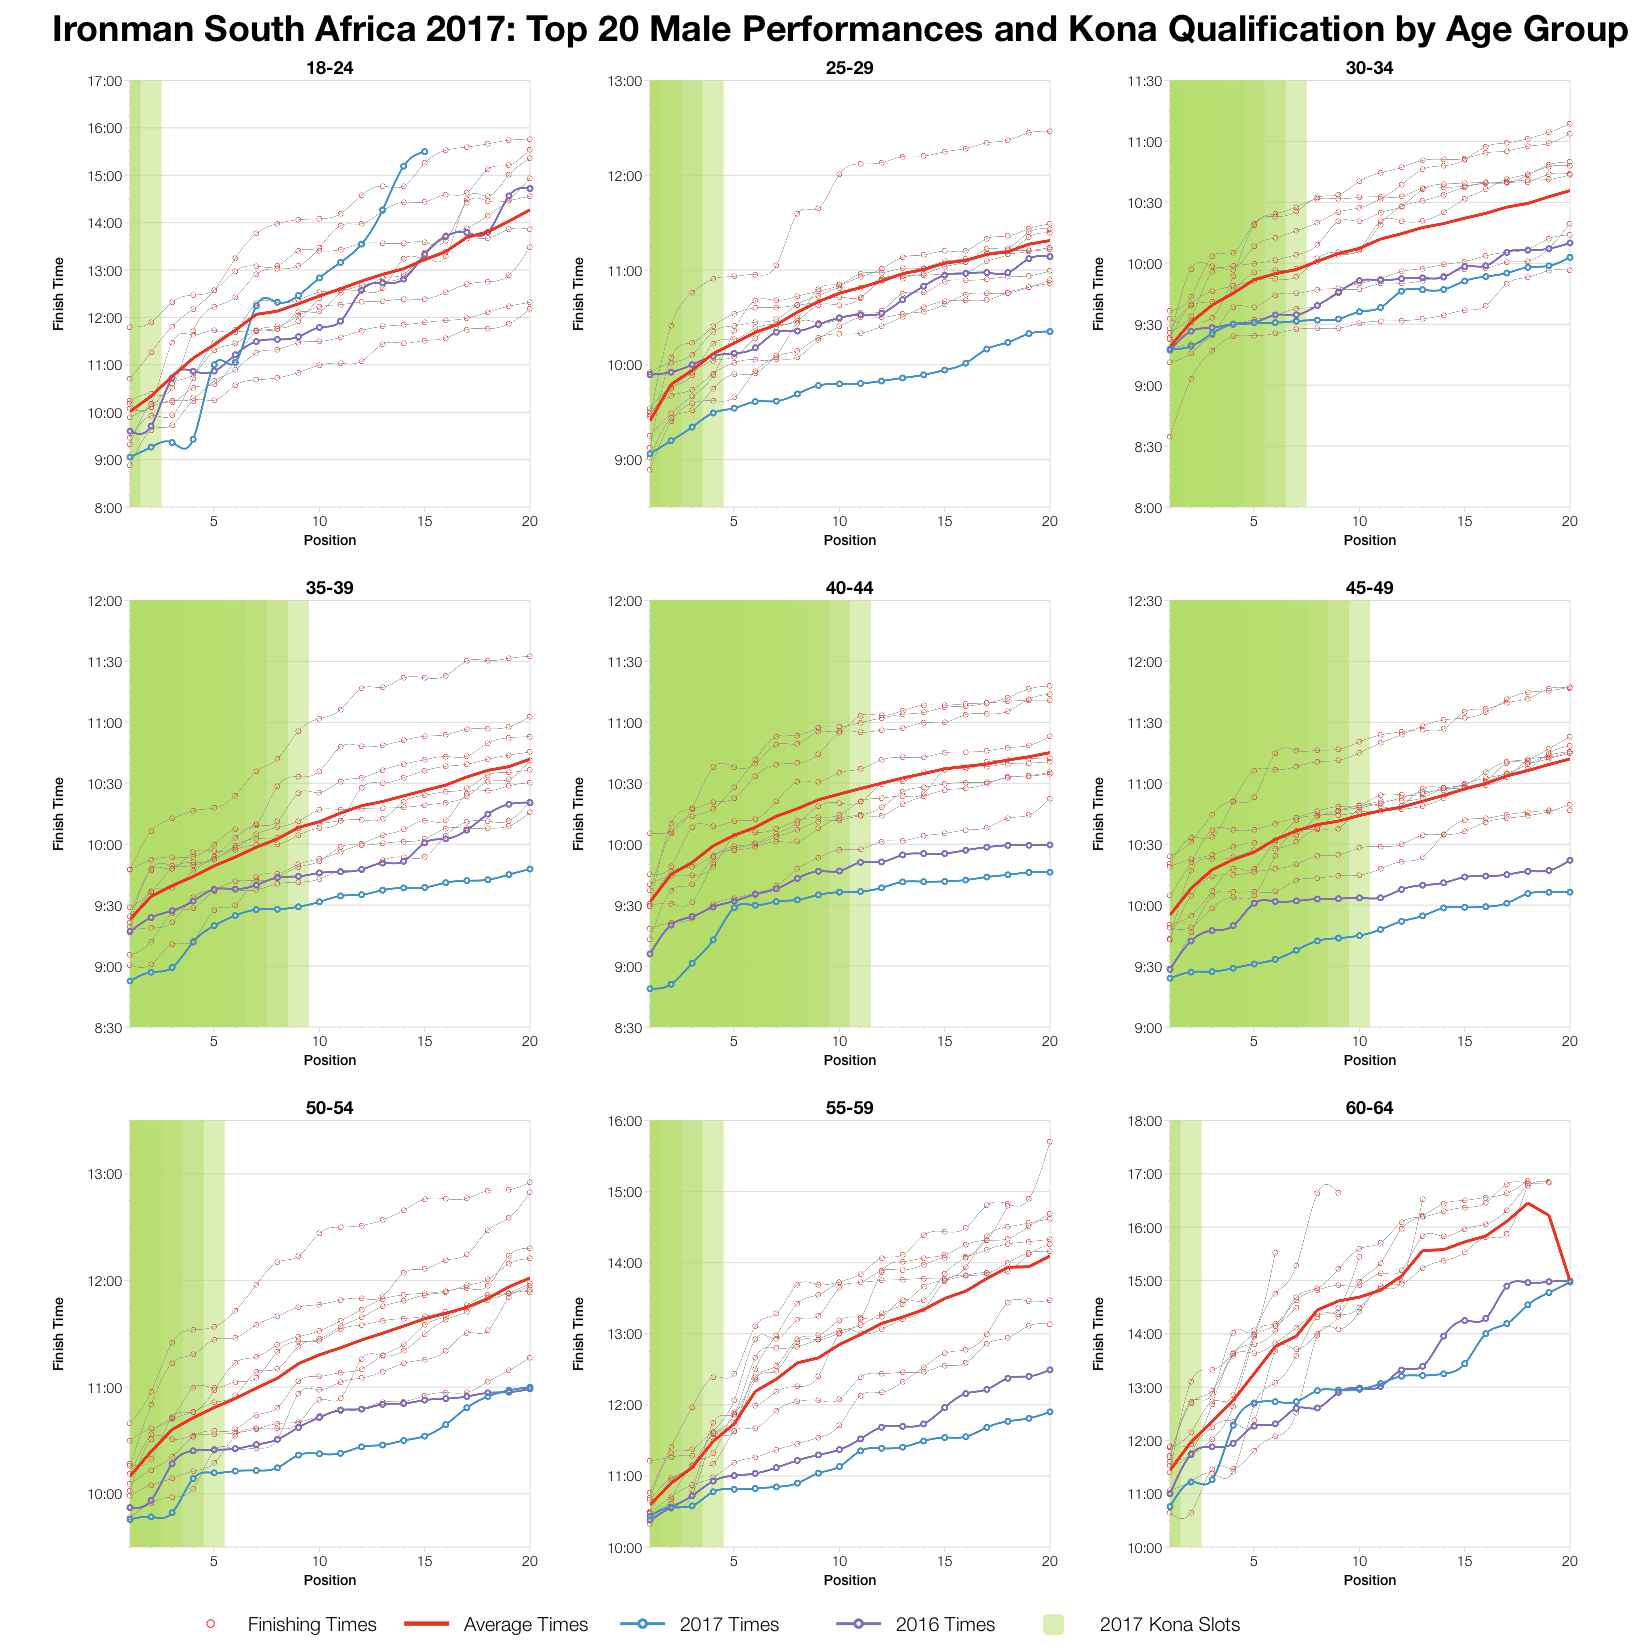
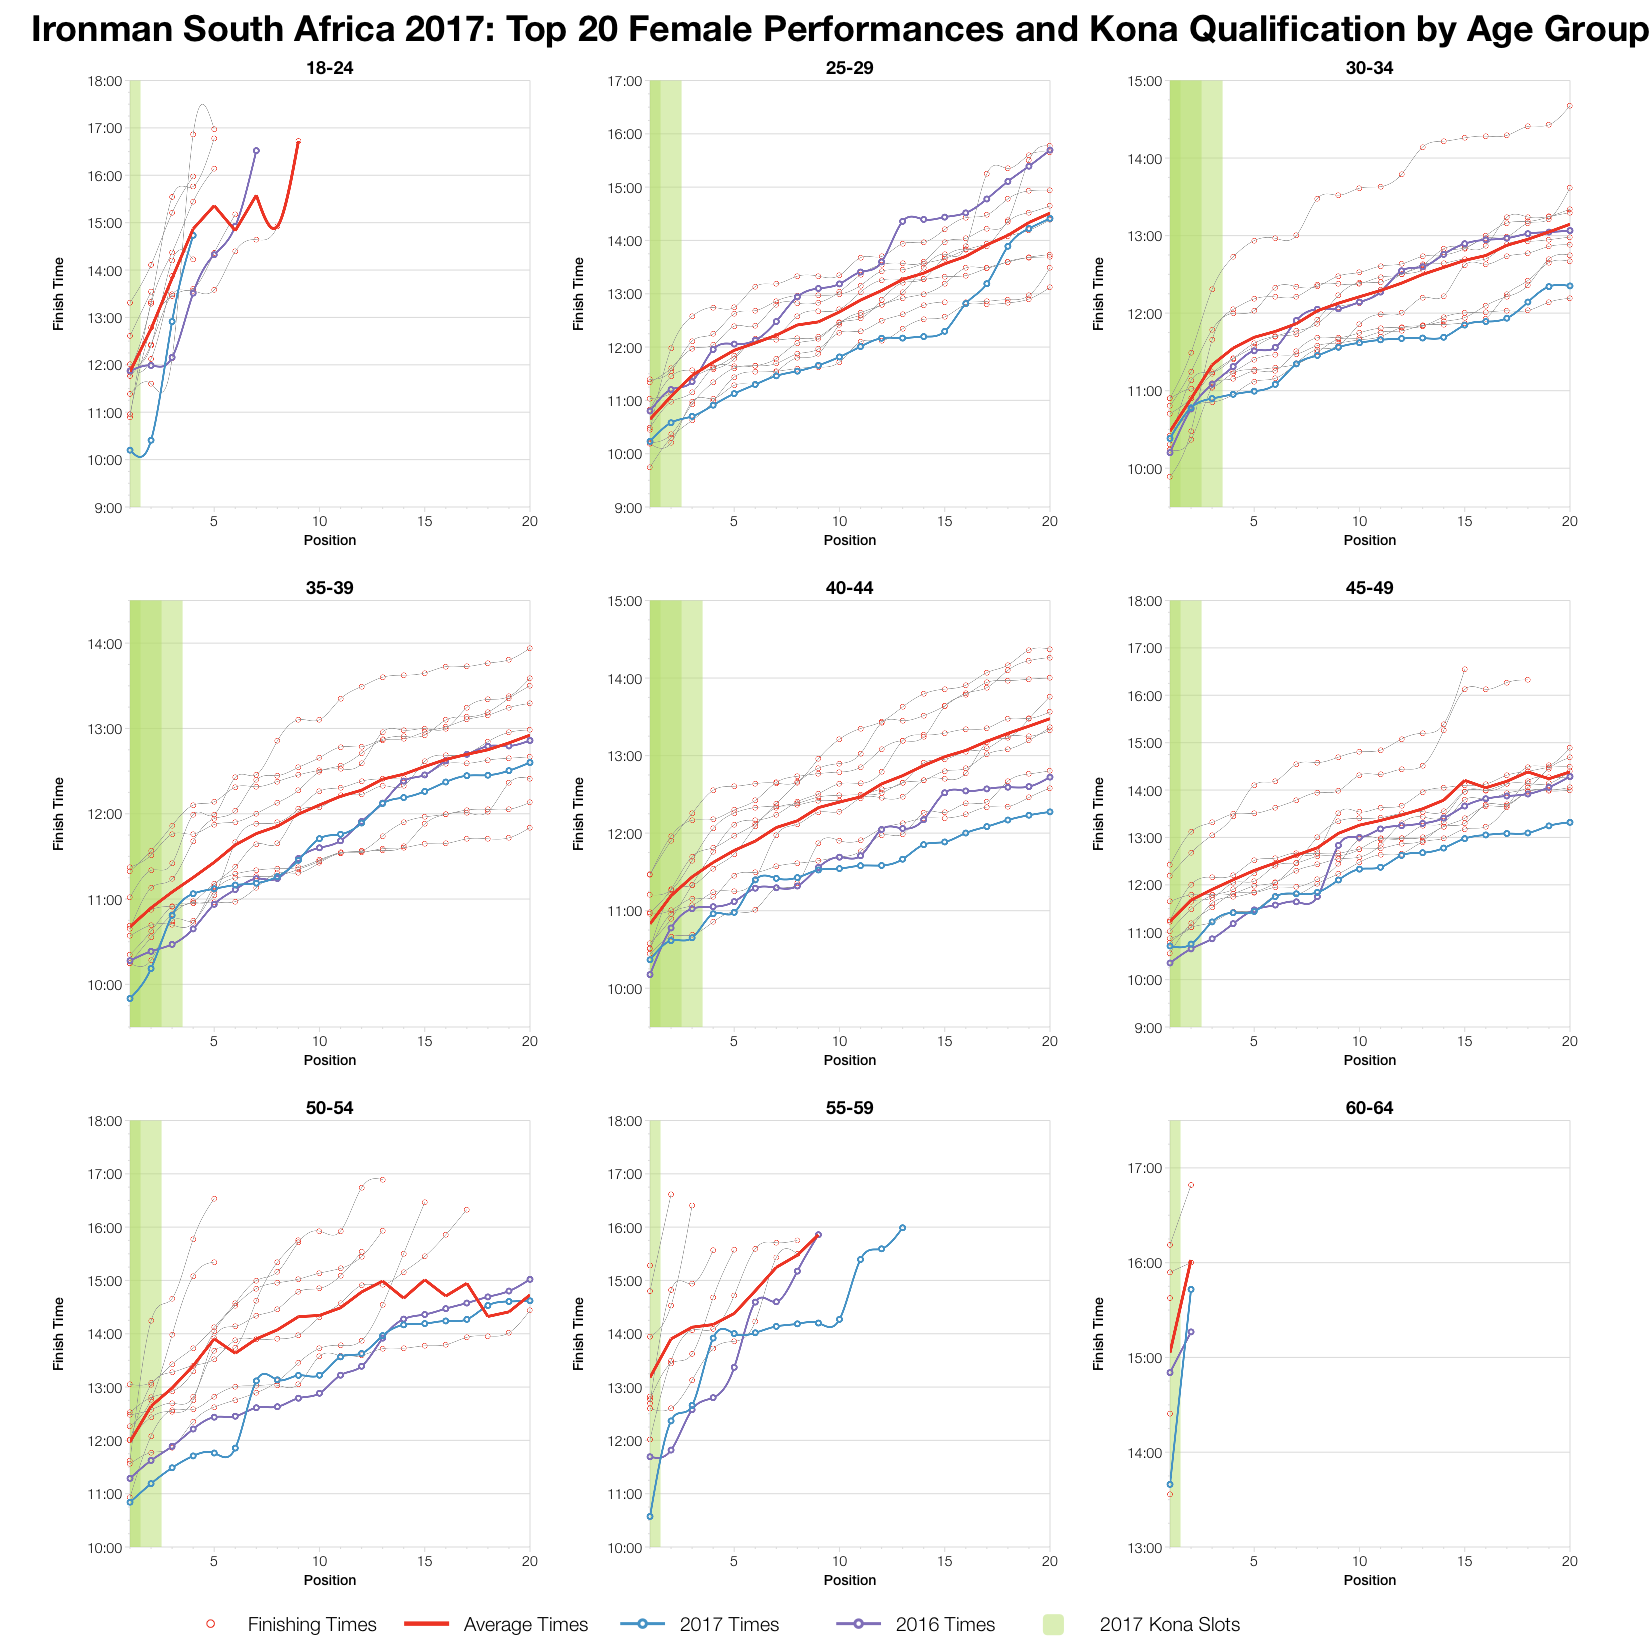
The final two charts looks at the times for the top twenty athletes in each age group over the last 10 years. What’s clear is that this year’s results generally trend ahead of the course averages (again course changes have an impact here) and while close to the 2016 results most stay ahead. It was fast at the front, competition was stiff for those Kona slots.
You can access a spreadsheet of the full results and splits from Ironman South Africa 2017 on my Google Drive.


