Ironman Australia took place a couple of days ago, but Ironman.com’s lack of complete results (presently cutting out at the 14 hour mark) has delayed my analysis. It’s fortunate that they also linked to the timing website’s results as that’s enabled me to put together my usual analysis. The quick summary: Ironman Australia carried 40 Kona slots and this year’s event looks to have been par for the course.
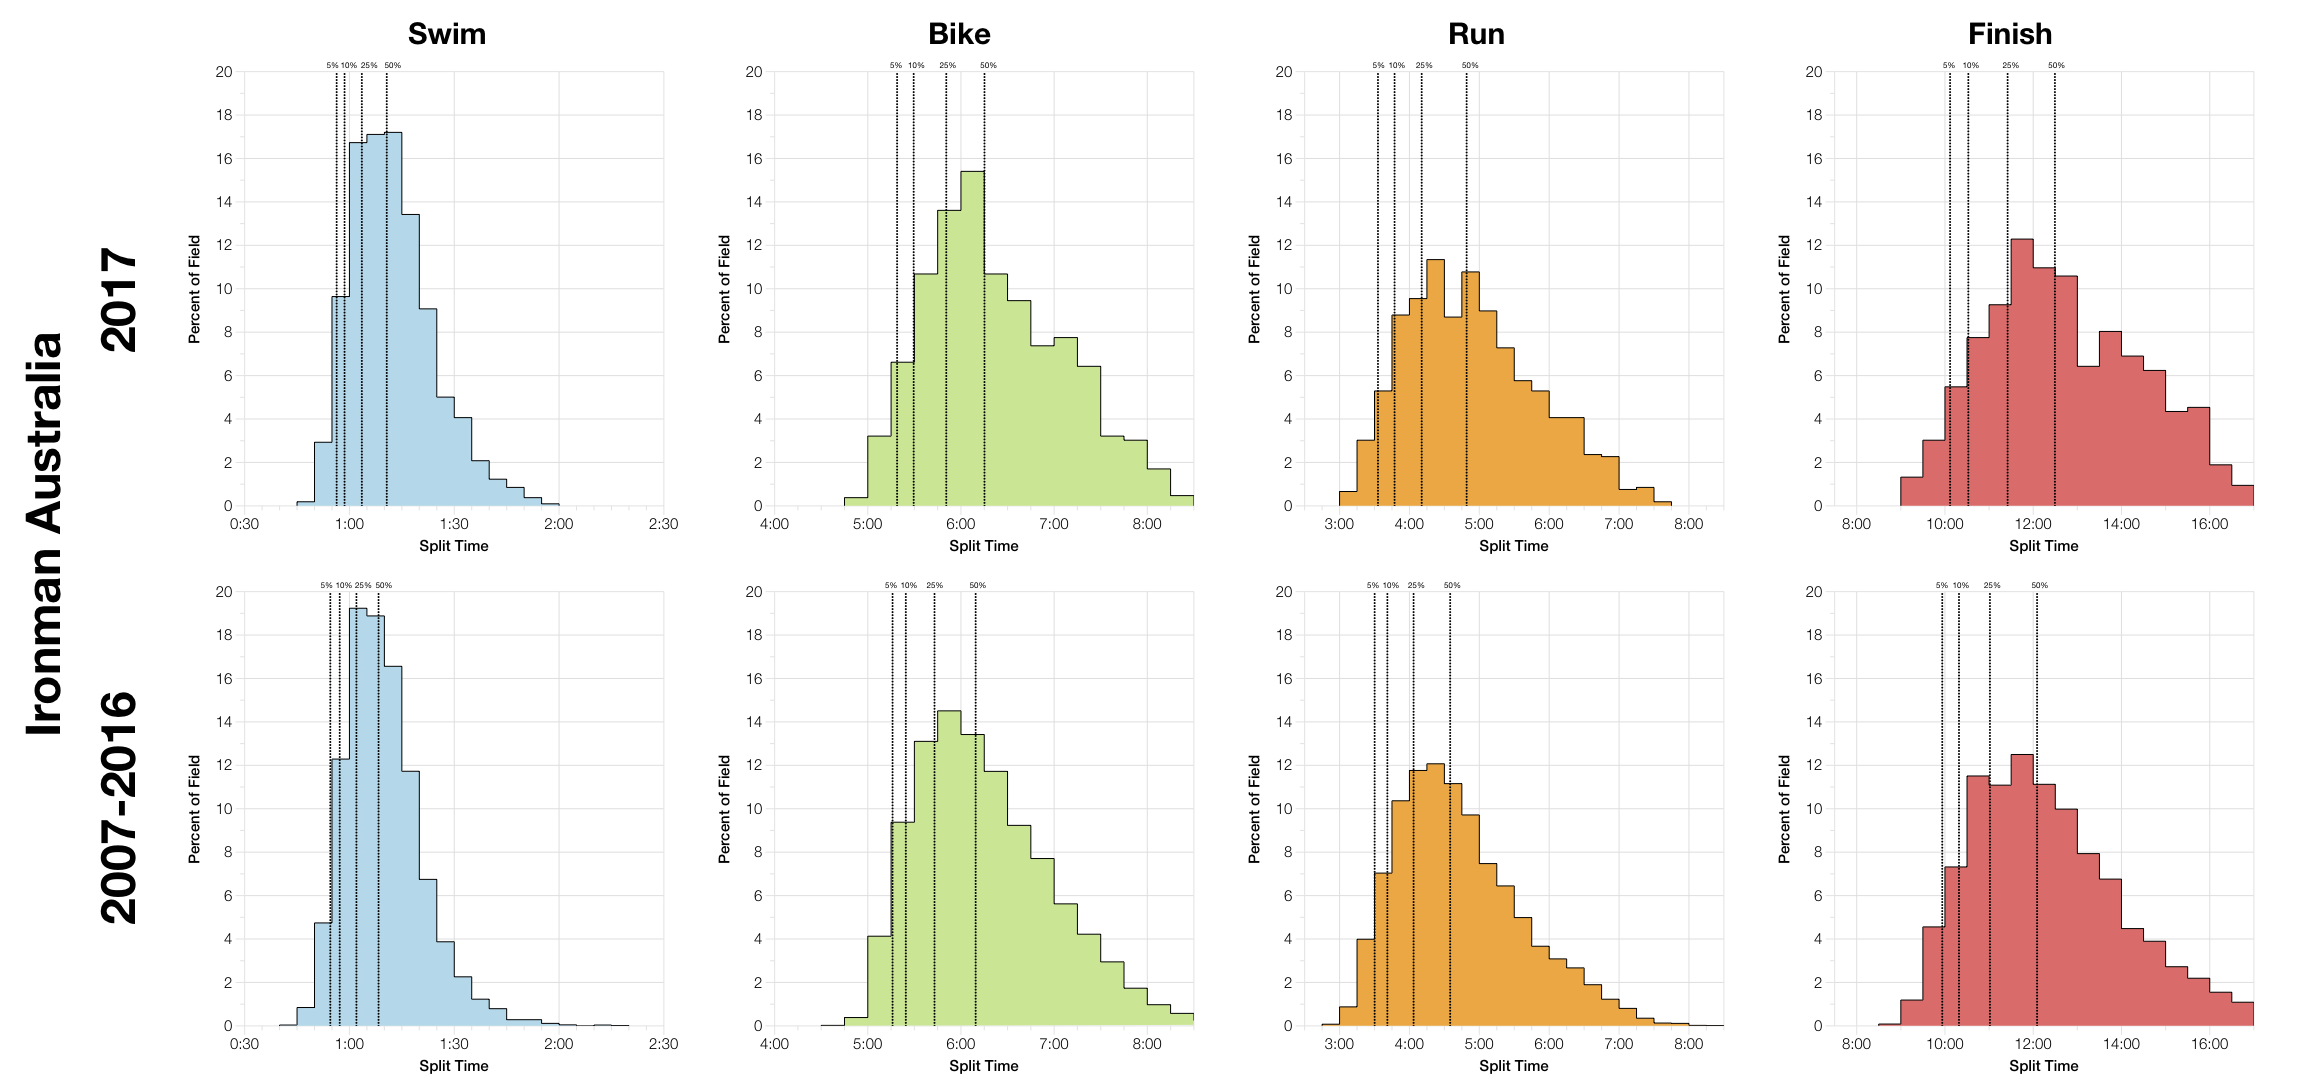
We can see that the distributions for the 2017 race trend slightly slower than the aggregate of the previous 10 years. These aren’t huge changes and one factor in this shift seems to be a jump in the number of athletes at 14 hours and later (and similarly 7 hours and later on the bike). This double peak in the overall splits fits with the idea of a growing division between those competing and those completing.
| Listed Athletes | Swim Finish | Swim DNS/DNF | Bike Finish | Bike DNF | Run Finish | Run DNF | Overall DNS/DNF | |
|---|---|---|---|---|---|---|---|---|
| 2005 | 1619 | 1539 | 4.9% | 1092 | 29% | 1366 | % | 15.6% |
| 2006 | 1580 | 1510 | 4.4% | 1475 | 2.3% | 1448 | 1.8% | 8.4% |
| 2007 | 1620 | 1521 | 6.1% | 1493 | 1.8% | 1458 | 2.3% | 10% |
| 2008 | 1543 | 1460 | 5.4% | 1432 | 1.9% | 1410 | 1.5% | 8.6% |
| 2009 | 1400 | 1323 | 5.5% | 1300 | 1.7% | 1282 | 1.4% | 8.4% |
| 2010 | 1482 | 1458 | 1.6% | 1422 | 2.5% | 1384 | 2.7% | 6.6% |
| 2011 | 1070 | 1048 | 2.1% | 1038 | 1% | 1016 | 2.1% | 5% |
| 2012 | 1348 | 1342 | 0.4% | 1323 | 1.4% | 1298 | 1.9% | 3.7% |
| 2013 | 1603 | 1423 | 11.2% | 1389 | 2.4% | 1352 | 2.7% | 15.7% |
| 2014 | 1699 | 1505 | 11.4% | 1480 | 1.7% | 1451 | 2% | 14.6% |
| 2015 | 1530 | 1365 | 10.8% | 1325 | 2.9% | 1282 | 3.2% | 16.2% |
| 2016 | 1355 | 1345 | 0.7% | 1325 | 1.5% | 1294 | 2.3% | 4.5% |
| 2017 | 1132 | 1131 | 0.1% | 1099 | 2.8% | 1072 | 2.5% | 5.3% |
DNF rates for the race fall within race norms. Perhaps moving towards the high end for both bike and run, but the figures are hardly exceptional. There’s nothing here to suggest the race was in any way unusual for the course.
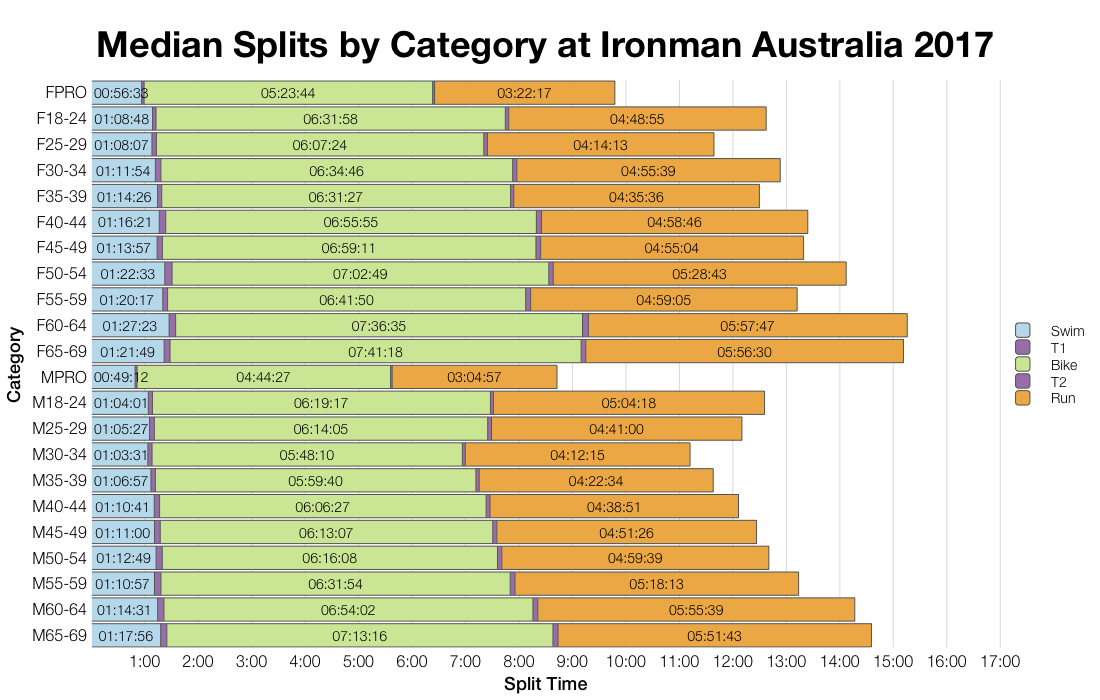
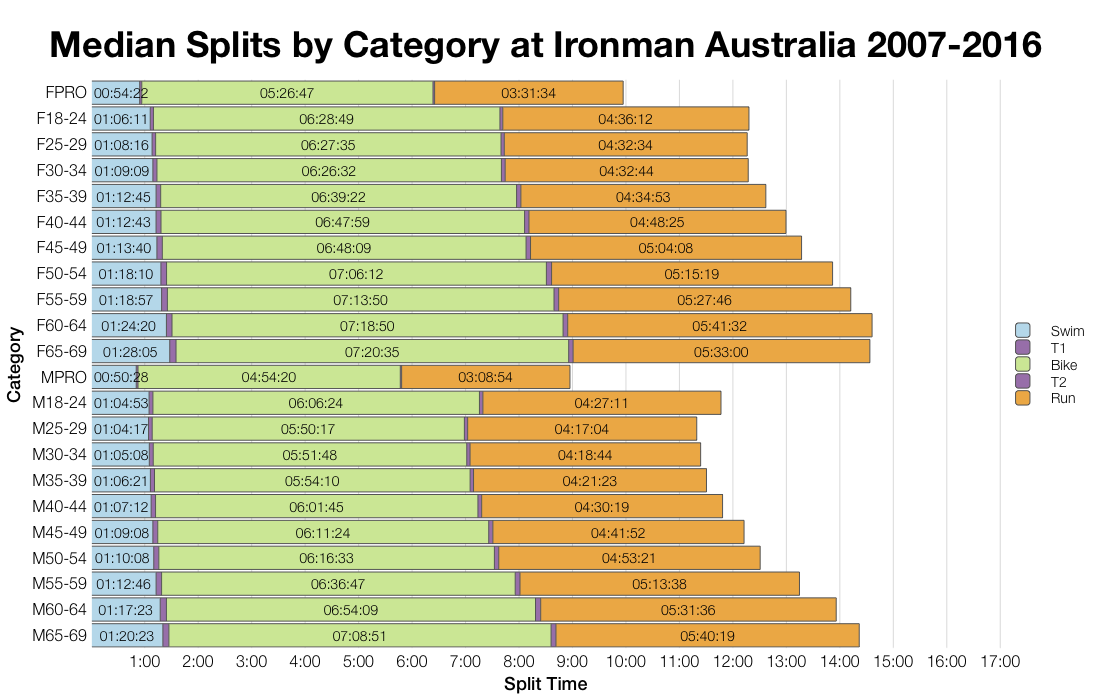
Median comparison across age groups shows small variations and small signs of a slower race, but again nothing is significant. On the other hand pro medians are faster than the aggregate – the race certainly wasn’t slower at the front.
| Count | Percentage | |
|---|---|---|
| Australia | 926 | 81.8 |
| New Zealand | 30 | 2.7 |
| Philippines | 26 | 2.3 |
| United Kingdom | 24 | 2.1 |
| Japan | 20 | 1.8 |
| United States | 15 | 1.3 |
| Singapore | 14 | 1.2 |
| Thailand | 10 | 0.9 |
| China | 8 | 0.7 |
| Hong Kong | 7 | 0.6 |
| Country | Percentage of Slots | Percentage of Field |
|---|---|---|
| Australia | 85.0 | 81.8 |
| South Africa | 5.0 | 0.4 |
| New Zealand | 5.0 | 2.7 |
| Japan | 2.5 | 1.8 |
| United Kingdom | 2.5 | 2.1 |
The majority of athletes are Australian of course and they take slots in proportion to their size. The remainder of the field is spread across a mix of mostly pacific or southern hemisphere countries.
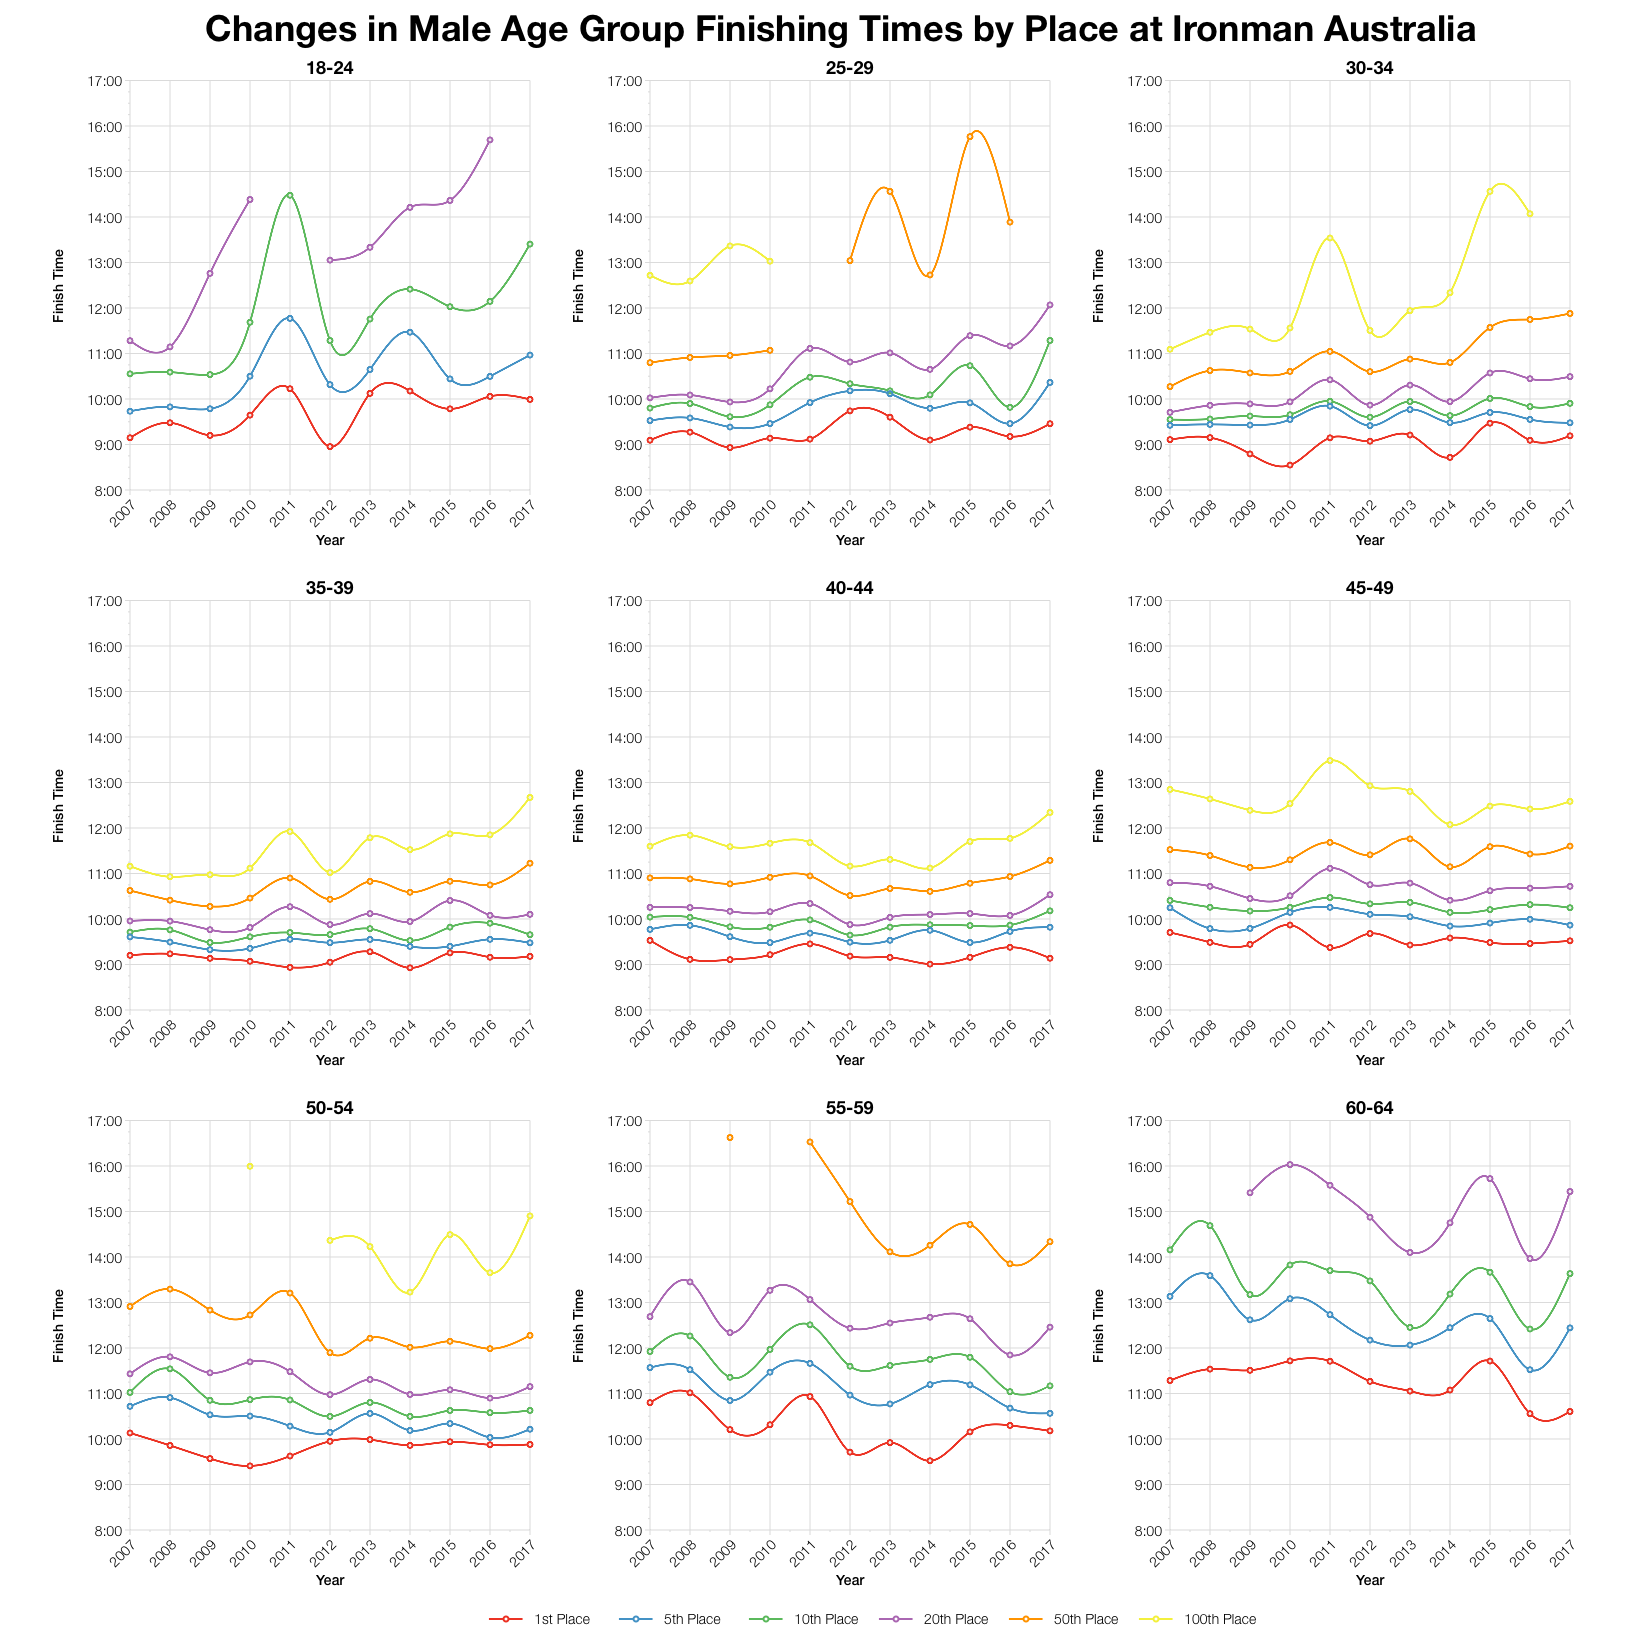
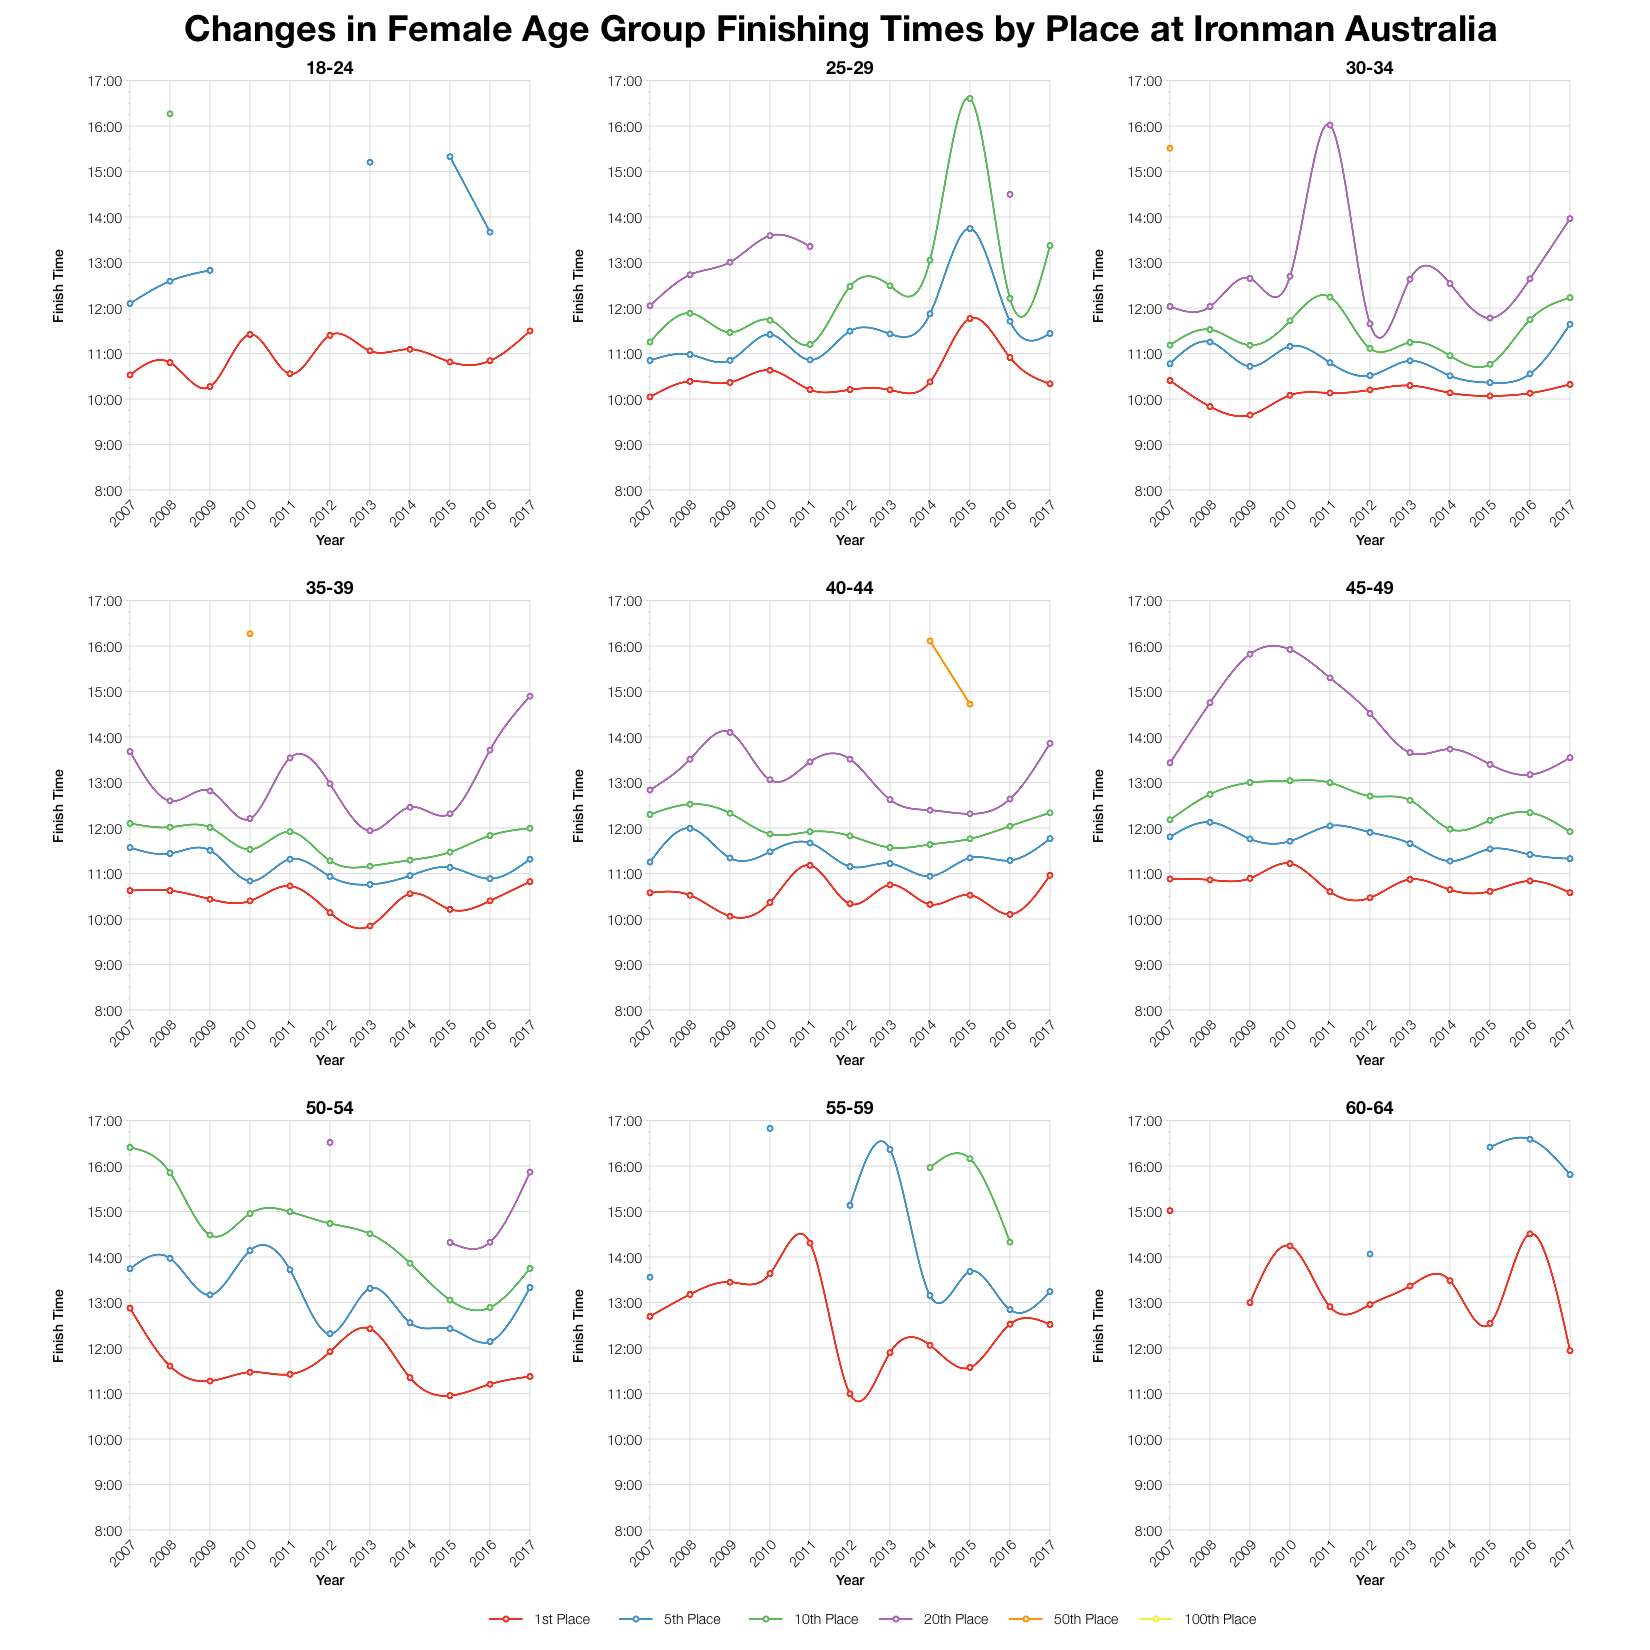
Tracking finishing place and times over the last 10 years of results shows that this year’s race doesn’t deviate too much from previous years. One point of note is that as we move back through the field we do see times dropping off more noticeably. While the front of the race is consistent with past results, the back appears to have slowed.
| Slots | Winner | Average Kona Qualifier | Final Qualifier | |
|---|---|---|---|---|
| M18-24 | 1 | 9:59:28 | 9:59:28 | 9:59:28 |
| M25-29 | 2 | 9:27:21 | 9:31:50 | 9:36:19 |
| M30-34 | 3 | 9:11:24 | 9:17:02 | 9:20:10 |
| M35-39 | 4 | 9:10:46 | 9:17:05 | 9:23:28 |
| M40-44 | 4 | 9:08:20 | 9:34:27 | 9:47:42 |
| M45-49 | 4 | 9:31:12 | 9:39:12 | 9:49:16 |
| M50-54 | 3 | 9:52:49 | 10:02:57 | 10:10:57 |
| M55-59 | 2 | 10:10:43 | 10:17:36 | 10:24:30 |
| M60-64 | 1 | 10:36:16 | 10:36:16 | 10:36:16 |
| M65-69 | 1 | 11:37:36 | 11:37:36 | 11:37:36 |
| M70-74 | 1 | 14:28:31 | 14:28:31 | 14:28:31 |
| F18-24 | 1 | 11:29:42 | 11:29:42 | 11:29:42 |
| F25-29 | 1 | 10:19:57 | 10:19:57 | 10:19:57 |
| F30-34 | 2 | 10:19:13 | 10:41:03 | 11:02:53 |
| F35-39 | 2 | 10:49:09 | 10:50:28 | 10:51:48 |
| F40-44 | 2 | 10:57:43 | 11:01:22 | 11:05:02 |
| F45-49 | 2 | 10:34:36 | 10:53:38 | 11:12:41 |
| F50-54 | 1 | 11:22:27 | 11:22:27 | 11:22:27 |
| F55-59 | 1 | 12:31:05 | 12:31:05 | 12:31:05 |
| F60-64 | 1 | 11:56:28 | 11:56:28 | 11:56:28 |
| F65-69 | 1 | 14:51:38 | 14:51:38 | 14:51:38 |
I’ve estimated the slot allocation based on the number of athletes in the start list and used this to calculate likely qualifying times in each age group. The actual numbers will vary based on final start numbers and also roll downs that don’t factor into my calculations. You can check and compare these numbers against other races on my Kona qualification page.
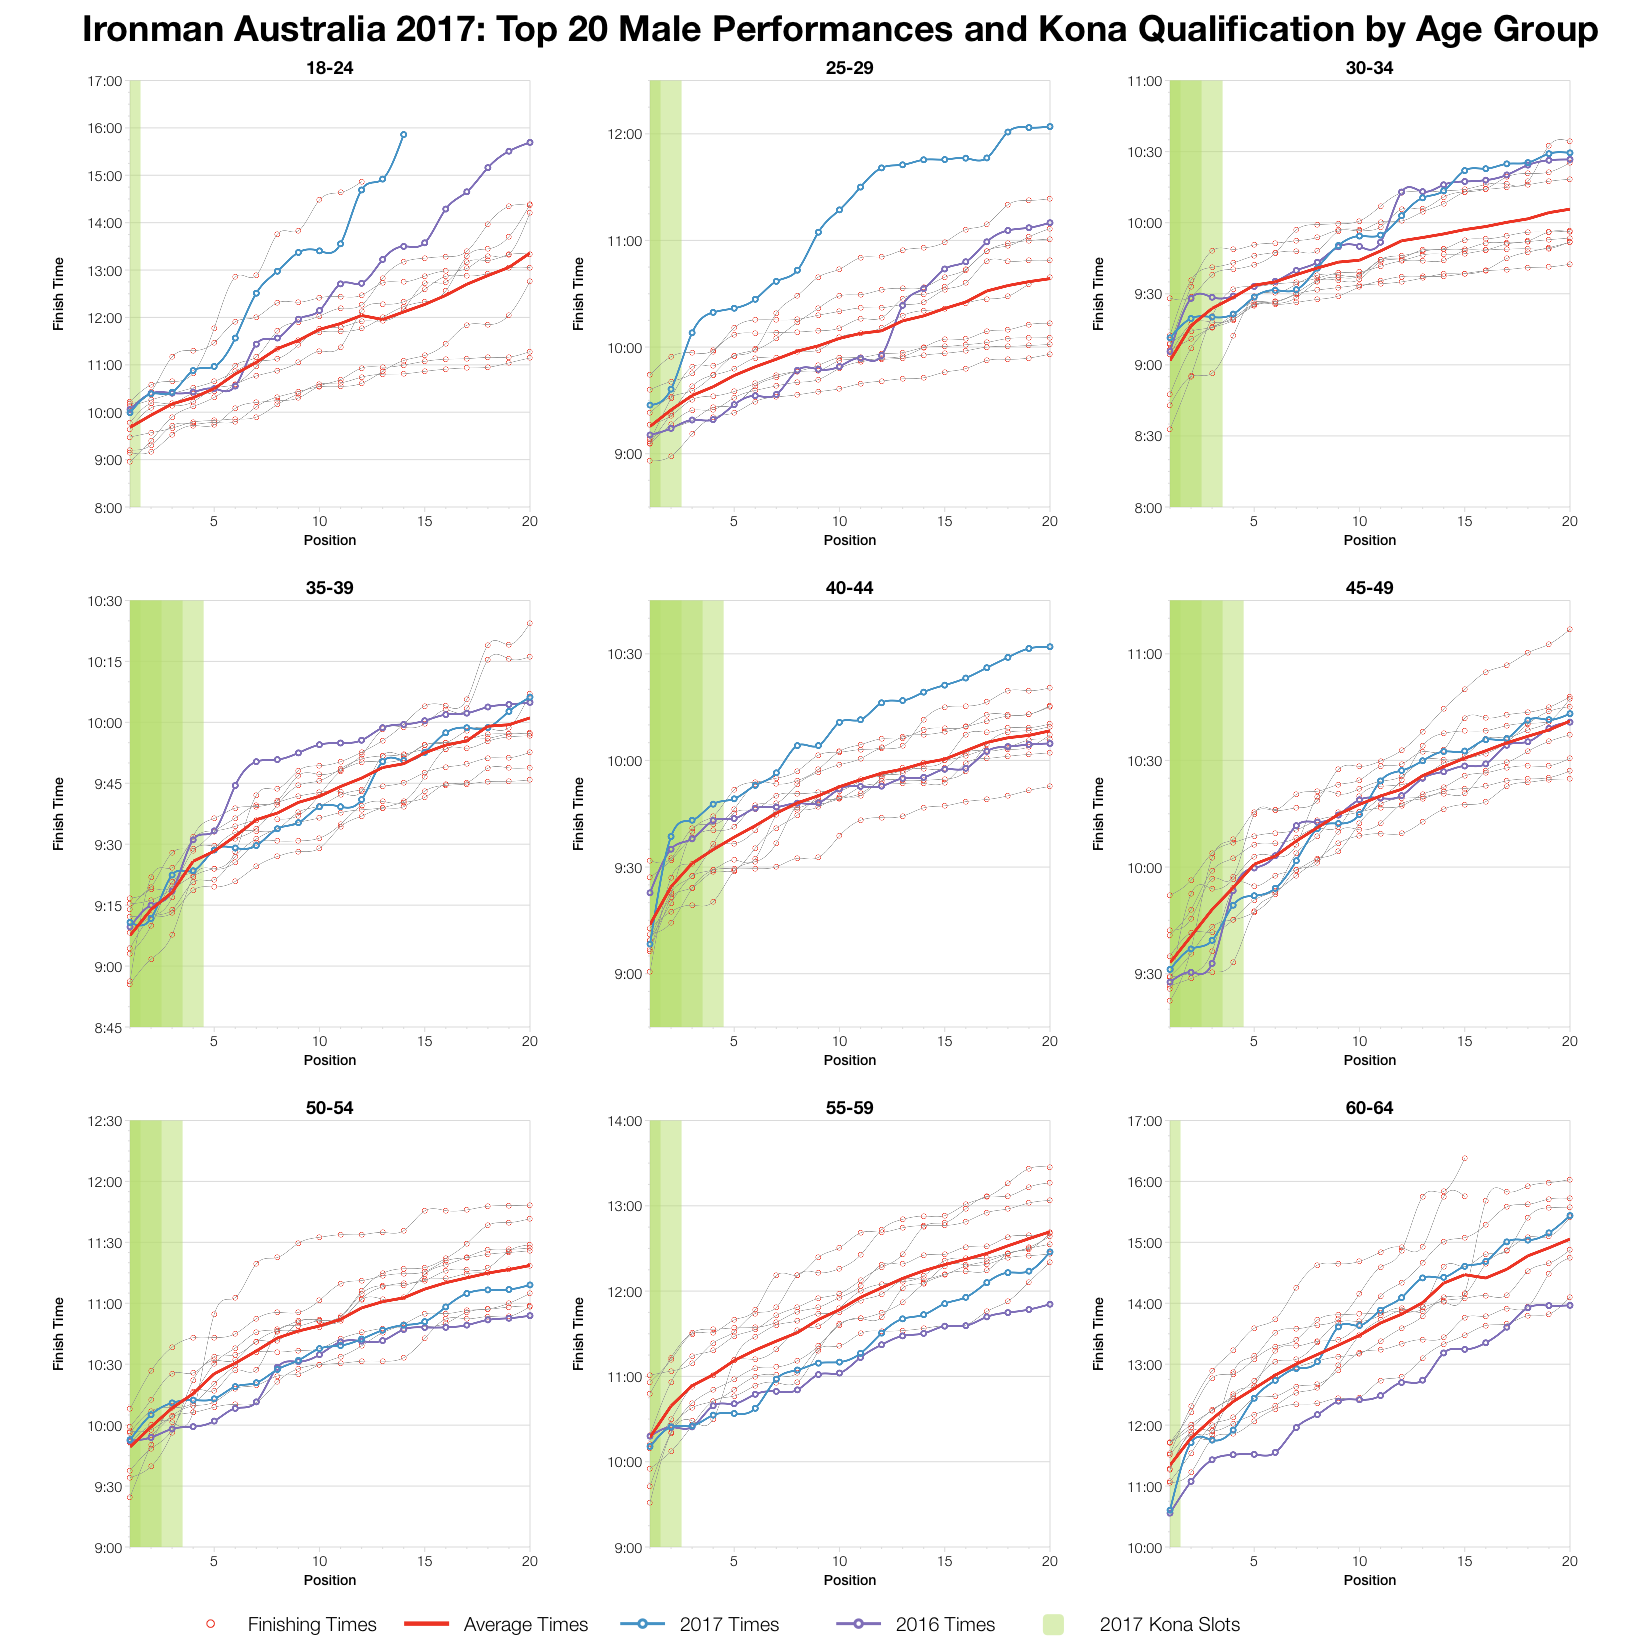
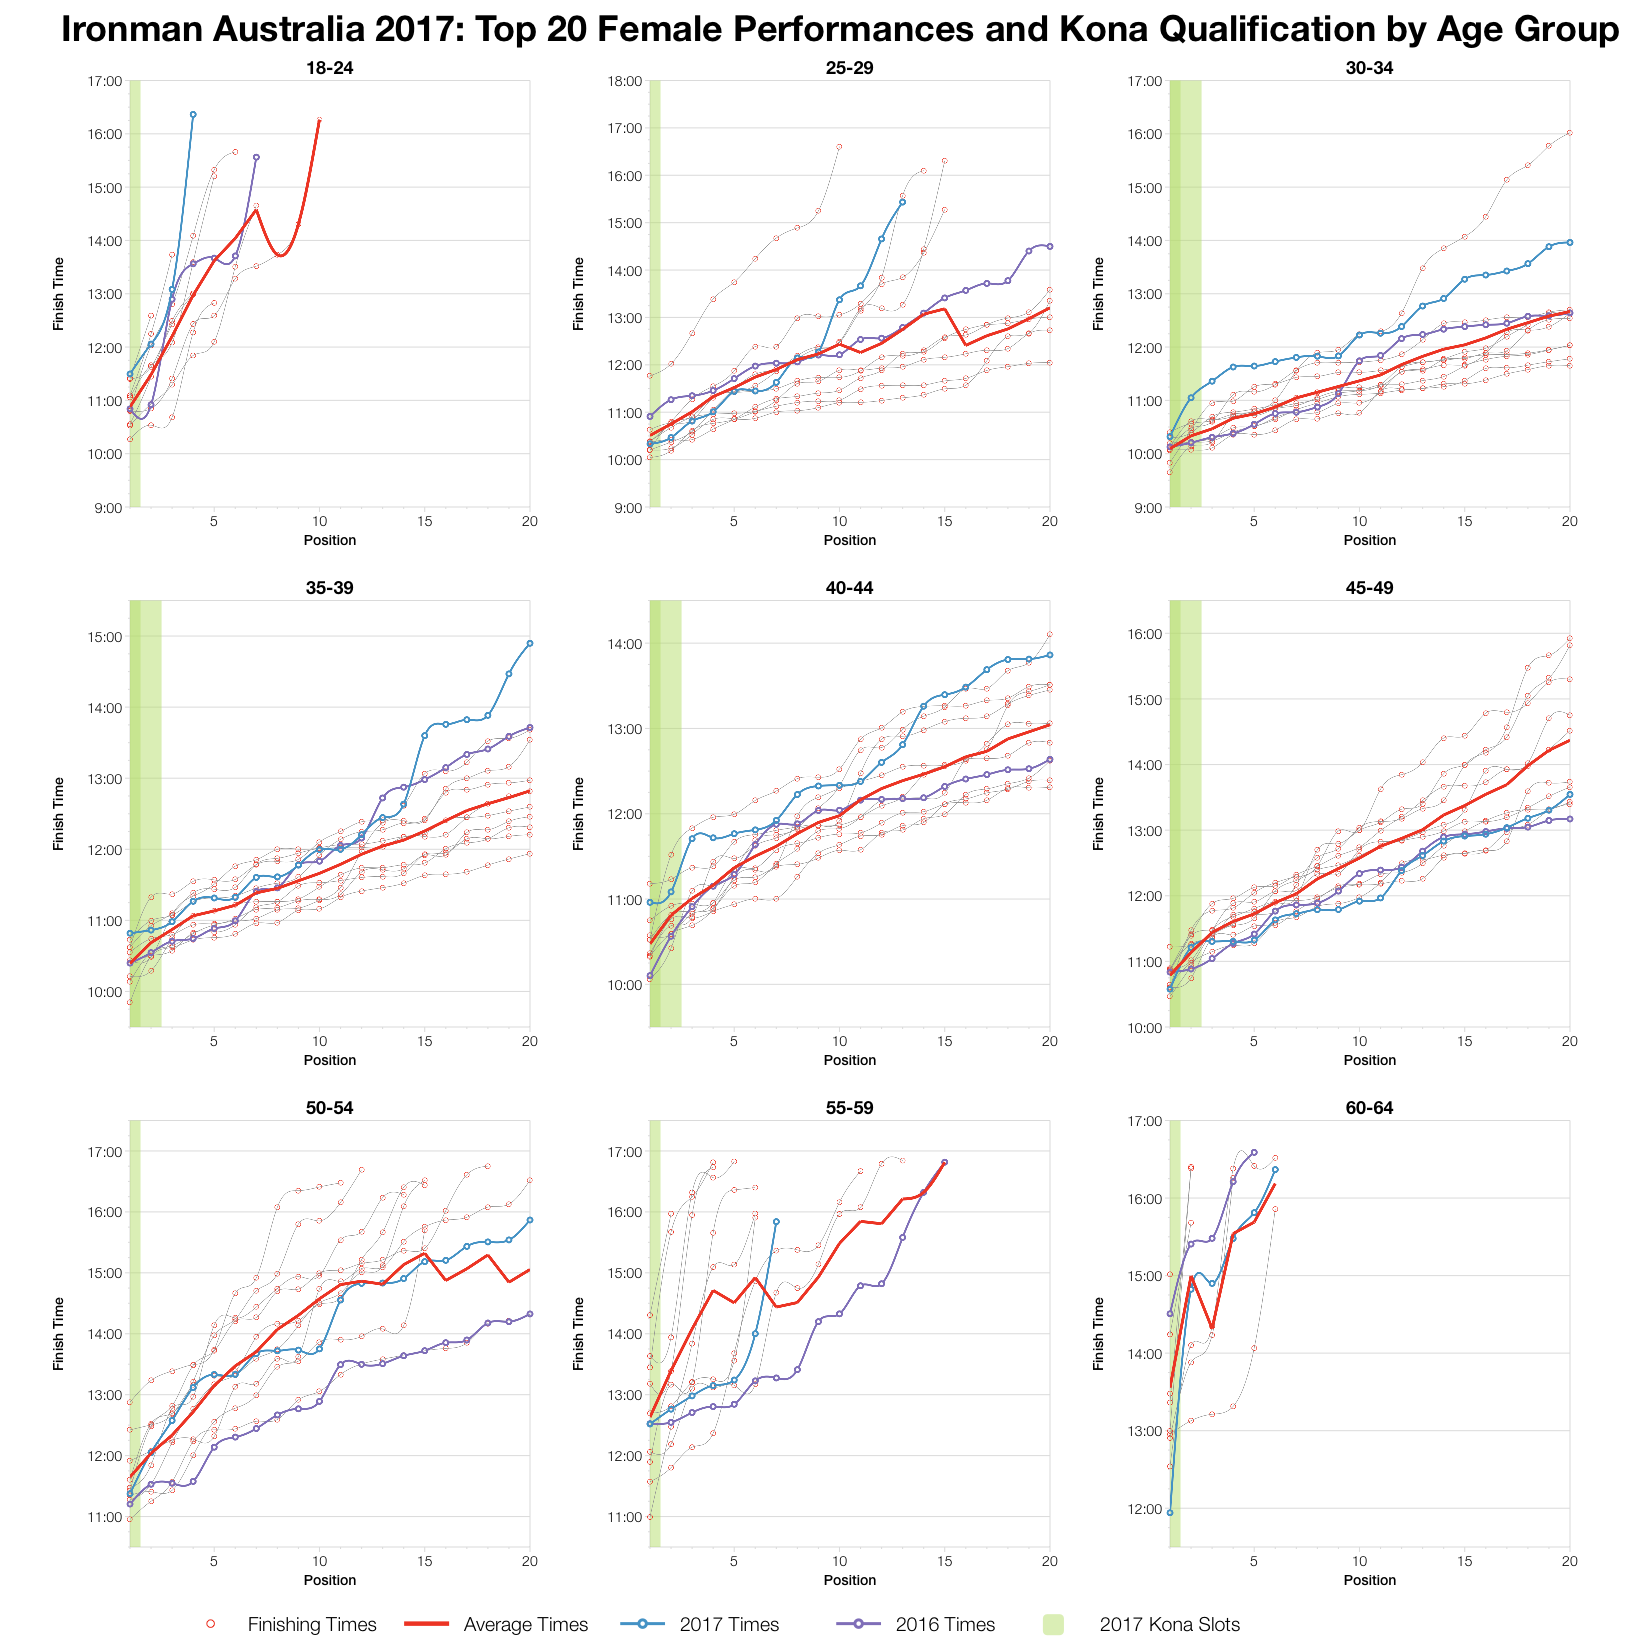
Finally, a looks at performances for the top twenty athletes in each age group. The trend here is average – sometimes a little faster, sometimes a little slower – it varies with age group. There’s no clear cut shift towards faster or slower times for the front of pack athletes. So, it looks to have been a typical year of racing for Kona slots in Port Macquarie, but with apparent growth at the back of the field.
You can access a spreadsheet of the results from Ironman Australia 2017 on my Google Drive.


