There were no full distance Ironman brand events over the weekend, but there was a 70.3 here in the UK. Ironman Staffordshire 70.3 was held for the third time in what were unusually hot conditions for the UK (temperatures hitting 30C). As you would expect, when temperatures are higher than normal a race slows down. This was the slowest year by far for Staffordshire 70.3
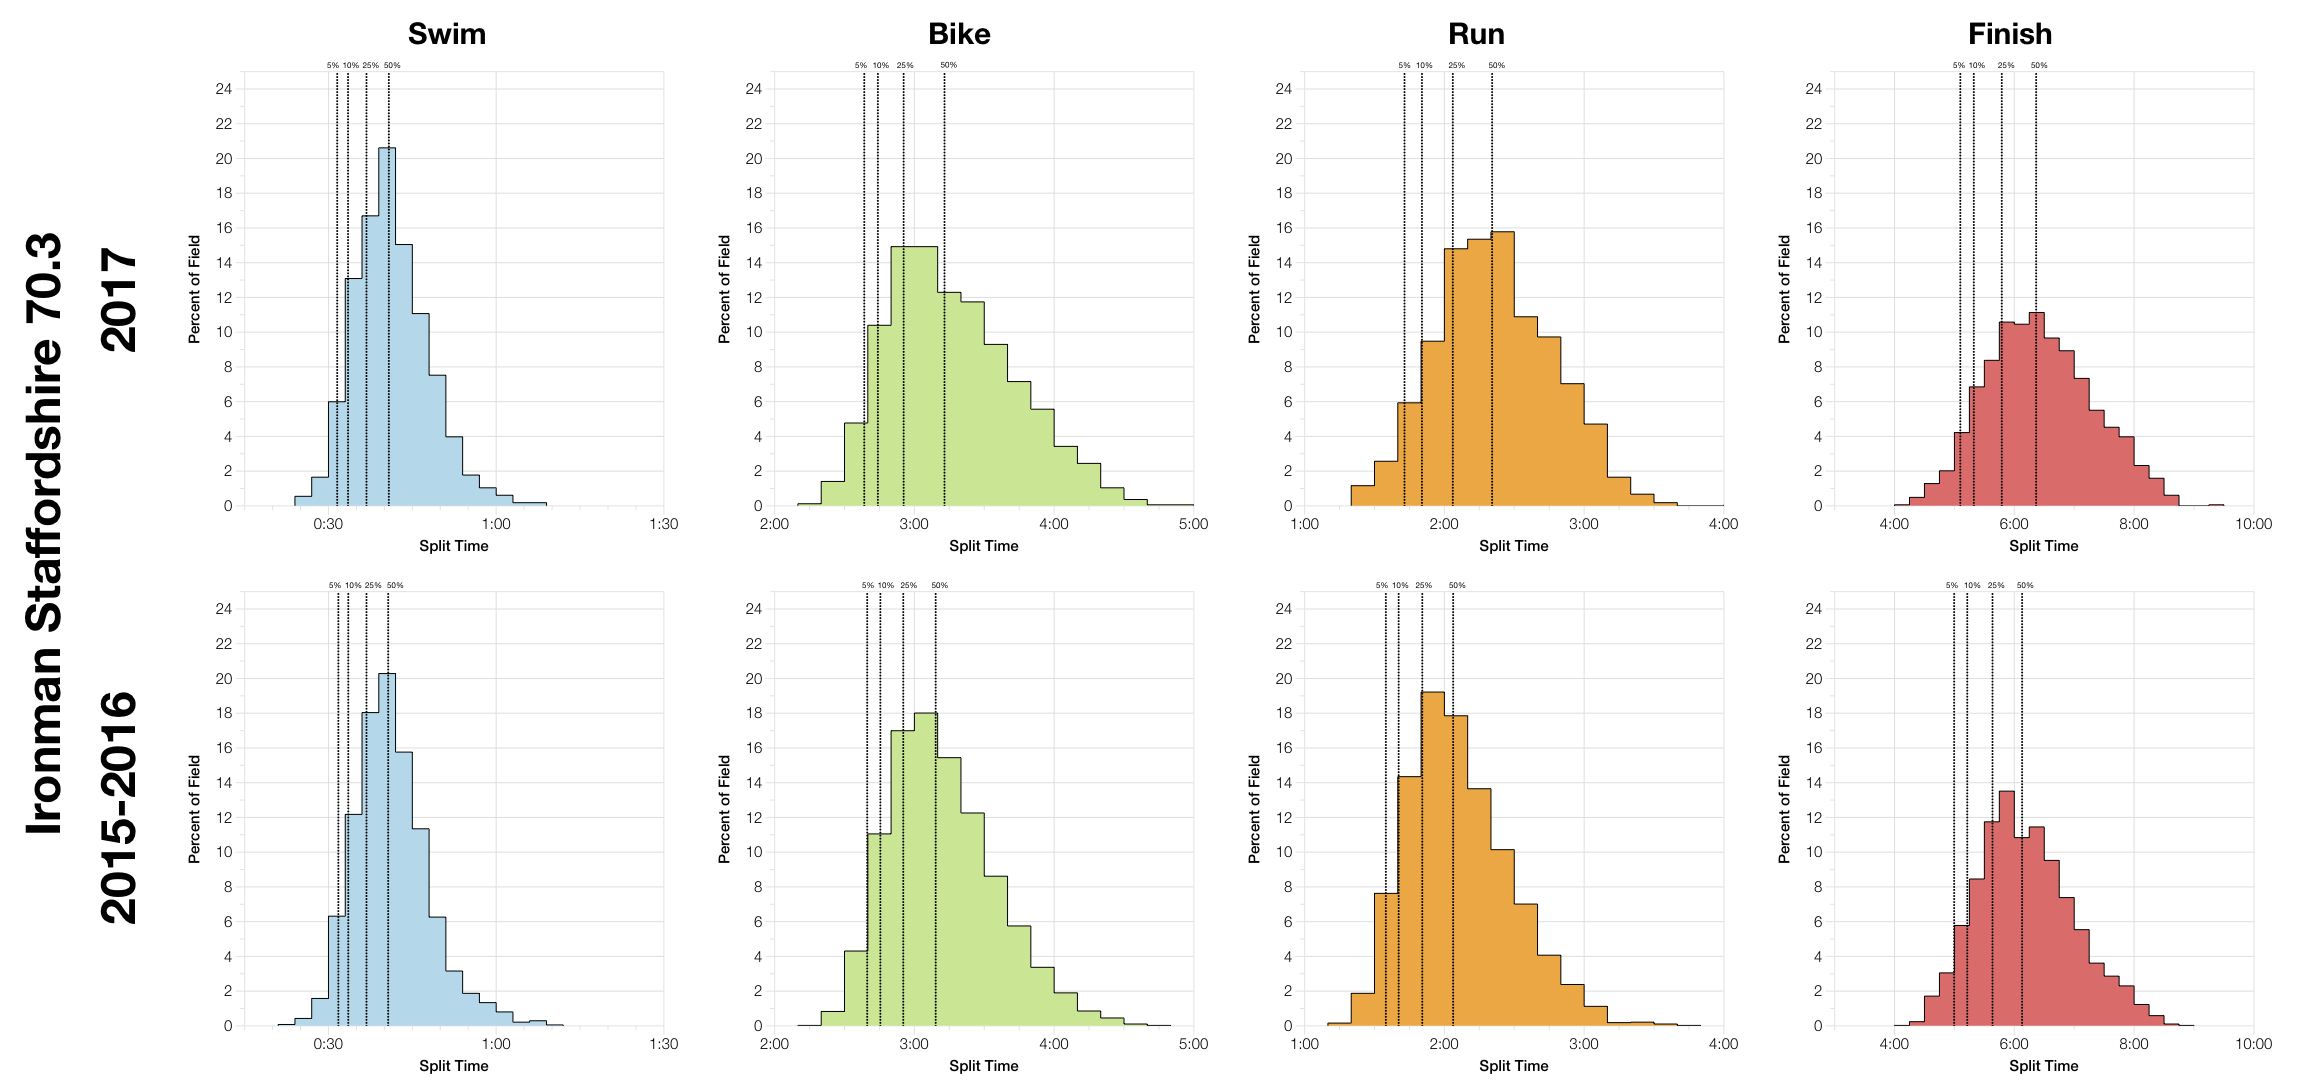
Heat always has the biggest impact on run splits and that’s obvious in the above distributions. It’s the run that sees the biggest shift to slower time, the bike is also slower and they combine to give a roughly 10-15 minute shift to median finish times.
| Listed Athletes | Swim Finish | Swim DNS/DNF | Bike Finish | Bike DNF | Run Finish | Run DNF | Overall DNS/DNF | |
|---|---|---|---|---|---|---|---|---|
| 2015 | 2374 | 2012 | 15.2% | 1977 | 1.7% | 1952 | 1.3% | 17.8% |
| 2016 | 2331 | 1878 | 19.4% | 1853 | 1.3% | 1828 | 1.3% | 21.5% |
| 2017 | 1721 | 1717 | 0.2% | 1699 | 1% | 1653 | 2.7% | 4% |
As changes in listing methods on the athletes tracker heavily affect whether I can identify DNS numbers I’ll stick to the bike and run DNF numbers in my commentary. The DNF on the bike is lower than before, but the DNF on the run is more than double. It’s a small number of years to look at, but does suggest heat really hit the run.
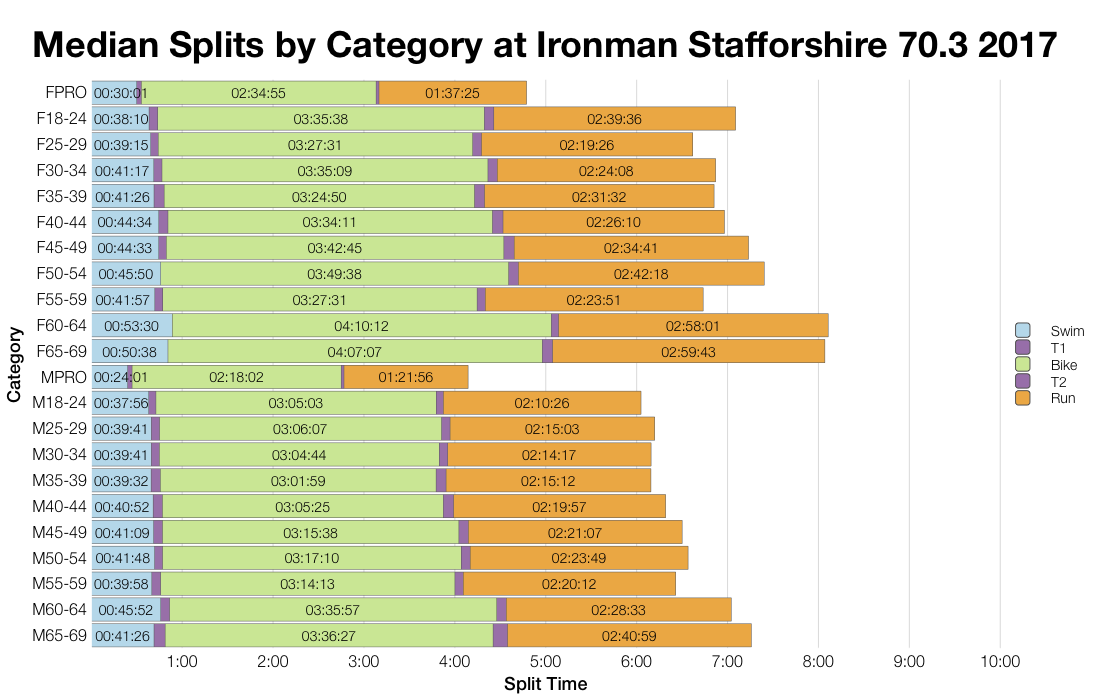
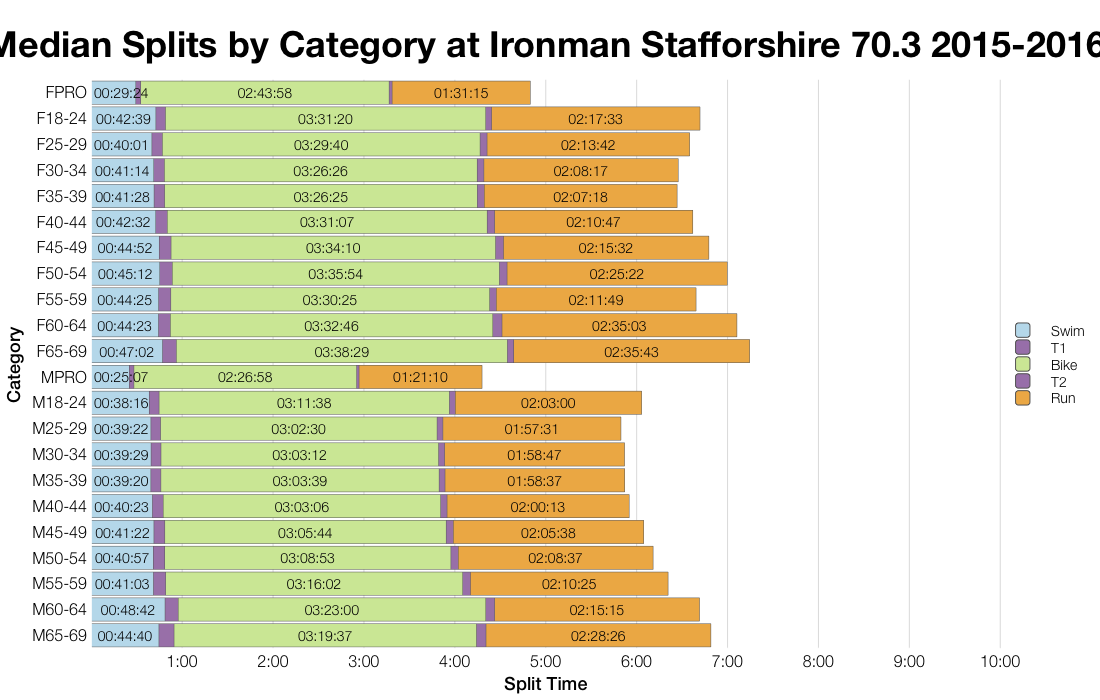
Naturally when we compare medians for individual age divisions we see a very similar pattern with slower bikes and more significantly slower run times.
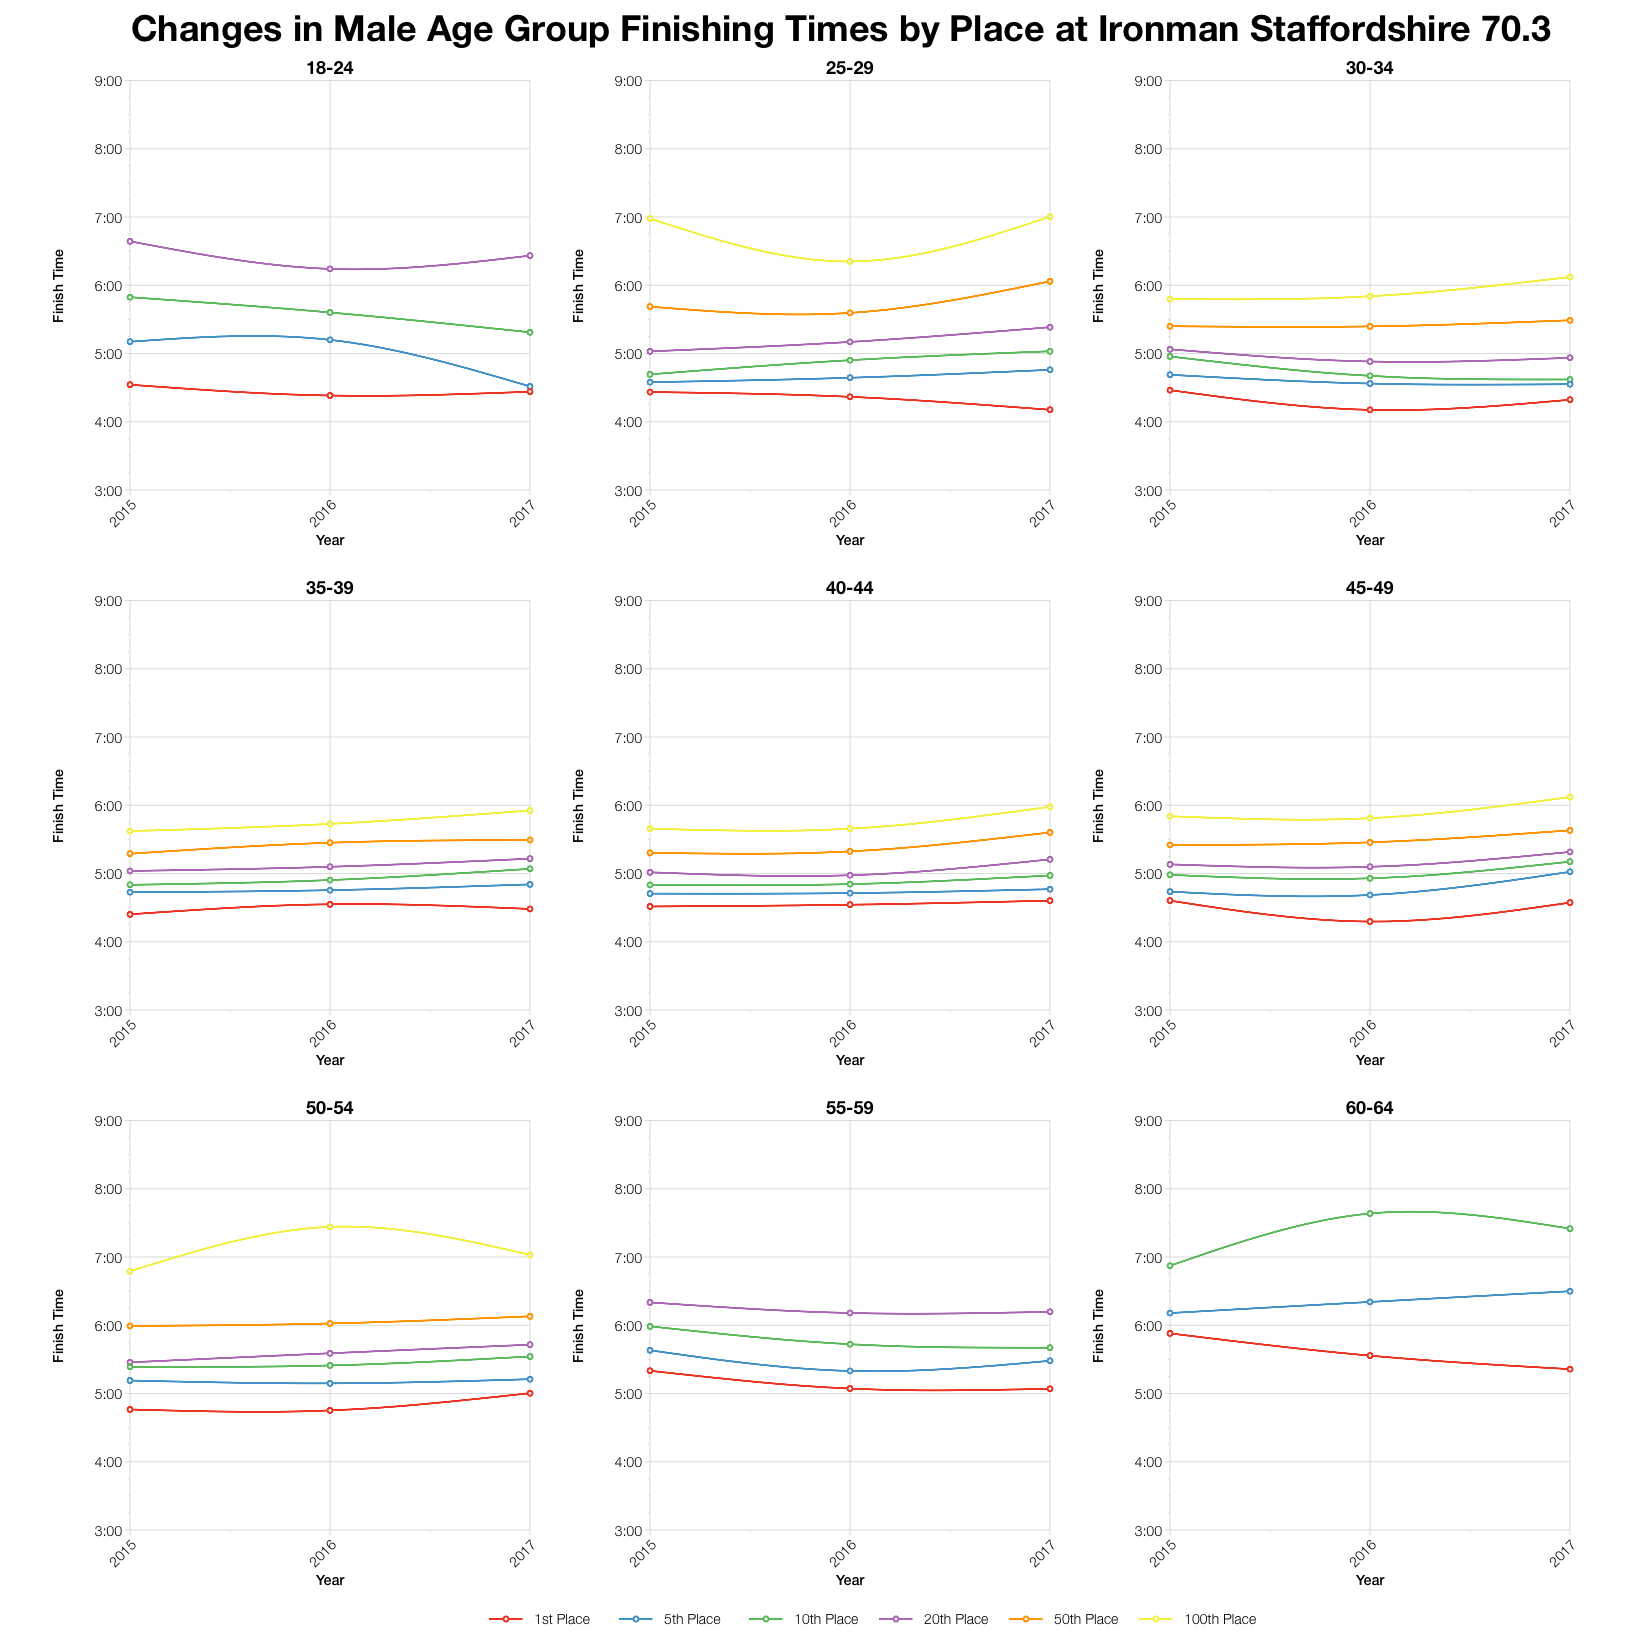
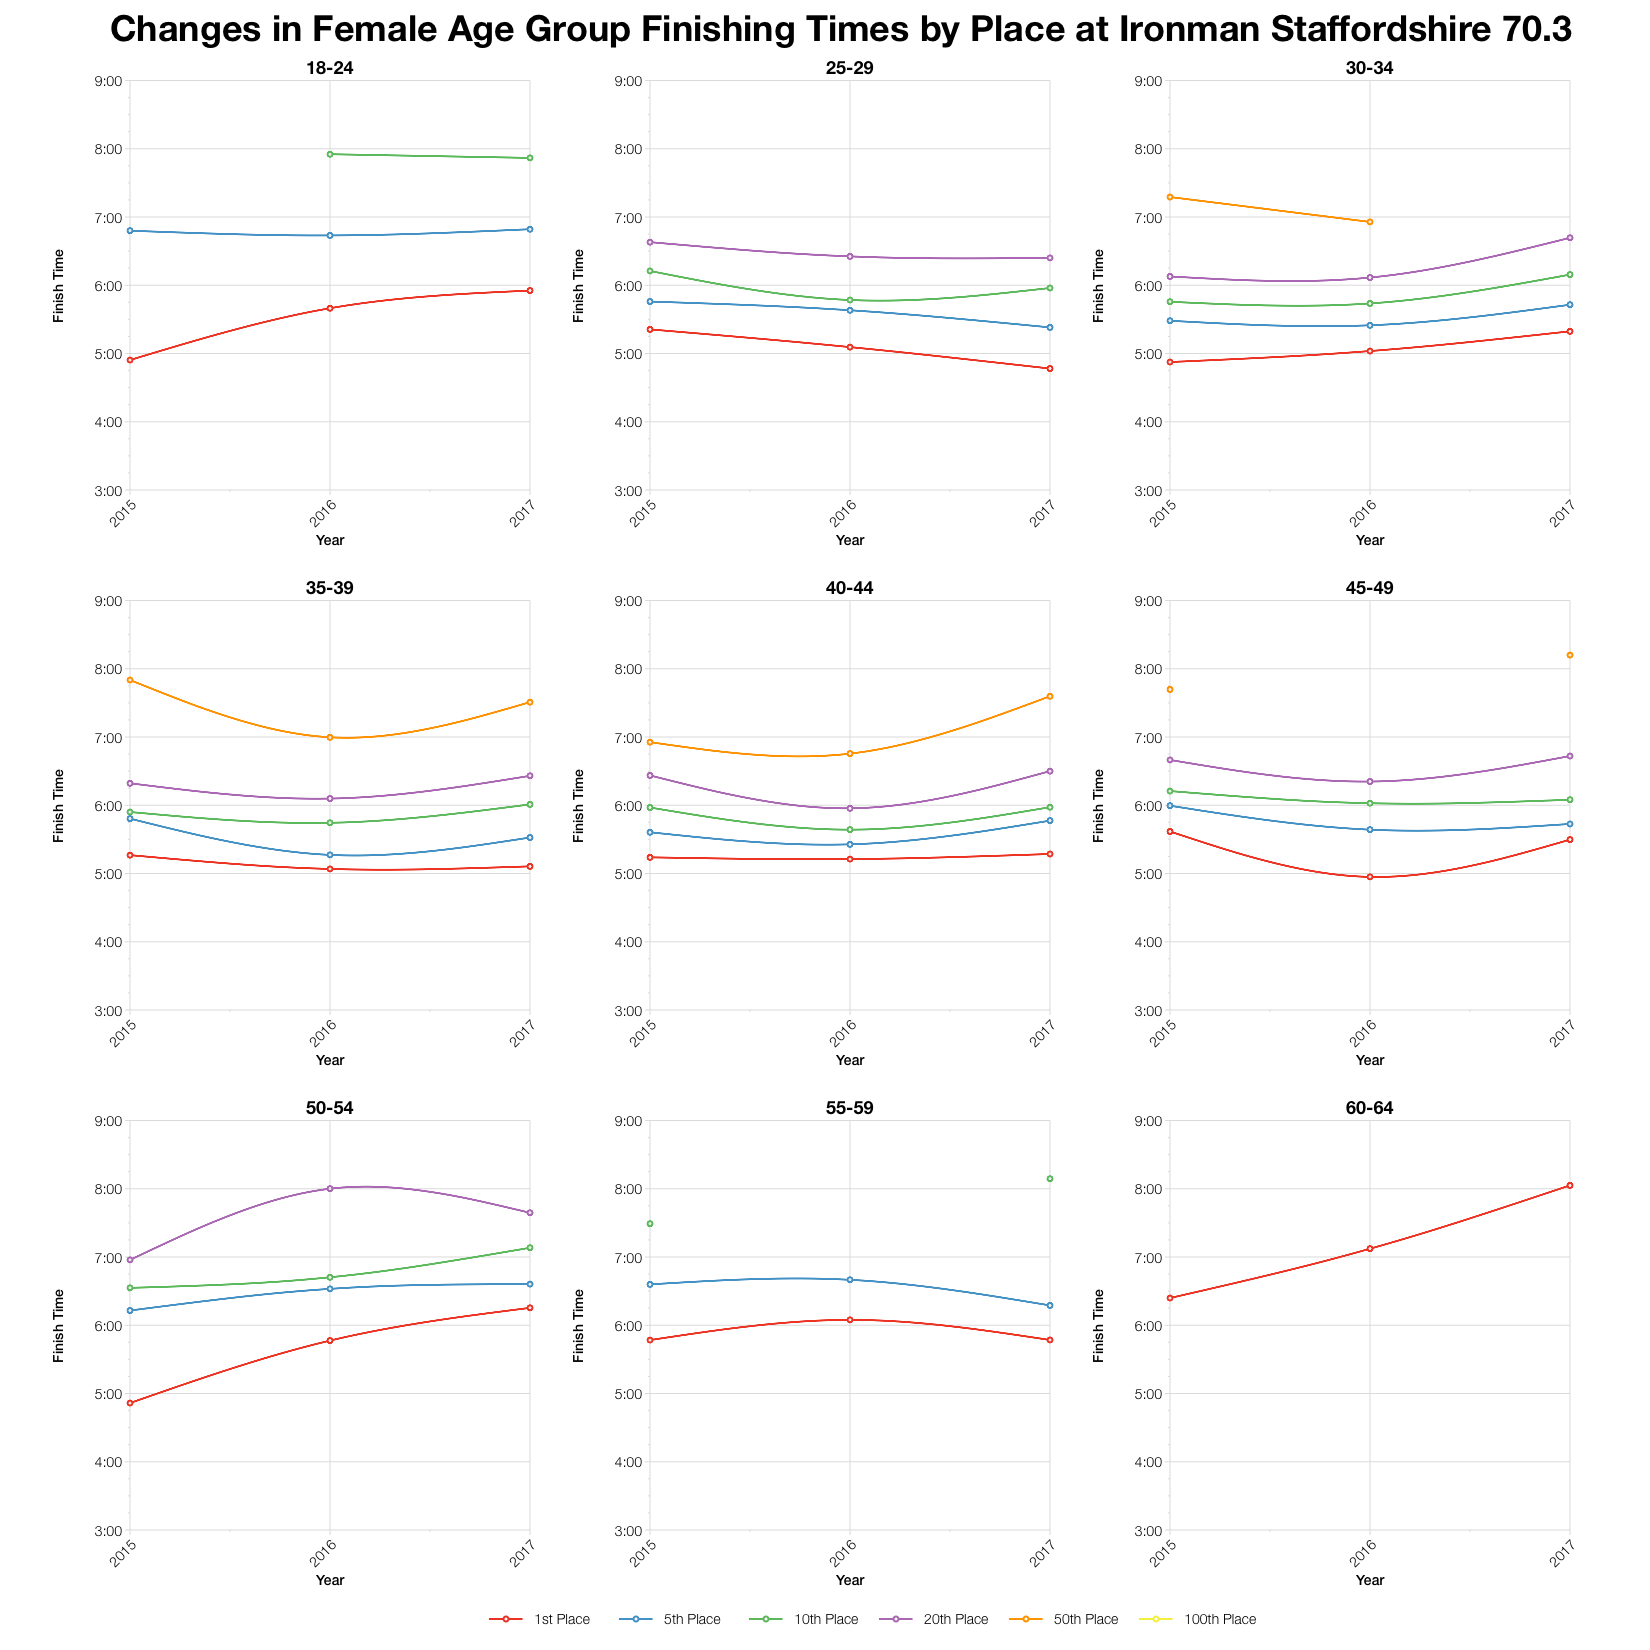
The scale on the above charts makes the change quite subtle, but the general trend was to slower times across all age groups and positions. There are a limited number of exceptions and the slowing is more pronounced further back in the age groups.
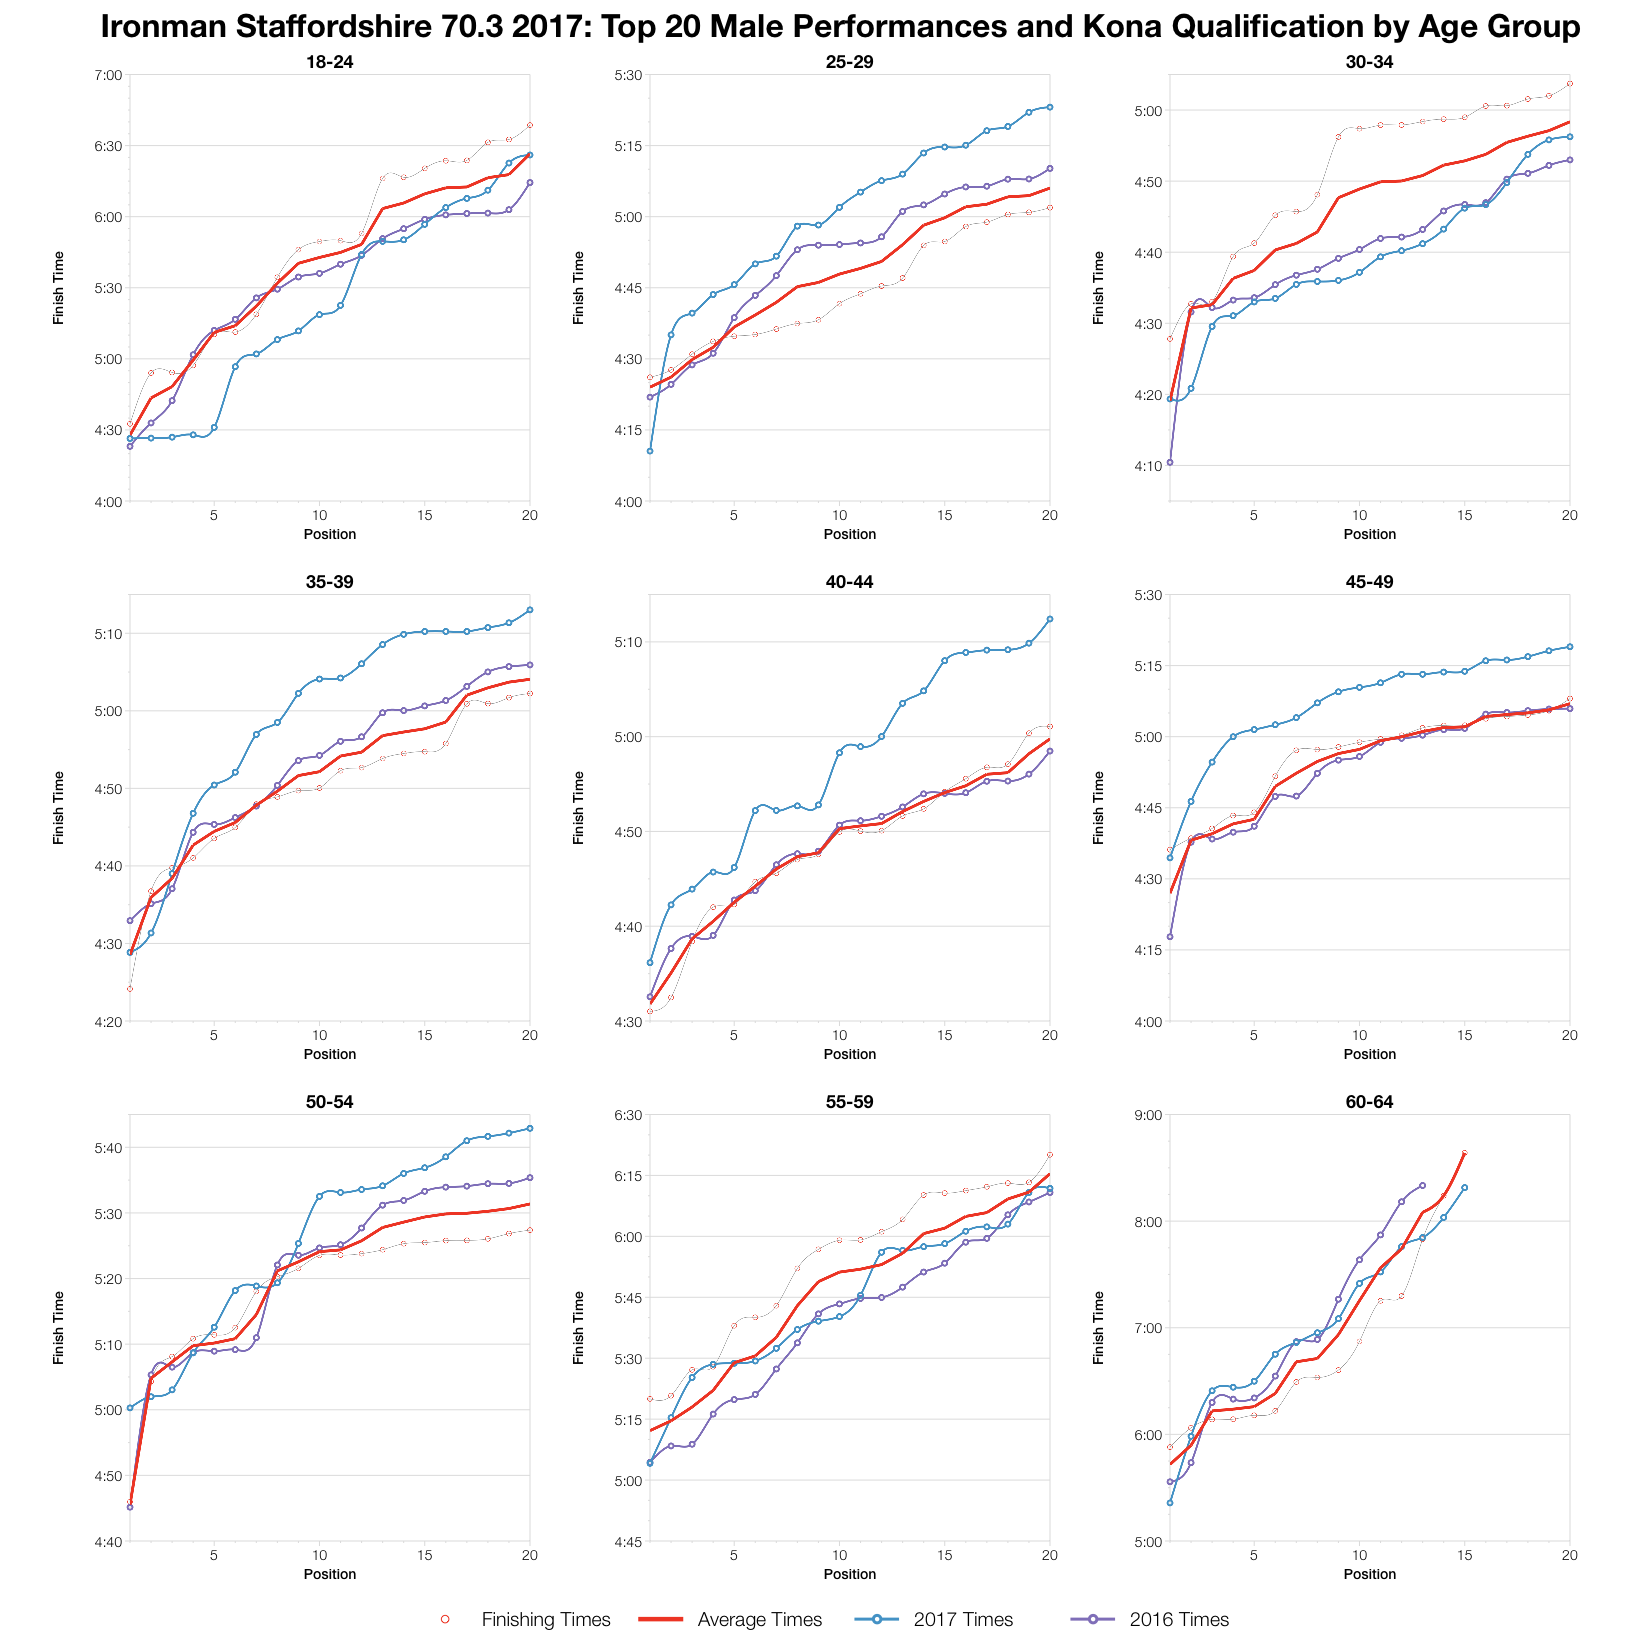
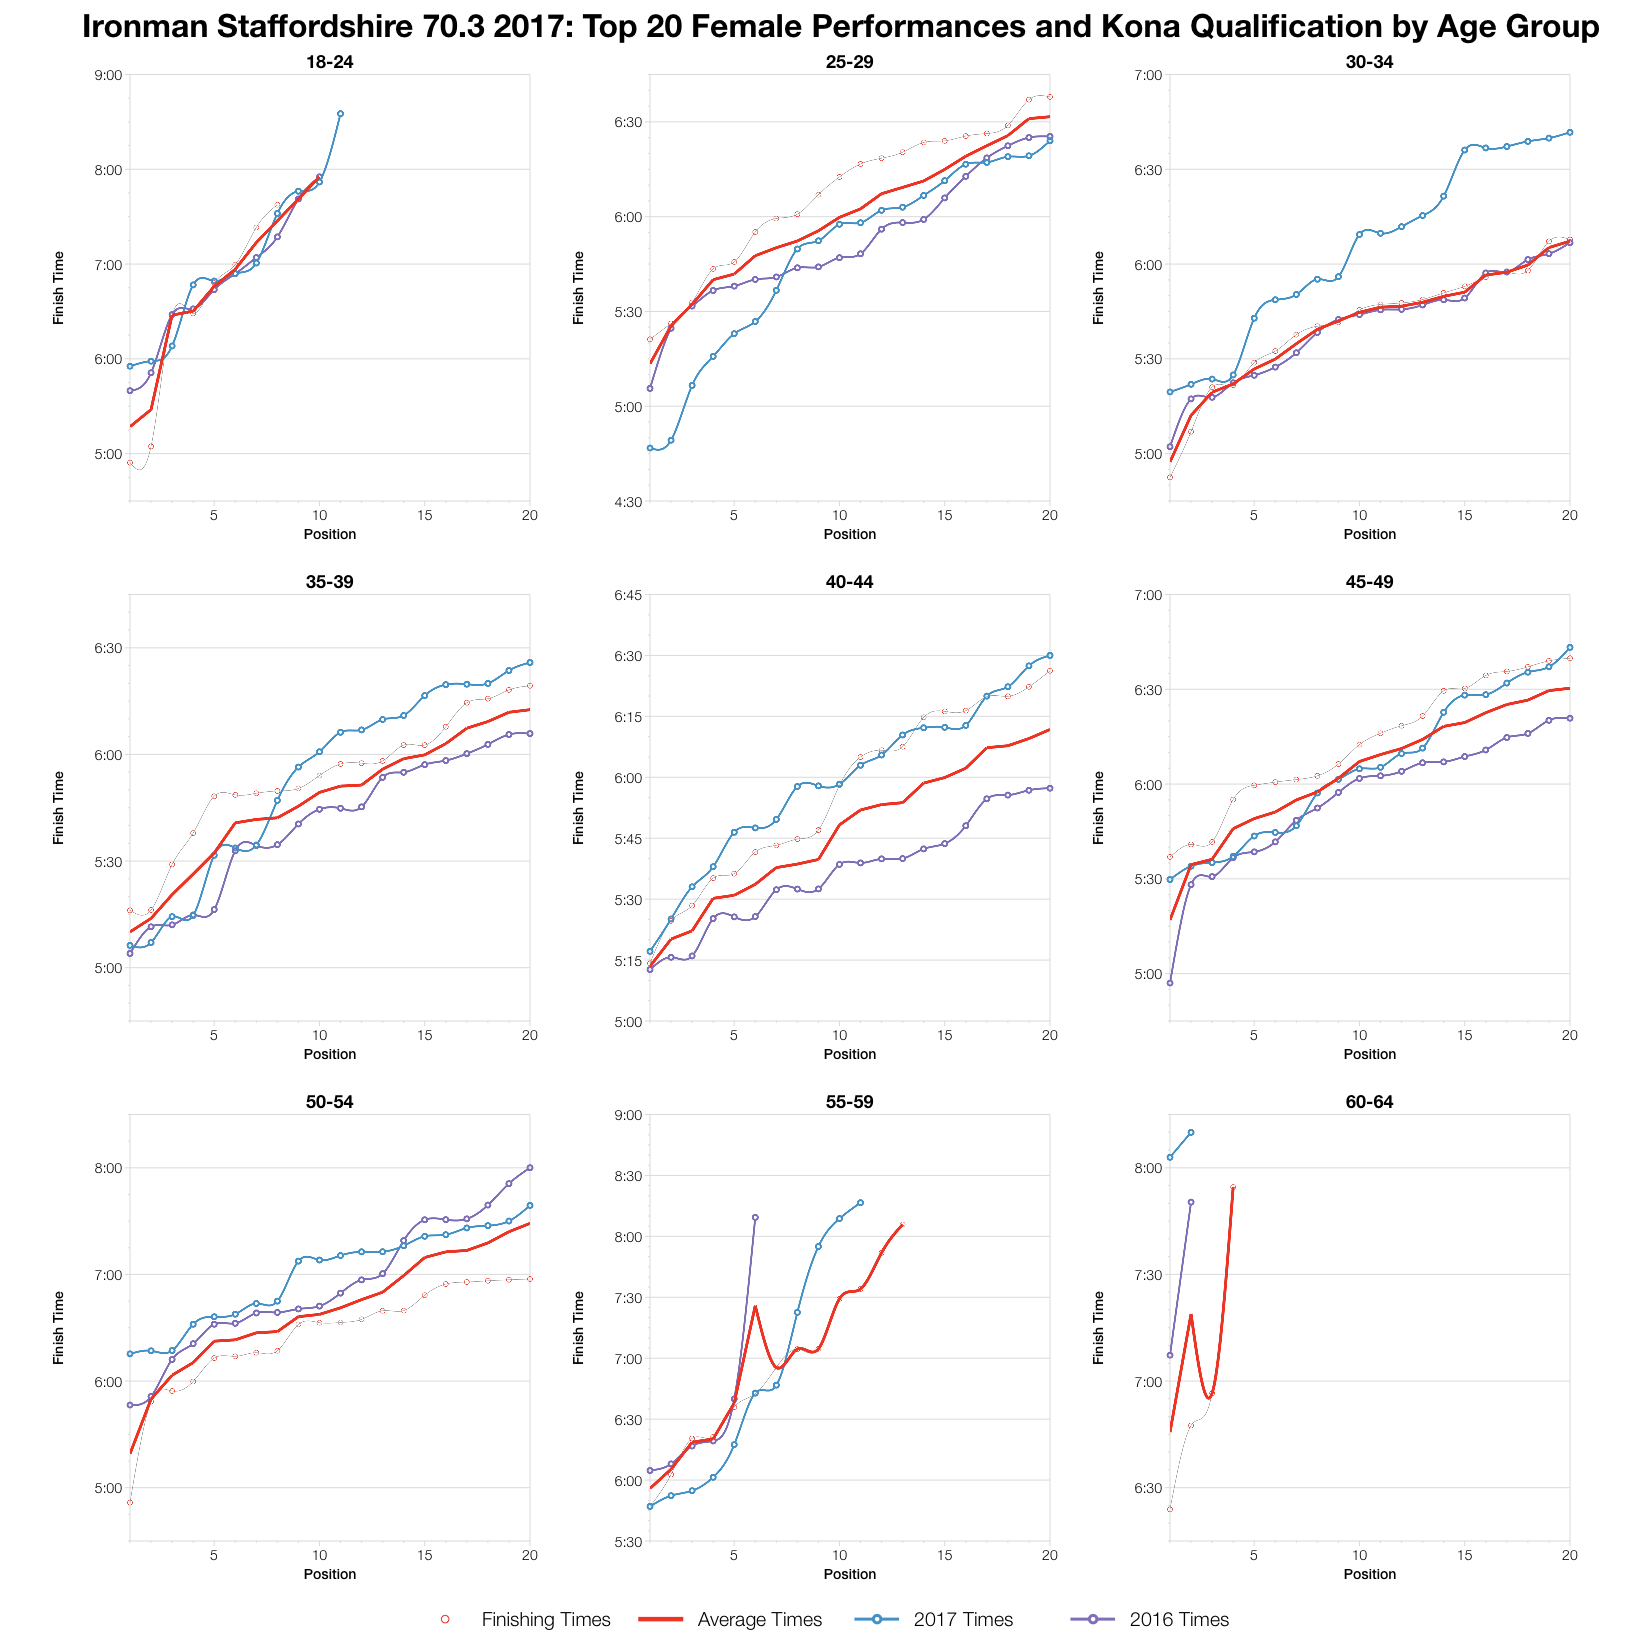
Still, for many age groups the top twenties were slower than average and the slowest for the three years of racing. Again, not all and not consistently over the twenty placings. Generally those at the very front of their age group were closest to the average for the course. A few age groups, like the M30-34, performed better in the heat, but most didn’t.
You can access a spreadsheet of the full results from Ironman Staffordshire 70.3 2017 on my Google Drive.


