Sadly this is the last time I’ll be reviewing results from the Ironman Exmoor 70.3 as 2017 was the final year for the race. Wimbleball is a tough course to race, with a bike and run that is constantly up and down it’s hard to find a rhythm. Despite being tough and times being slow, it’s been a favourite for many in the UK and an event to check off your bucket list. Its final year saw fewer competitors, but maintained its reputation as a slower course.
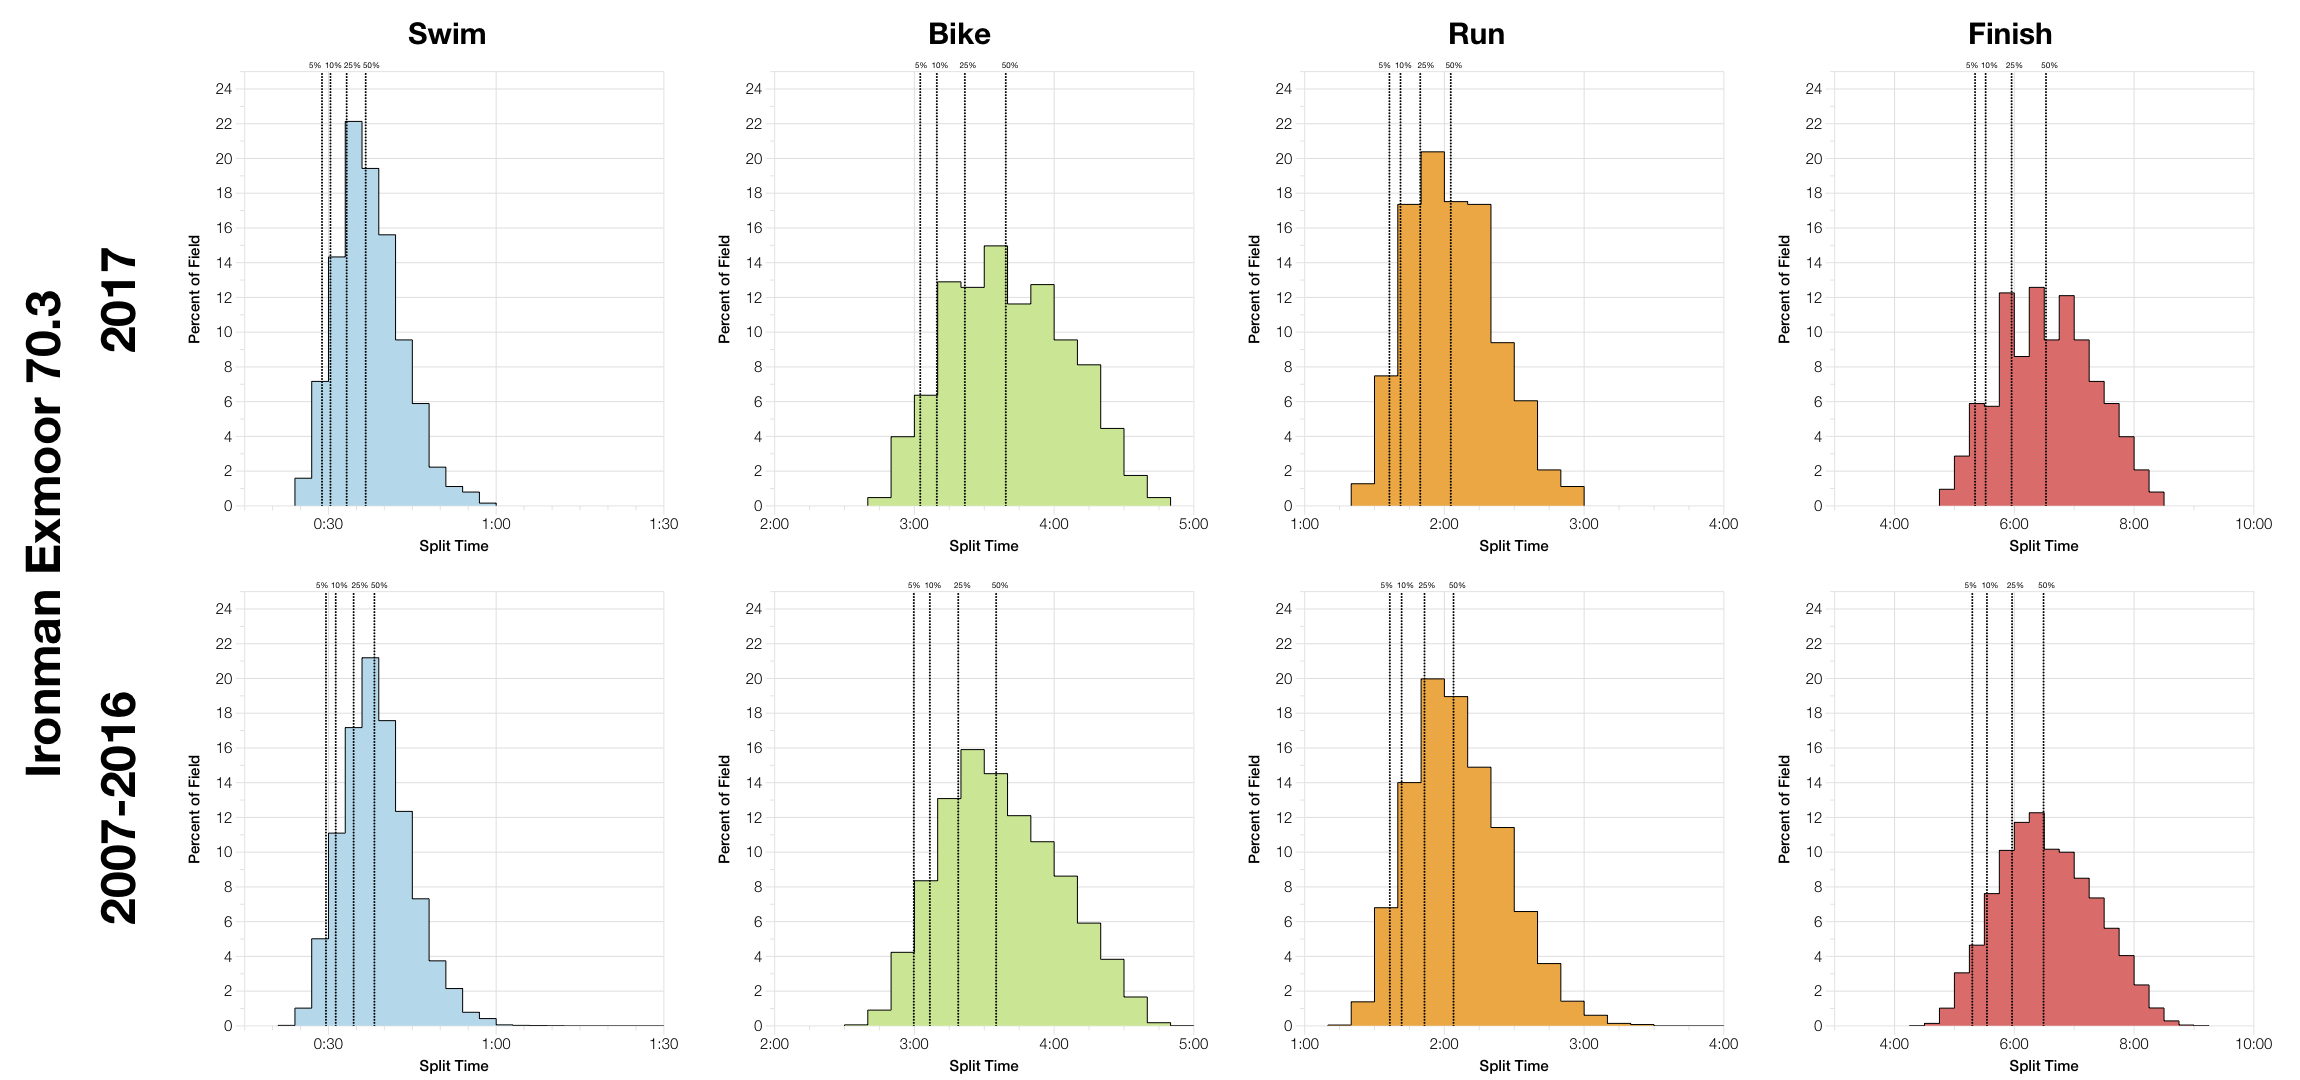
Overall this year trended very slightly slower than the previous aggregated results. This appears to mainly come from a very slightly slower bike. Neither is significantly slower though, so it’s small variations we’re looking at rather than a notable change.
| Listed Athletes | Swim Finish | Swim DNS/DNF | Bike Finish | Bike DNF | Run Finish | Run DNF | Overall DNS/DNF | |
|---|---|---|---|---|---|---|---|---|
| 2006 | 848 | 848 | 0% | 811 | 4.4% | 804 | 0.9% | 5.2% |
| 2007 | 916 | 916 | 0% | 909 | 0.8% | 856 | 5.8% | 6.6% |
| 2008 | 896 | 894 | 0.2% | 818 | 8.5% | 799 | 2.3% | 10.8% |
| 2009 | 966 | 961 | 0.5% | 918 | 4.5% | 902 | 1.7% | 6.6% |
| 2010 | 1176 | 1174 | 0.2% | 1104 | 6% | 1089 | 1.4% | 7.4% |
| 2011 | 1235 | 1227 | 0.6% | 1123 | 8.5% | 1110 | 1.2% | 10.5% |
| 2012 | 1784 | 1375 | 22.9% | 1317 | 4.2% | 1265 | 3.9% | 29.1% |
| 2013 | 1666 | 1340 | 19.6% | 1312 | 2.1% | 1191 | 9.2% | 28.5% |
| 2014 | 1672 | 1337 | 20% | 1274 | 4.7% | 1243 | 2.4% | 25.7% |
| 2015 | 1594 | 1270 | 20.3% | 1200 | 5.5% | 1166 | 2.8% | 26.9% |
| 2016 | 1336 | 1084 | 18.9% | 1055 | 2.7% | 1018 | 3.5% | 23.8% |
| 2017 | 790 | 688 | 12.9% | 666 | 3.2% | 628 | 5.7% | 20.5% |
Overall DNF/DNS rates fell a little, probably due to a smaller field. DNF on the run was towards the high end for the course, but DNFs on the bike were average.
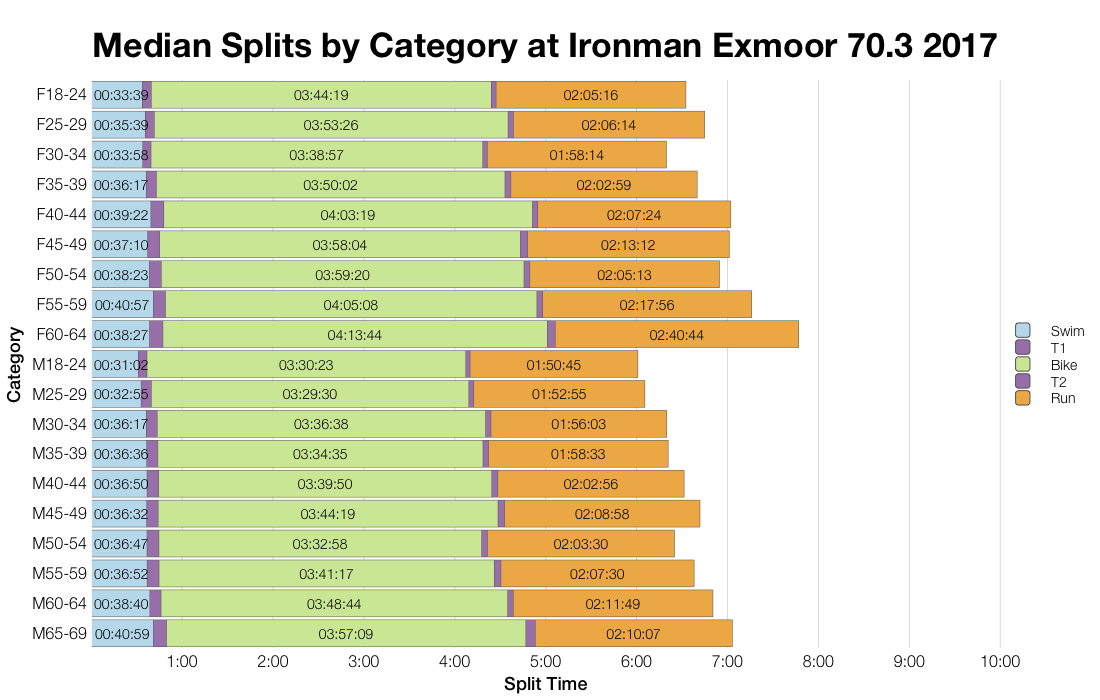
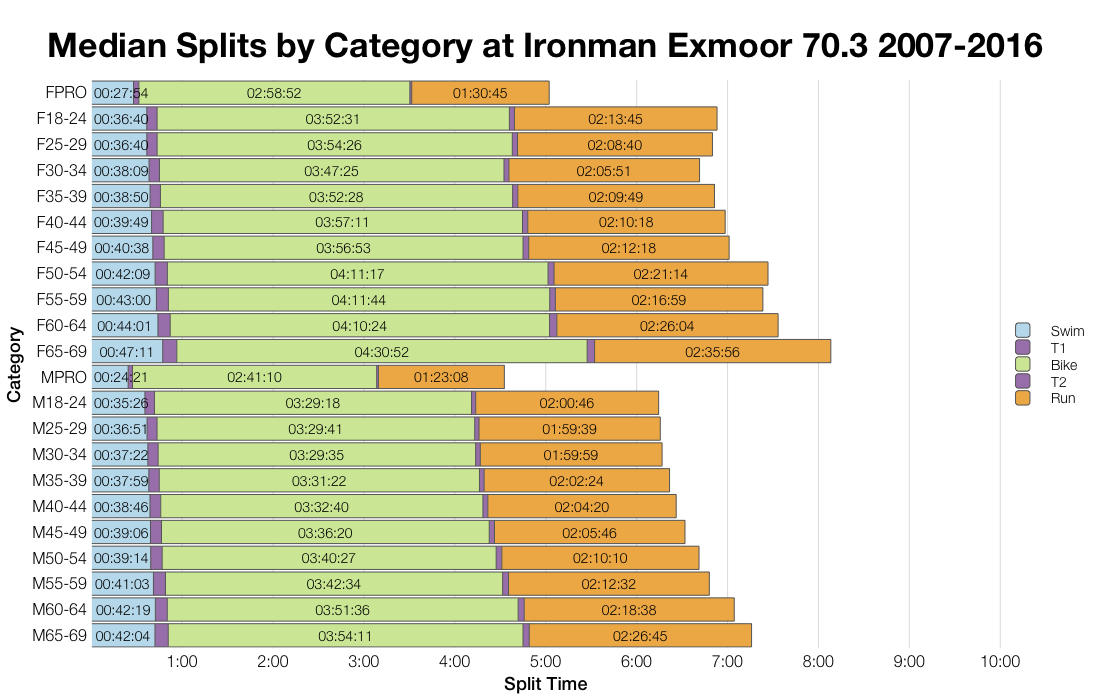
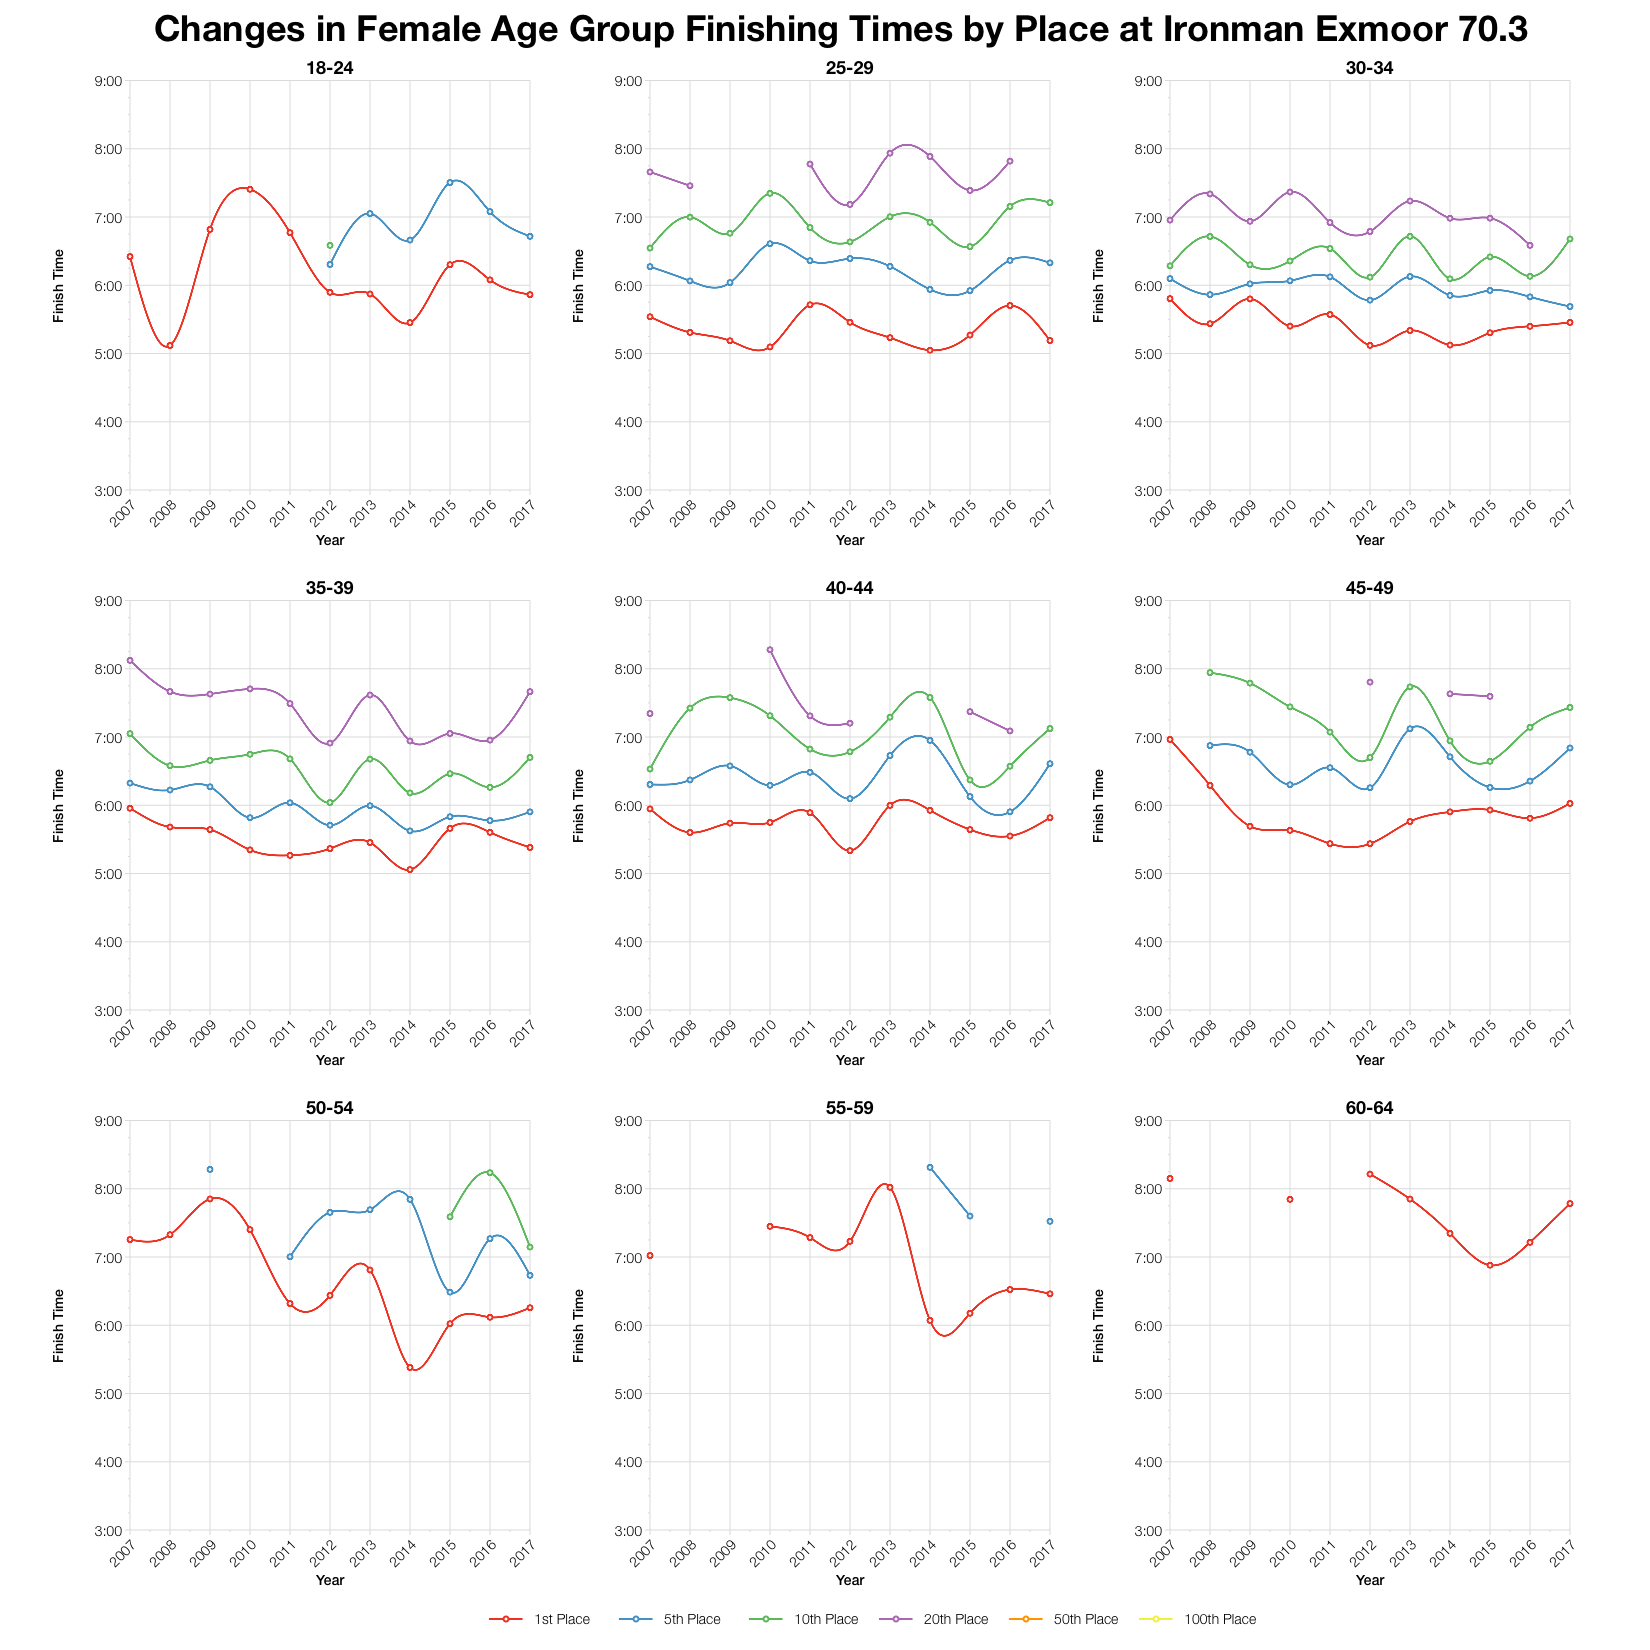
Comparing age group medians shows lots of variation in this year’s results. Generally the trend is towards slightly slower bike times and for the rest of the splits slight variations on the average.
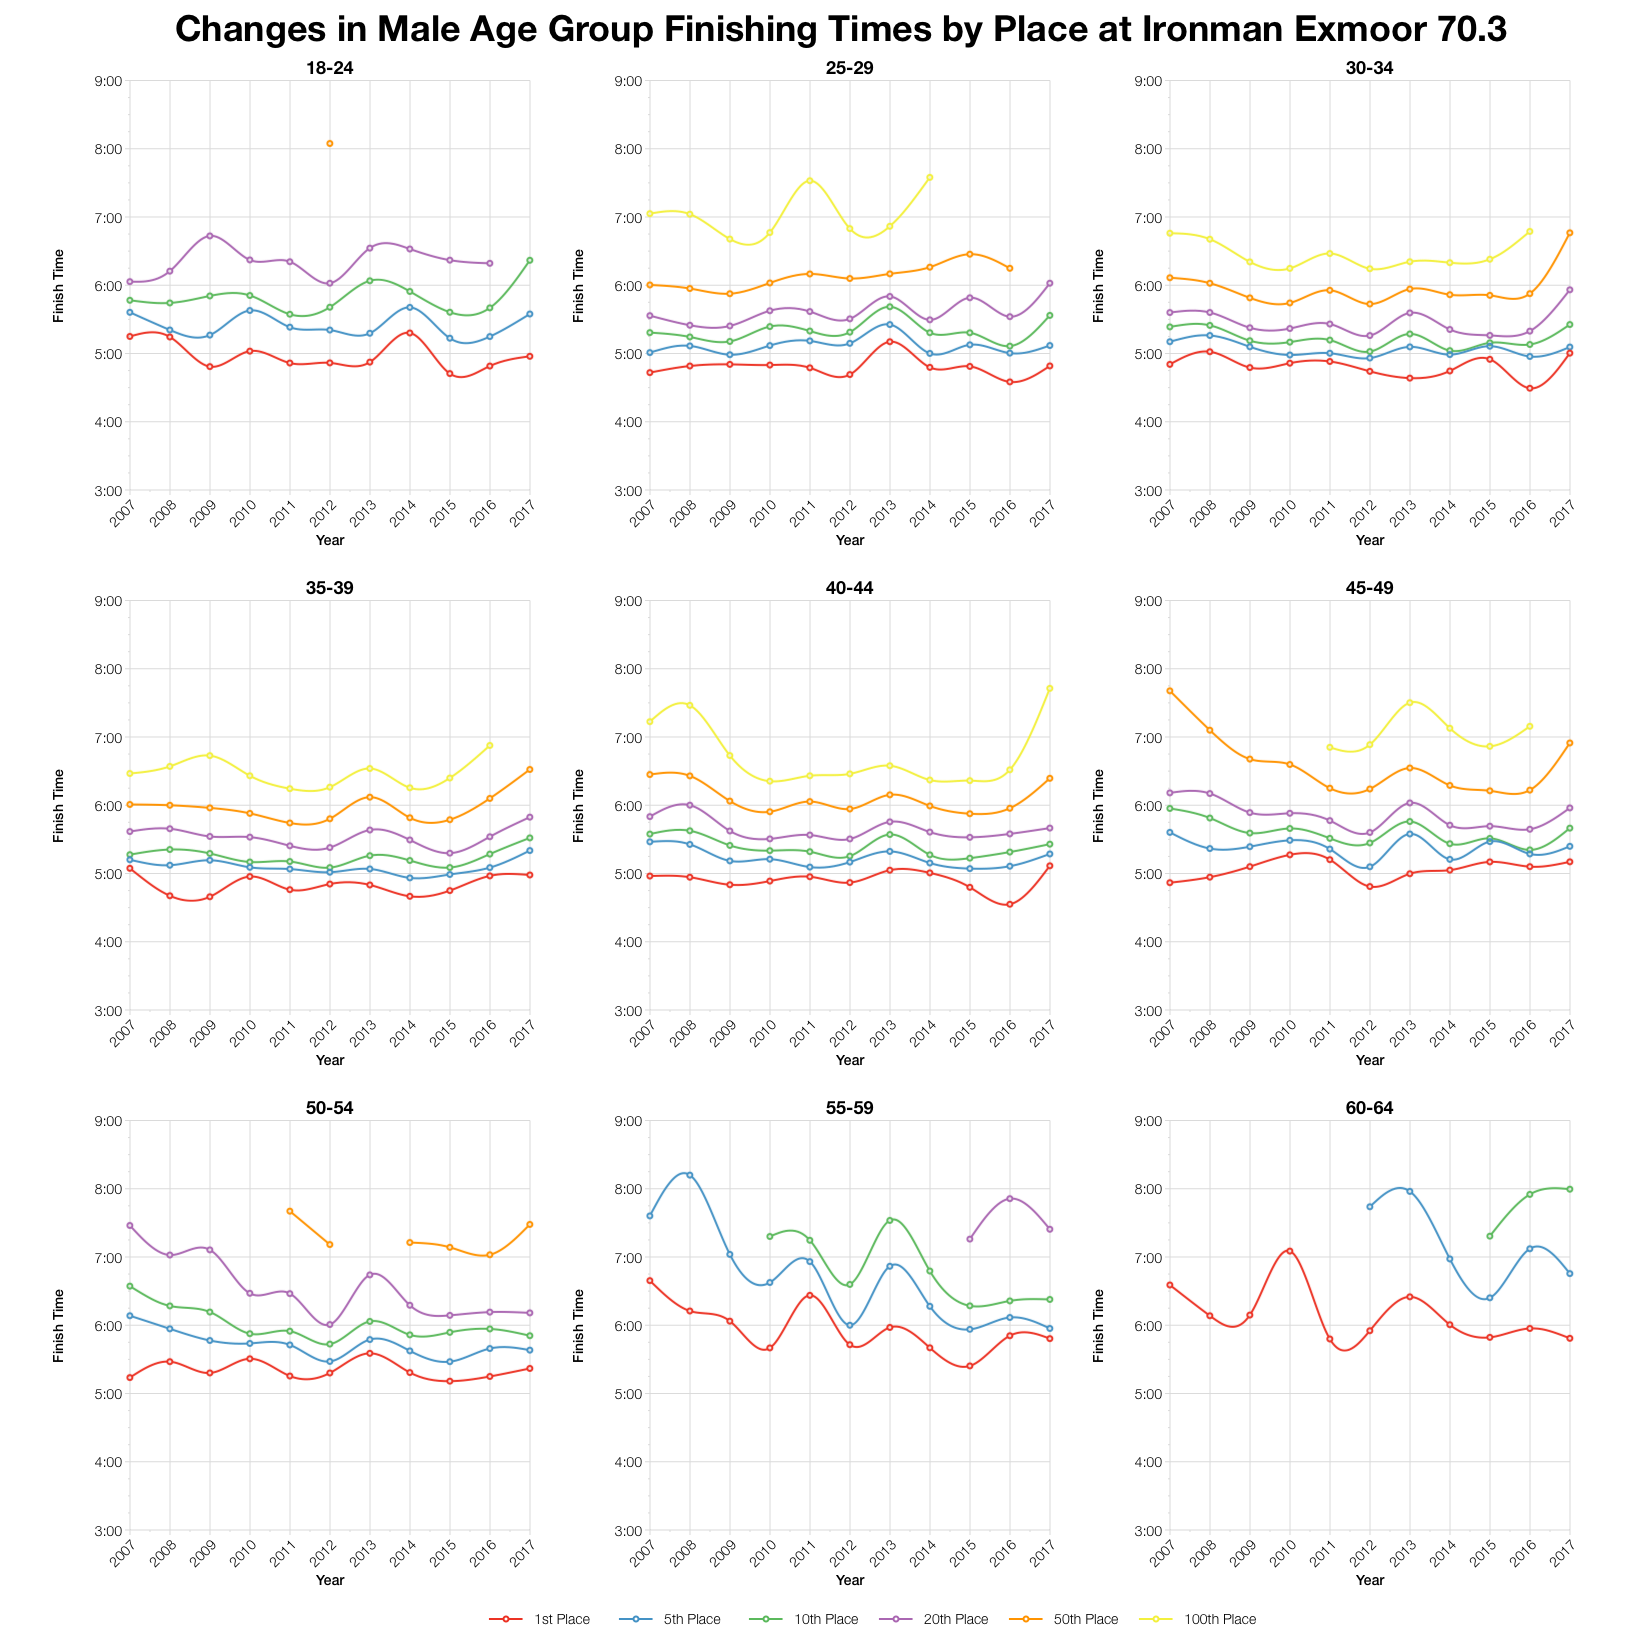
This year’s times for given age groups and positions generally fall in line with a lot of past results. They are typically slower than the last couple of years, but more consistent with older results.
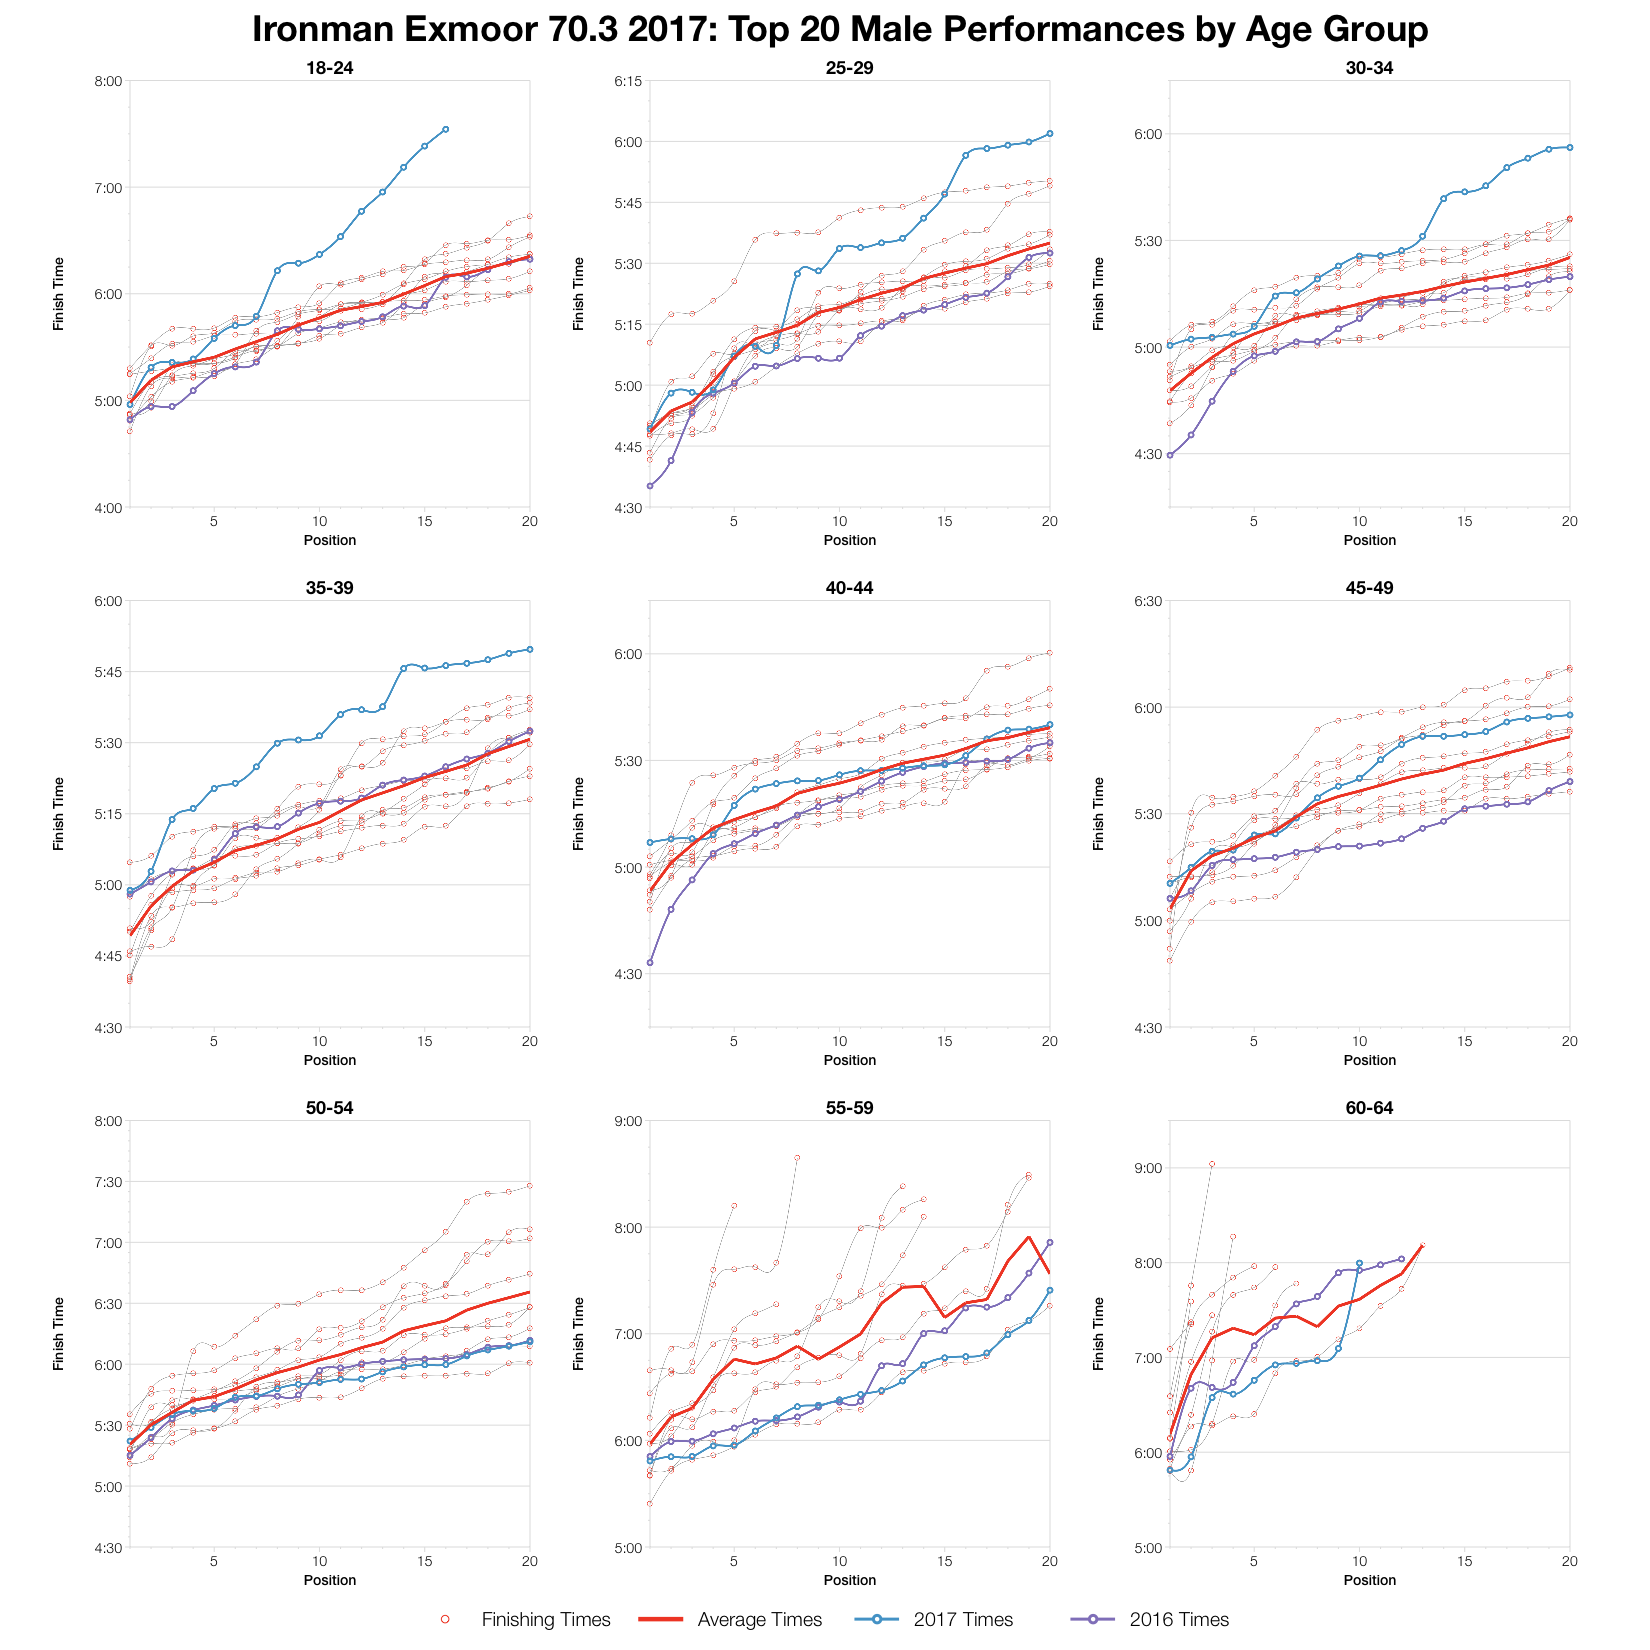
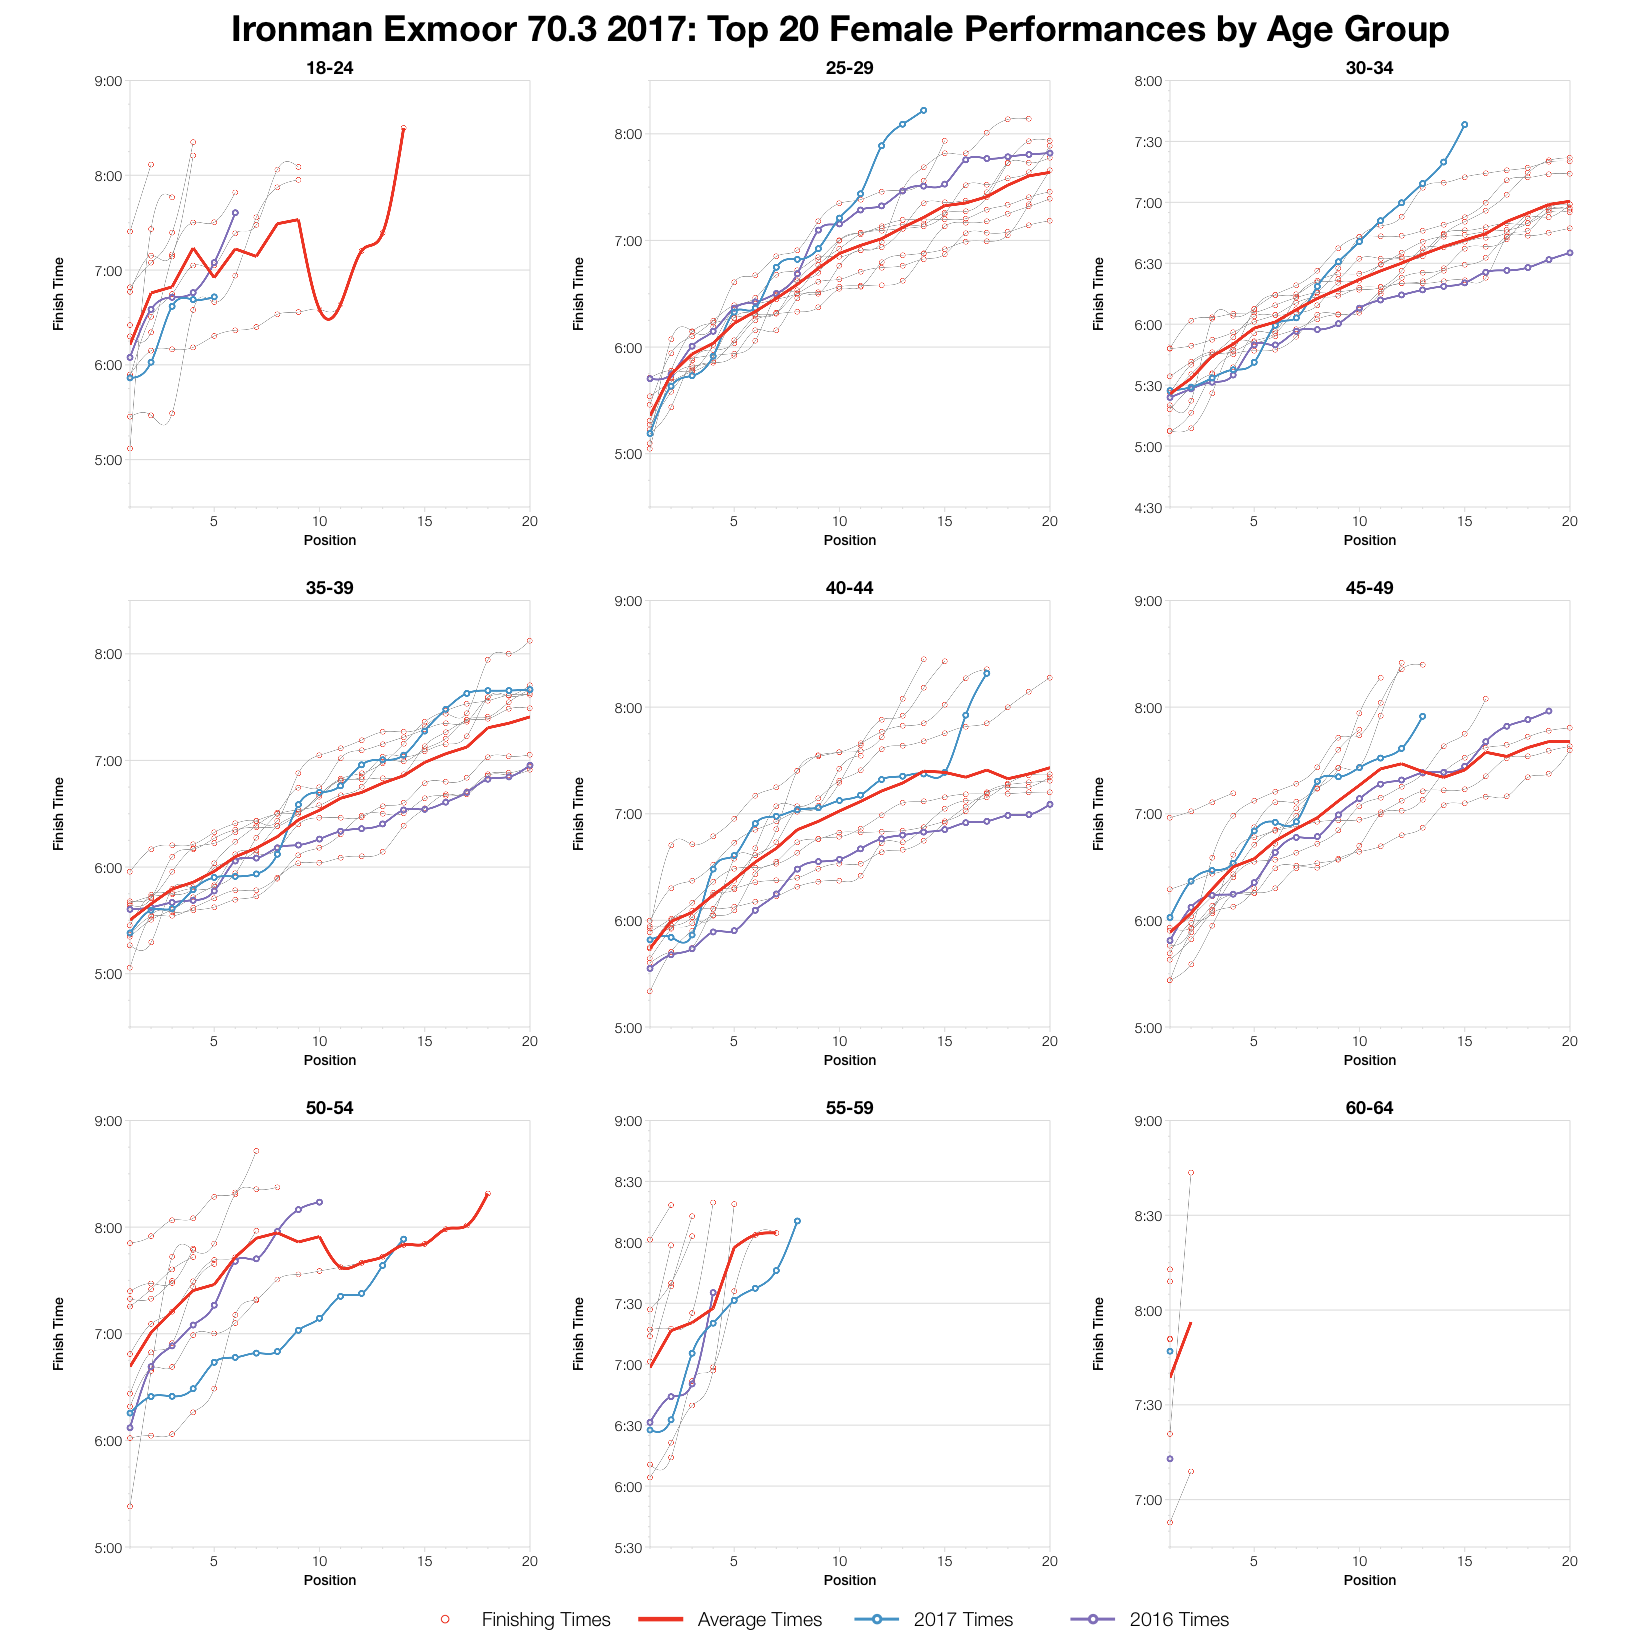
Finally, the top twenty in each age group. There’s variation again with age groups coming in slower than average and one or two faster, but top twenty times mostly fall around the course averages. Overall, the final year appears to have been marginally slower than usual, but nothing of significance.
You can access a spreadsheet of the full results and splits from Ironman Exmoor 70.3 2017 on my Google Drive.

