As always Ironman Austria was a fast race. It’s the nature of its course and the level of athlete it tends to draw. With only 40 Kona slots on offer that means stiff competition for a place at the Ironman World Champs. While it’s safe to call this year’s race fast, the results look to be average for the course.
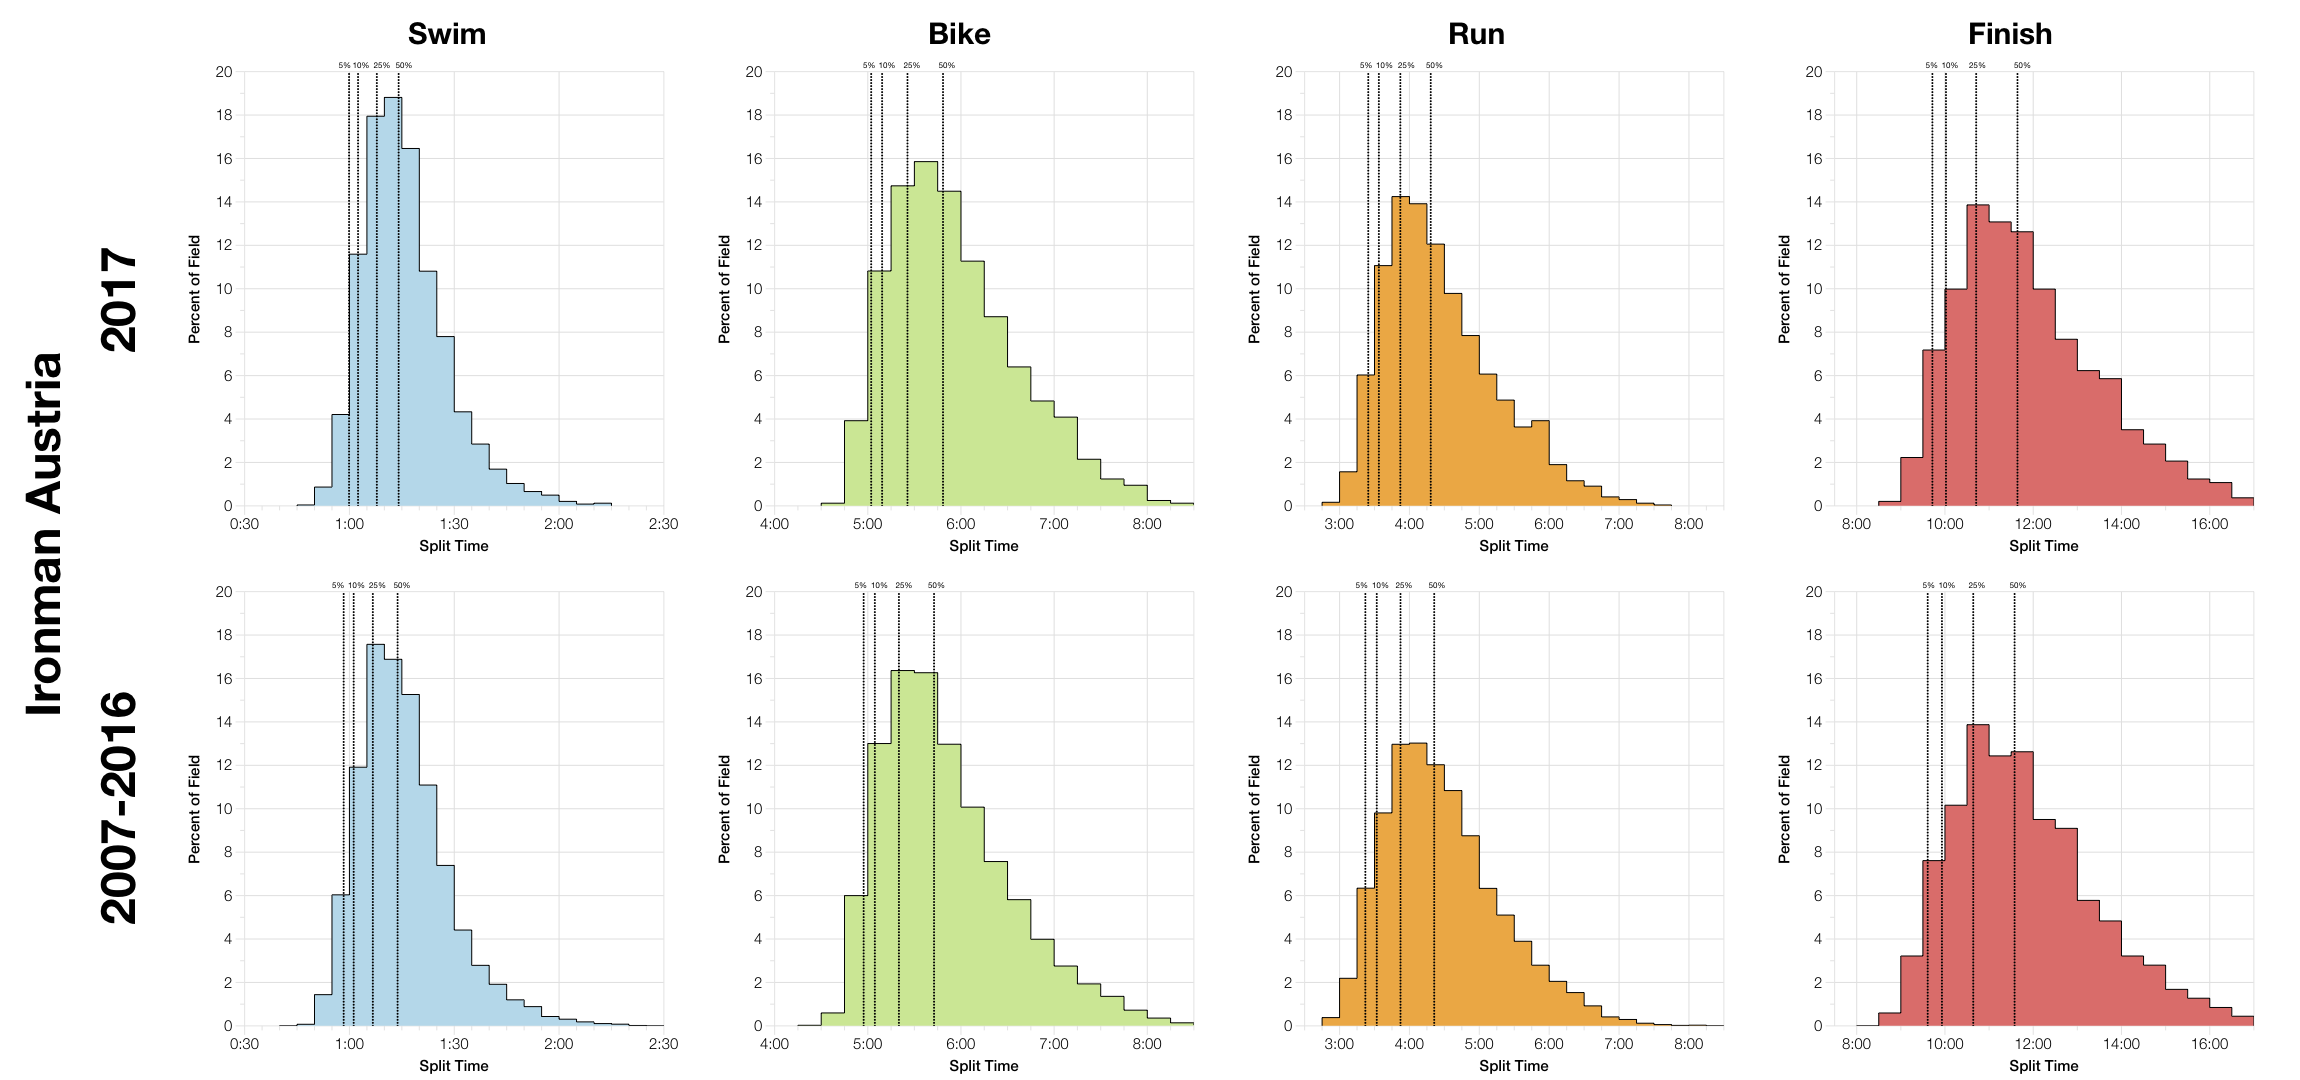
A quick comparison of the split distributions shows this year’s race trending slightly slower than the aggregate results from the previous 10 years. Unusually this appears to be more significant at the front of the race, with the 5th percentile times showing greater difference than the medians. Only the run has a faster distribution, but as with all the variations it’s hardly significant.
| Listed Athletes | Swim Finish | Swim DNS/DNF | Bike Finish | Bike DNF | Run Finish | Run DNF | Overall DNS/DNF | |
|---|---|---|---|---|---|---|---|---|
| 2005 | 2157 | 1938 | 10.2% | 1894 | 2.3% | 1793 | 5.3% | 16.8% |
| 2006 | 2366 | 2079 | 12.1% | 2138 | % | 2017 | 5.7% | 14.6% |
| 2007 | 2451 | 2131 | 13.1% | 2148 | % | 2008 | 6.5% | 18% |
| 2008 | 2770 | 2318 | 16.3% | 2388 | % | 2320 | 2.8% | 16.1% |
| 2009 | 2530 | 2155 | 14.8% | 2202 | % | 2028 | 7.9% | 19.7% |
| 2010 | 2562 | 2169 | 15.3% | 2165 | 0.2% | 2046 | 5.5% | 19.9% |
| 2011 | 2781 | 2379 | 14.5% | 2419 | % | 2346 | 3% | 15.6% |
| 2012 | 2361 | 2346 | 0.6% | 2214 | 5.6% | 2011 | 9.2% | 14.8% |
| 2013 | 2896 | 2617 | 9.6% | 2578 | 1.5% | 2498 | 3.1% | 13.7% |
| 2014 | 2916 | 2604 | 10.7% | 2533 | 2.7% | 2438 | 3.8% | 16.4% |
| 2015 | 2813 | 2495 | 11.3% | 2418 | 3.1% | 2333 | 3.5% | 17% |
| 2016 | 2869 | 2530 | 11.8% | 2479 | 2% | 2408 | 2.9% | 16.1% |
| 2017 | 2868 | 2595 | 9.5% | 2532 | 2.4% | 2462 | 2.8% | 14.1% |
DNS and DNF values in 2017 lie on the lower end of the range. The drop out rate in bike and run are low; although it’s hard to compare bike DNF given a high number of missing swim times in the older results.
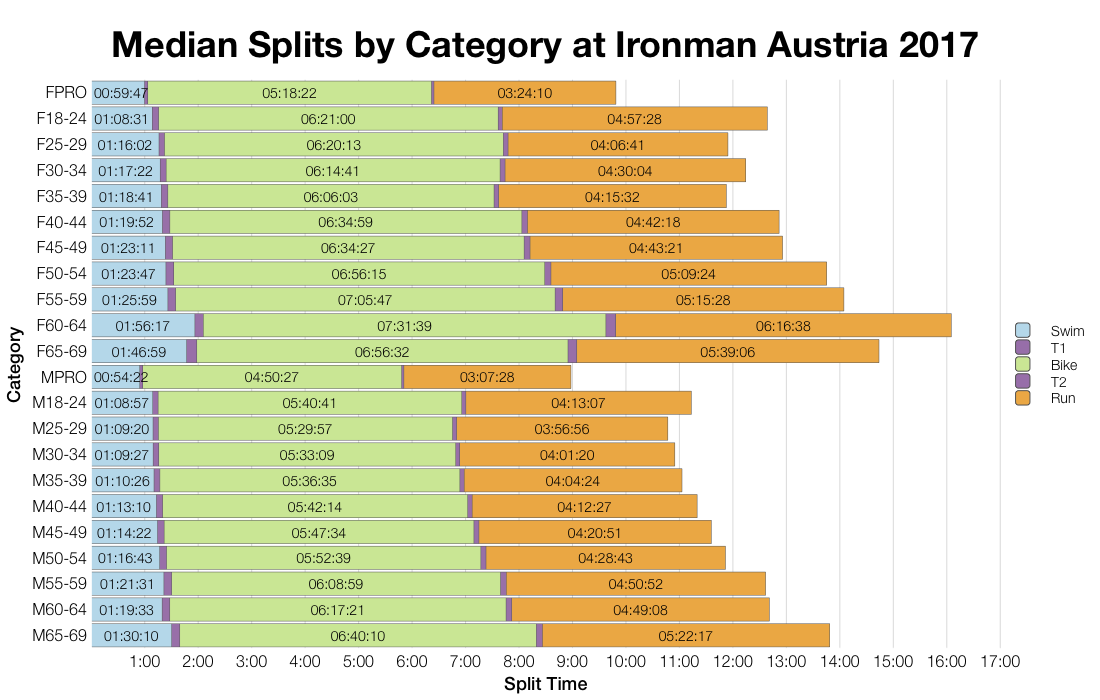
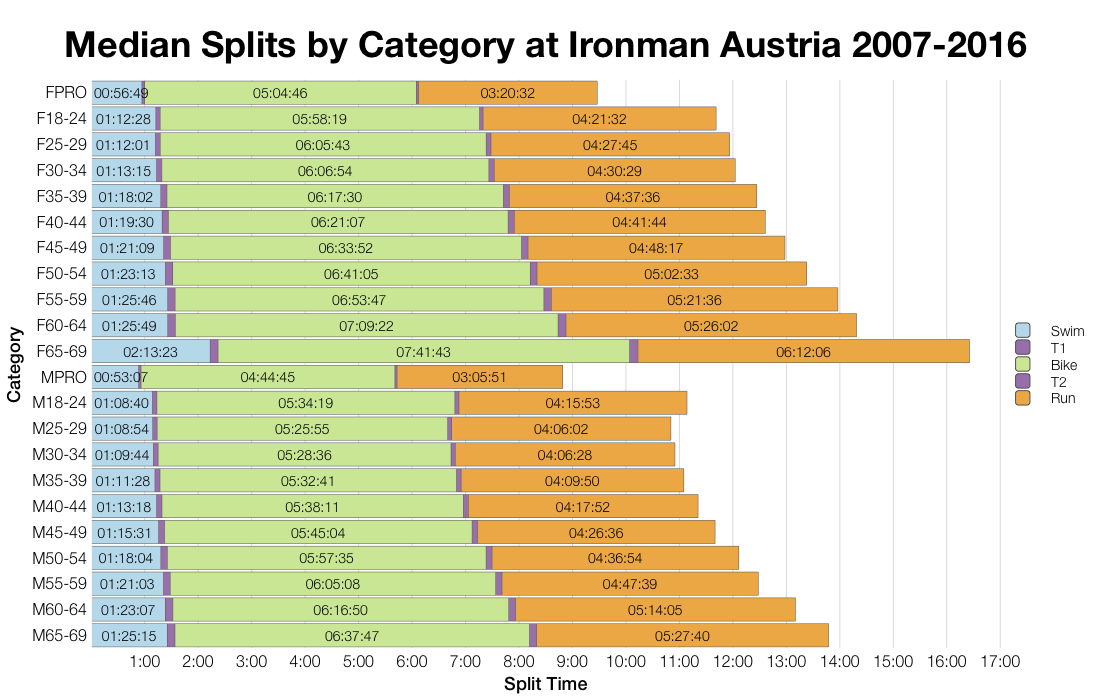
Comparison of the median splits for individual age groups tends to follow the trends shown in the distributions above. Focussing on the male age groups, where greater numbers are less influenced by outliers, we can see that bike times are slightly slower and run times faster.
| Count | Percentage | |
|---|---|---|
| Austria | 787 | 27.4 |
| Italy | 298 | 10.4 |
| Germany | 294 | 10.3 |
| United Kingdom | 291 | 10.1 |
| Israel | 216 | 7.5 |
| Spain | 146 | 5.1 |
| France | 84 | 2.9 |
| Belgium | 71 | 2.5 |
| United States | 69 | 2.4 |
| Ireland | 60 | 2.1 |
| Country | Percentage of Slots | Percentage of Field |
|---|---|---|
| Austria | 30.0 | 27.4 |
| Germany | 20.0 | 10.3 |
| Italy | 5.0 | 10.4 |
| Russia | 5.0 | 0.9 |
| United Kingdom | 5.0 | 10.1 |
| Switzerland | 5.0 | 1.4 |
| France | 5.0 | 2.9 |
| Norway | 5.0 | 0.2 |
| United States | 5.0 | 2.4 |
| Sweden | 2.5 | 1.1 |
| United Arab Emirates | 2.5 | 0.0 |
| Hungary | 2.5 | 0.7 |
| Czech Republic | 2.5 | 1.6 |
| Belgium | 2.5 | 2.5 |
| Slovenia | 2.5 | 1.3 |
There’s a diverse draw of nationalities to Austria, but half the Kona slots stay at home or go to neighbouring Germany.
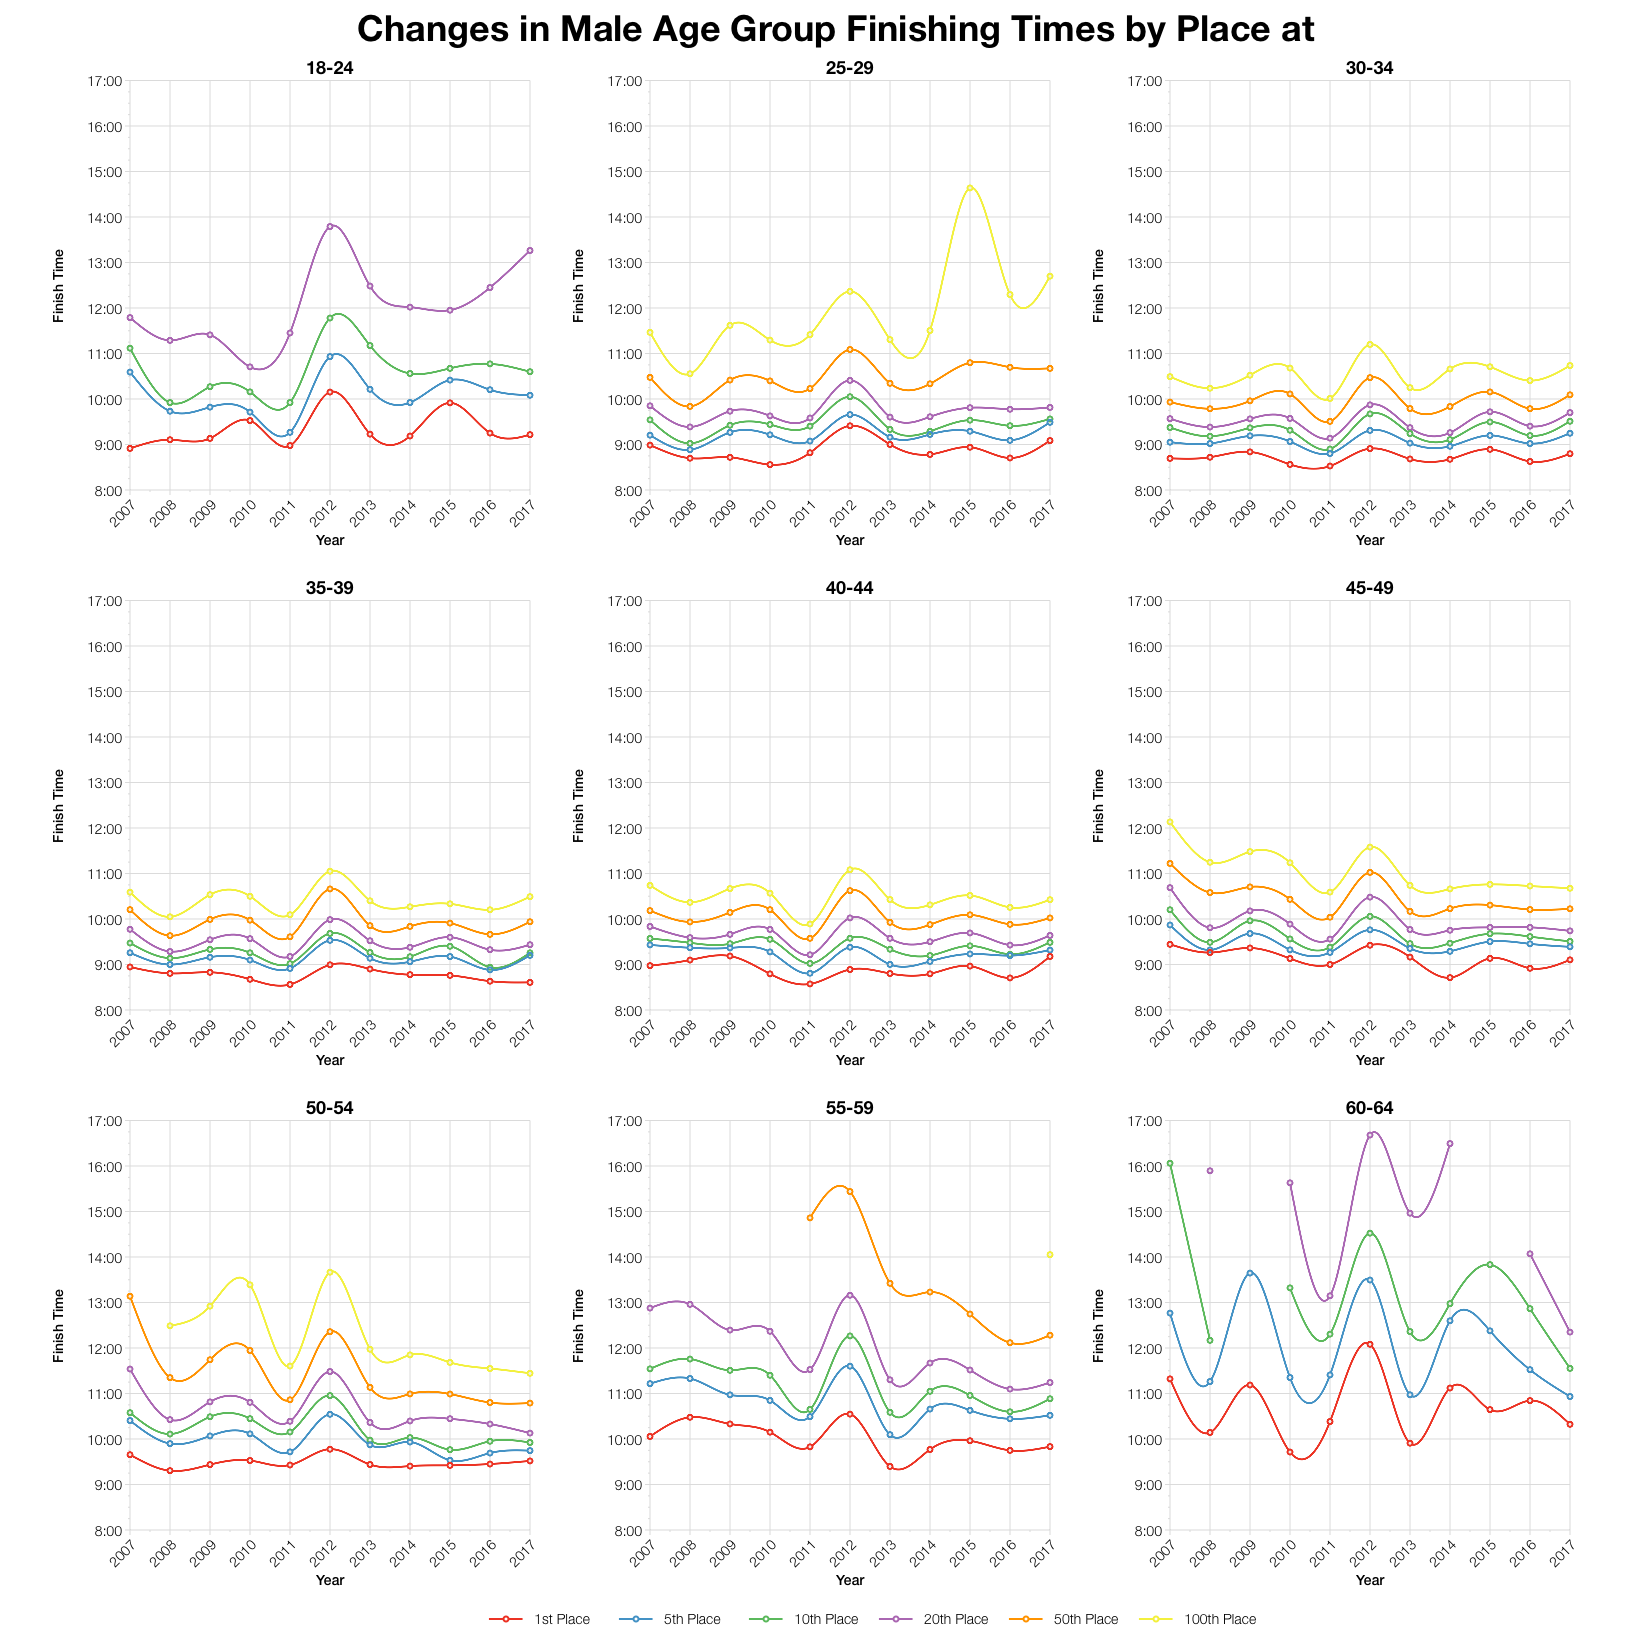
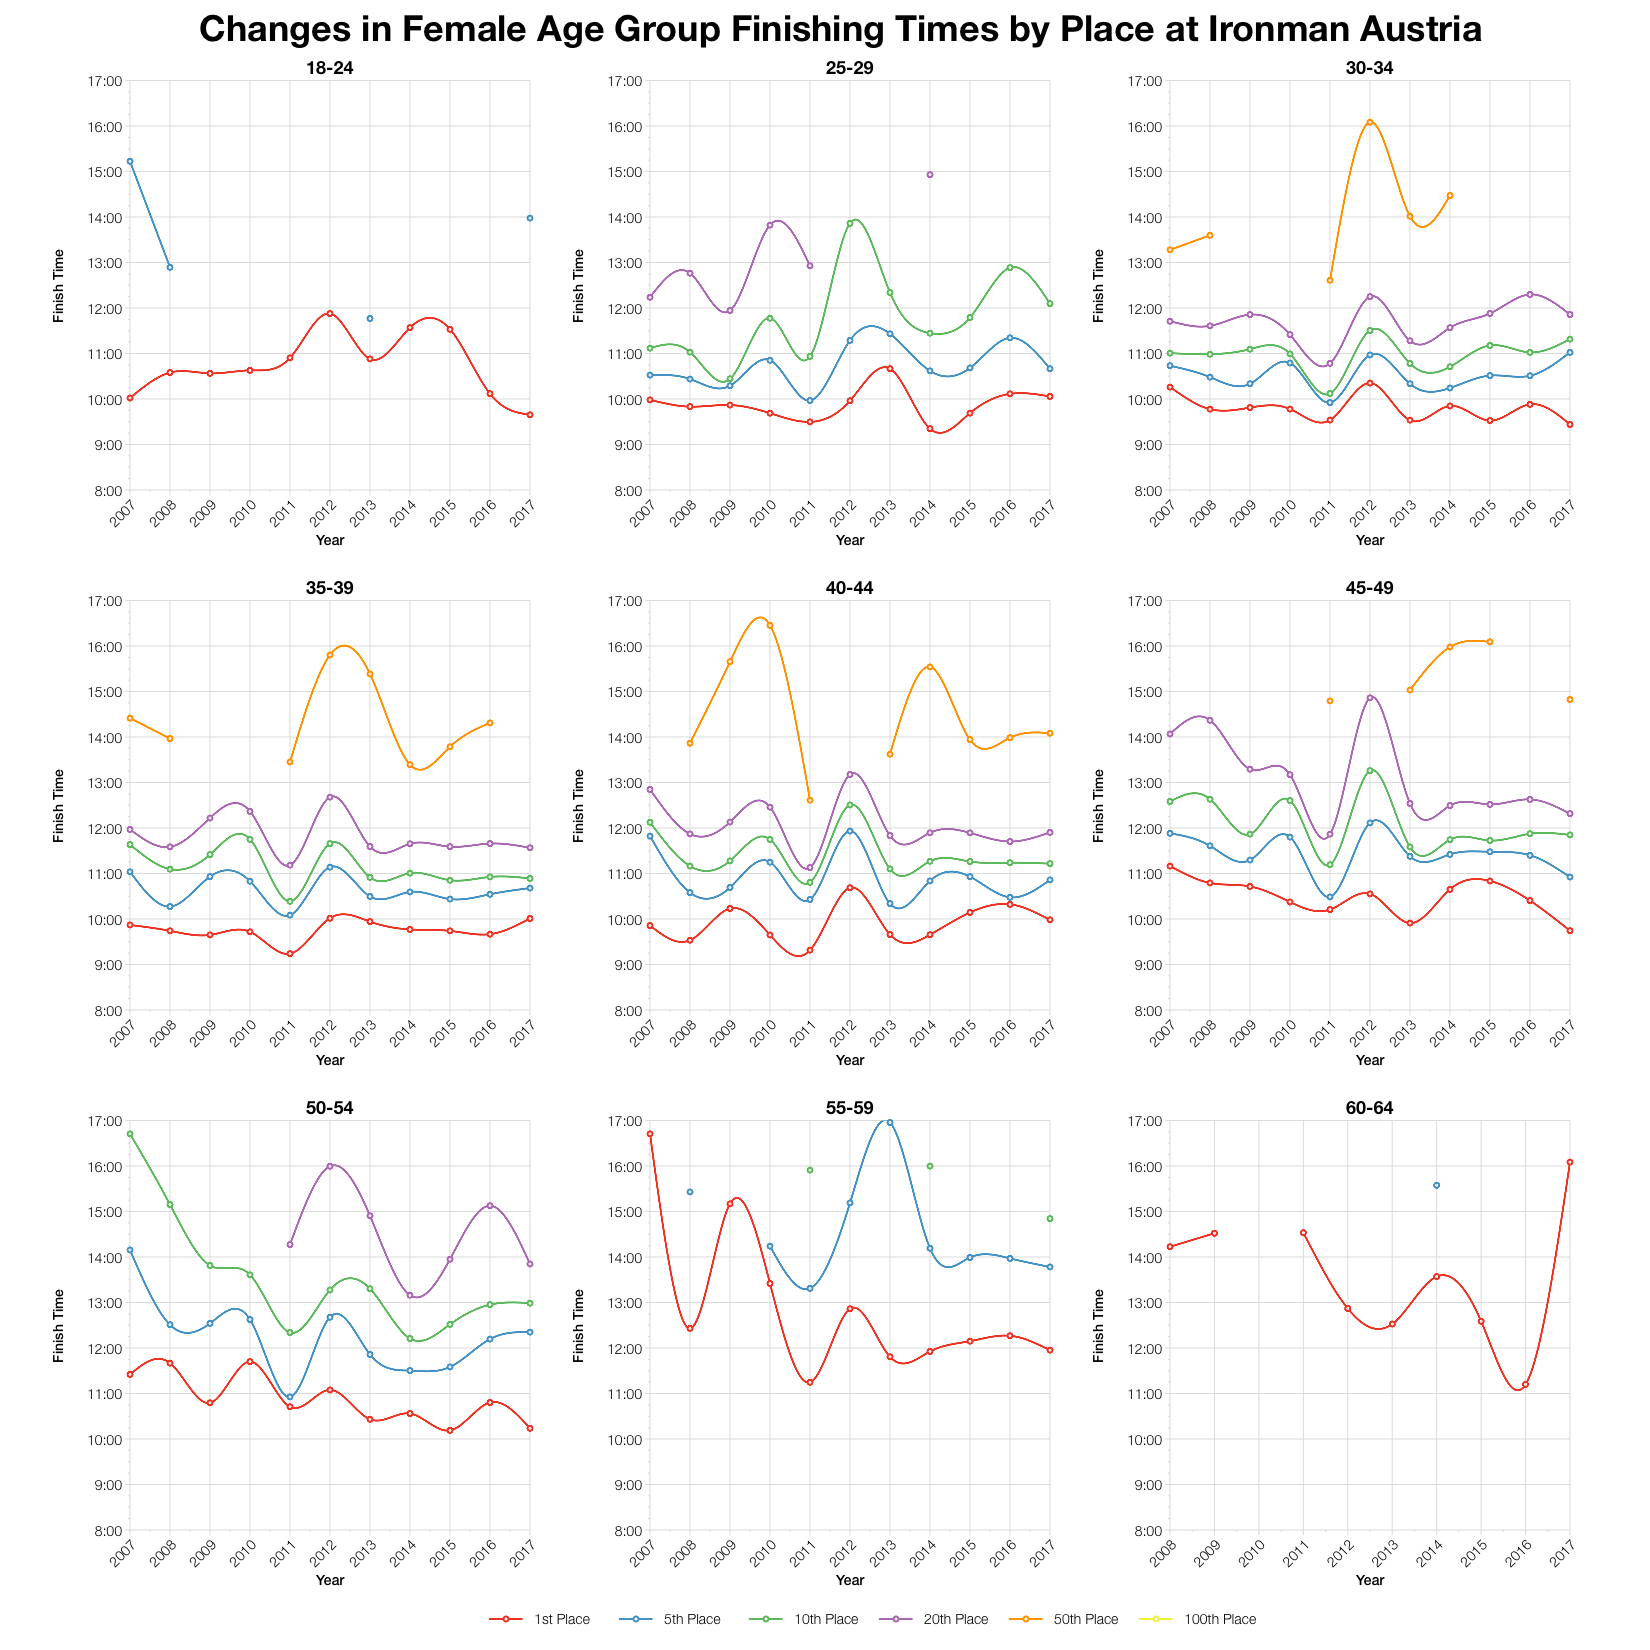
Tracking times for age group positions over the years confirms that this event sits somewhere in the middle for speed. For most ages and places there have been faster and slower years over the last decade.
| Slots | Winner | Average Kona Qualifier | Final Qualifier | |
|---|---|---|---|---|
| M18-24 | 1 | 9:12:56 | 9:12:56 | 9:12:56 |
| M25-29 | 2 | 9:05:09 | 9:09:59 | 9:14:49 |
| M30-34 | 3 | 8:47:47 | 9:00:00 | 9:13:35 |
| M35-39 | 4 | 8:36:25 | 8:54:21 | 9:06:58 |
| M40-44 | 5 | 9:10:36 | 9:14:39 | 9:19:02 |
| M45-49 | 4 | 9:06:06 | 9:13:22 | 9:18:18 |
| M50-54 | 3 | 9:31:04 | 9:31:50 | 9:33:06 |
| M55-59 | 2 | 9:49:55 | 9:53:52 | 9:57:49 |
| M60-64 | 1 | 10:19:27 | 10:19:27 | 10:19:27 |
| M65-69 | 1 | 11:12:51 | 11:12:51 | 11:12:51 |
| M70-74 | 1 | 12:00:15 | 12:00:15 | 12:00:15 |
| M75-79 | 1 | 16:10:21 | 16:10:21 | 16:10:21 |
| F18-24 | 1 | 9:39:07 | 9:39:07 | 9:39:07 |
| F25-29 | 1 | 10:03:22 | 10:03:22 | 10:03:22 |
| F30-34 | 1 | 9:26:25 | 9:26:25 | 9:26:25 |
| F35-39 | 1 | 10:00:39 | 10:00:39 | 10:00:39 |
| F40-44 | 2 | 9:58:53 | 10:20:40 | 10:42:27 |
| F45-49 | 2 | 9:44:31 | 9:52:39 | 10:00:47 |
| F50-54 | 1 | 10:14:10 | 10:14:10 | 10:14:10 |
| F55-59 | 1 | 11:57:12 | 11:57:12 | 11:57:12 |
| F60-64 | 1 | 16:05:09 | 16:05:09 | 16:05:09 |
| F65-69 | 1 | 13:23:07 | 13:23:07 | 13:23:07 |
Based on the athlete tracker I’ve estimated the slot allocation and from that the times that would automatically qualify at the race. Numbers will vary based on actual start numbers and the roll down process. You can find more qualification stats for Austria and all of the Ironman races on my Kona qualification page.
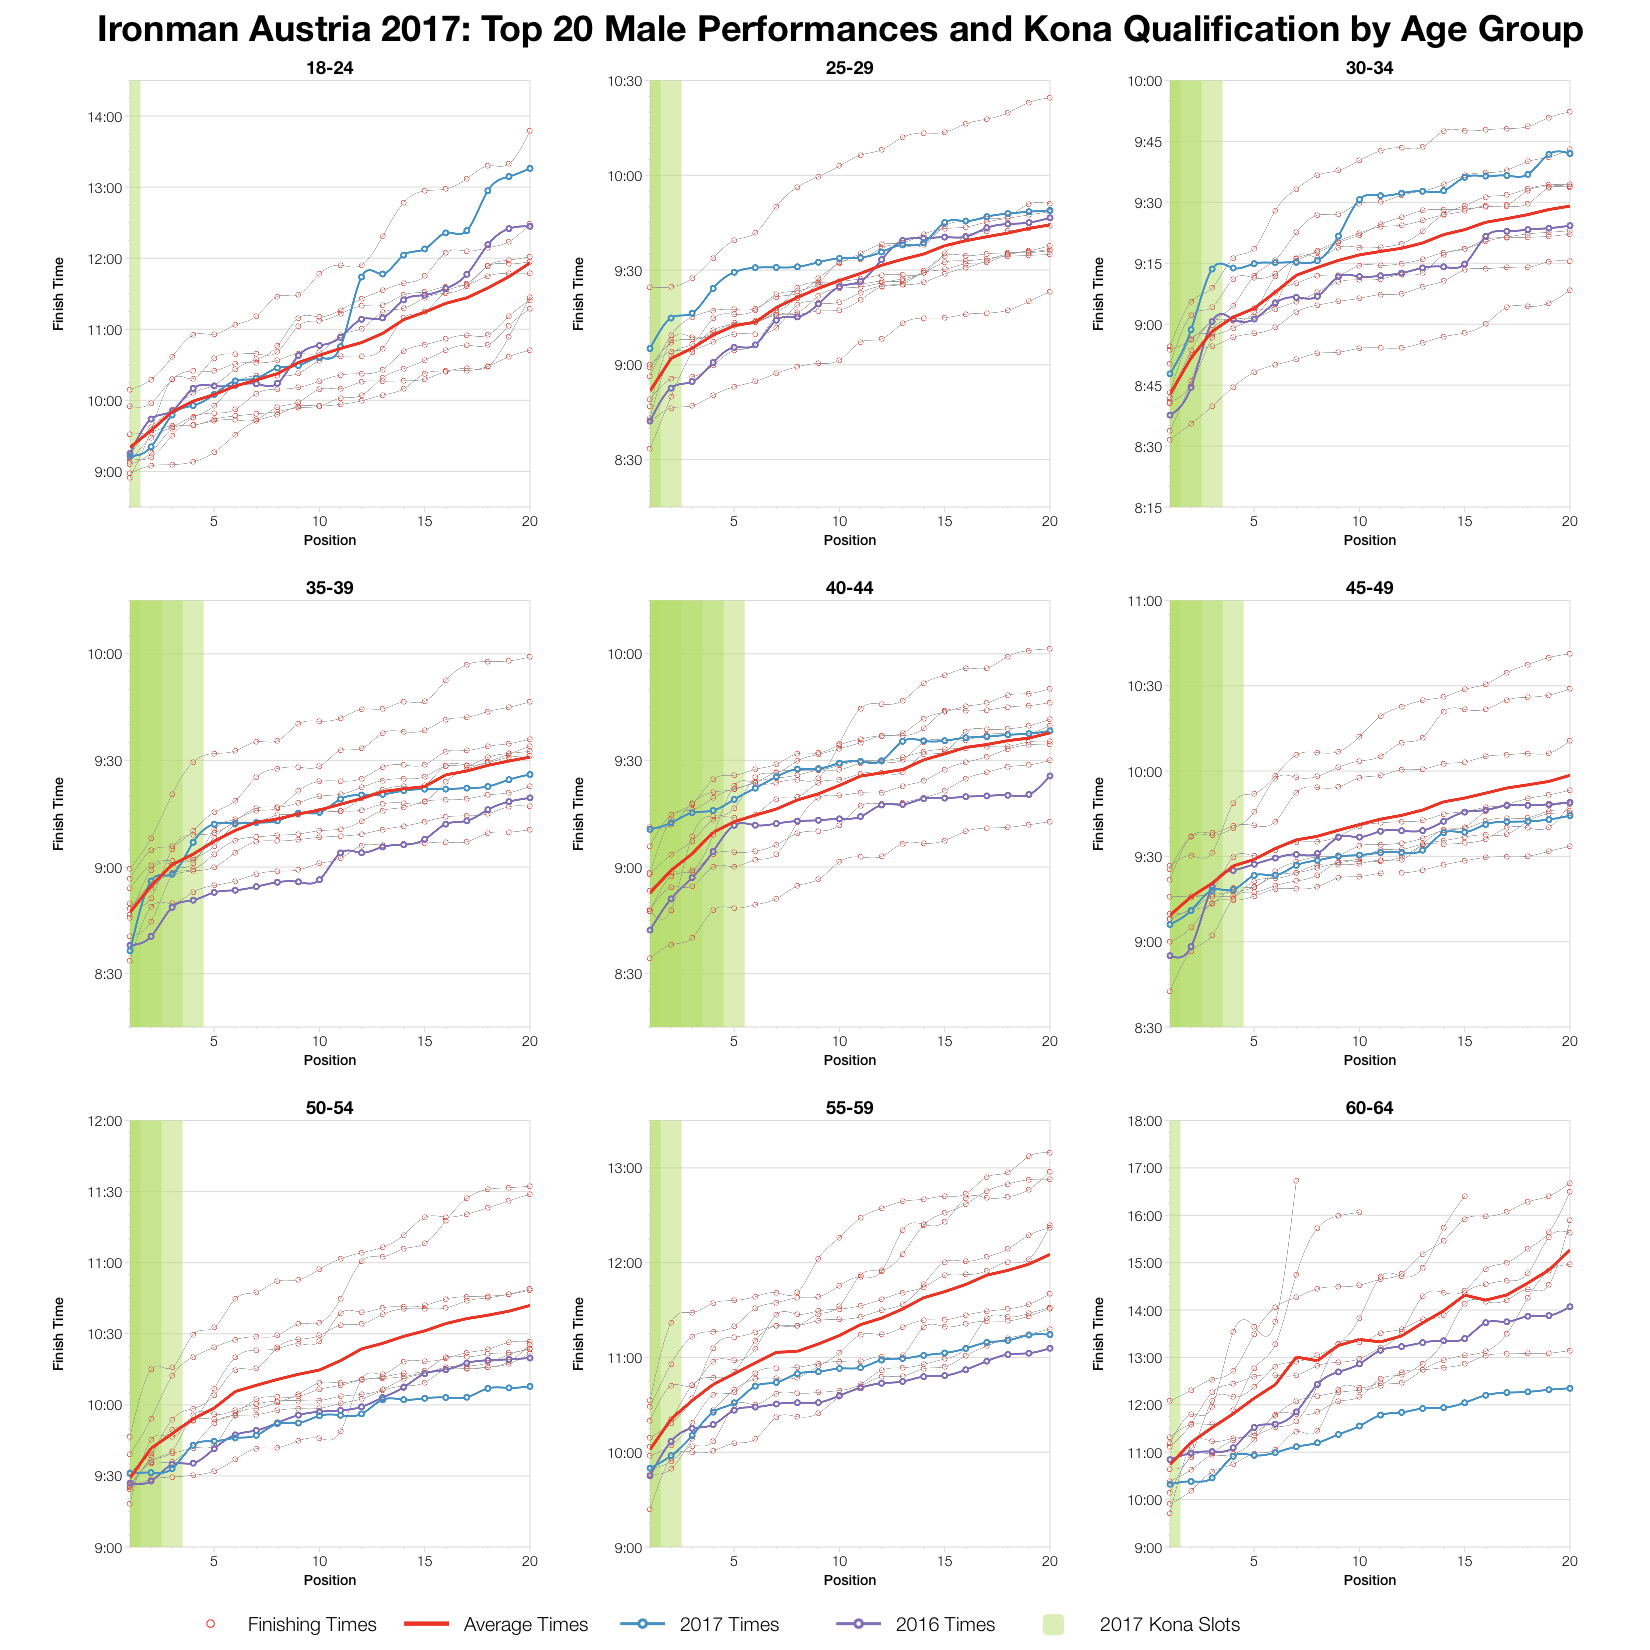
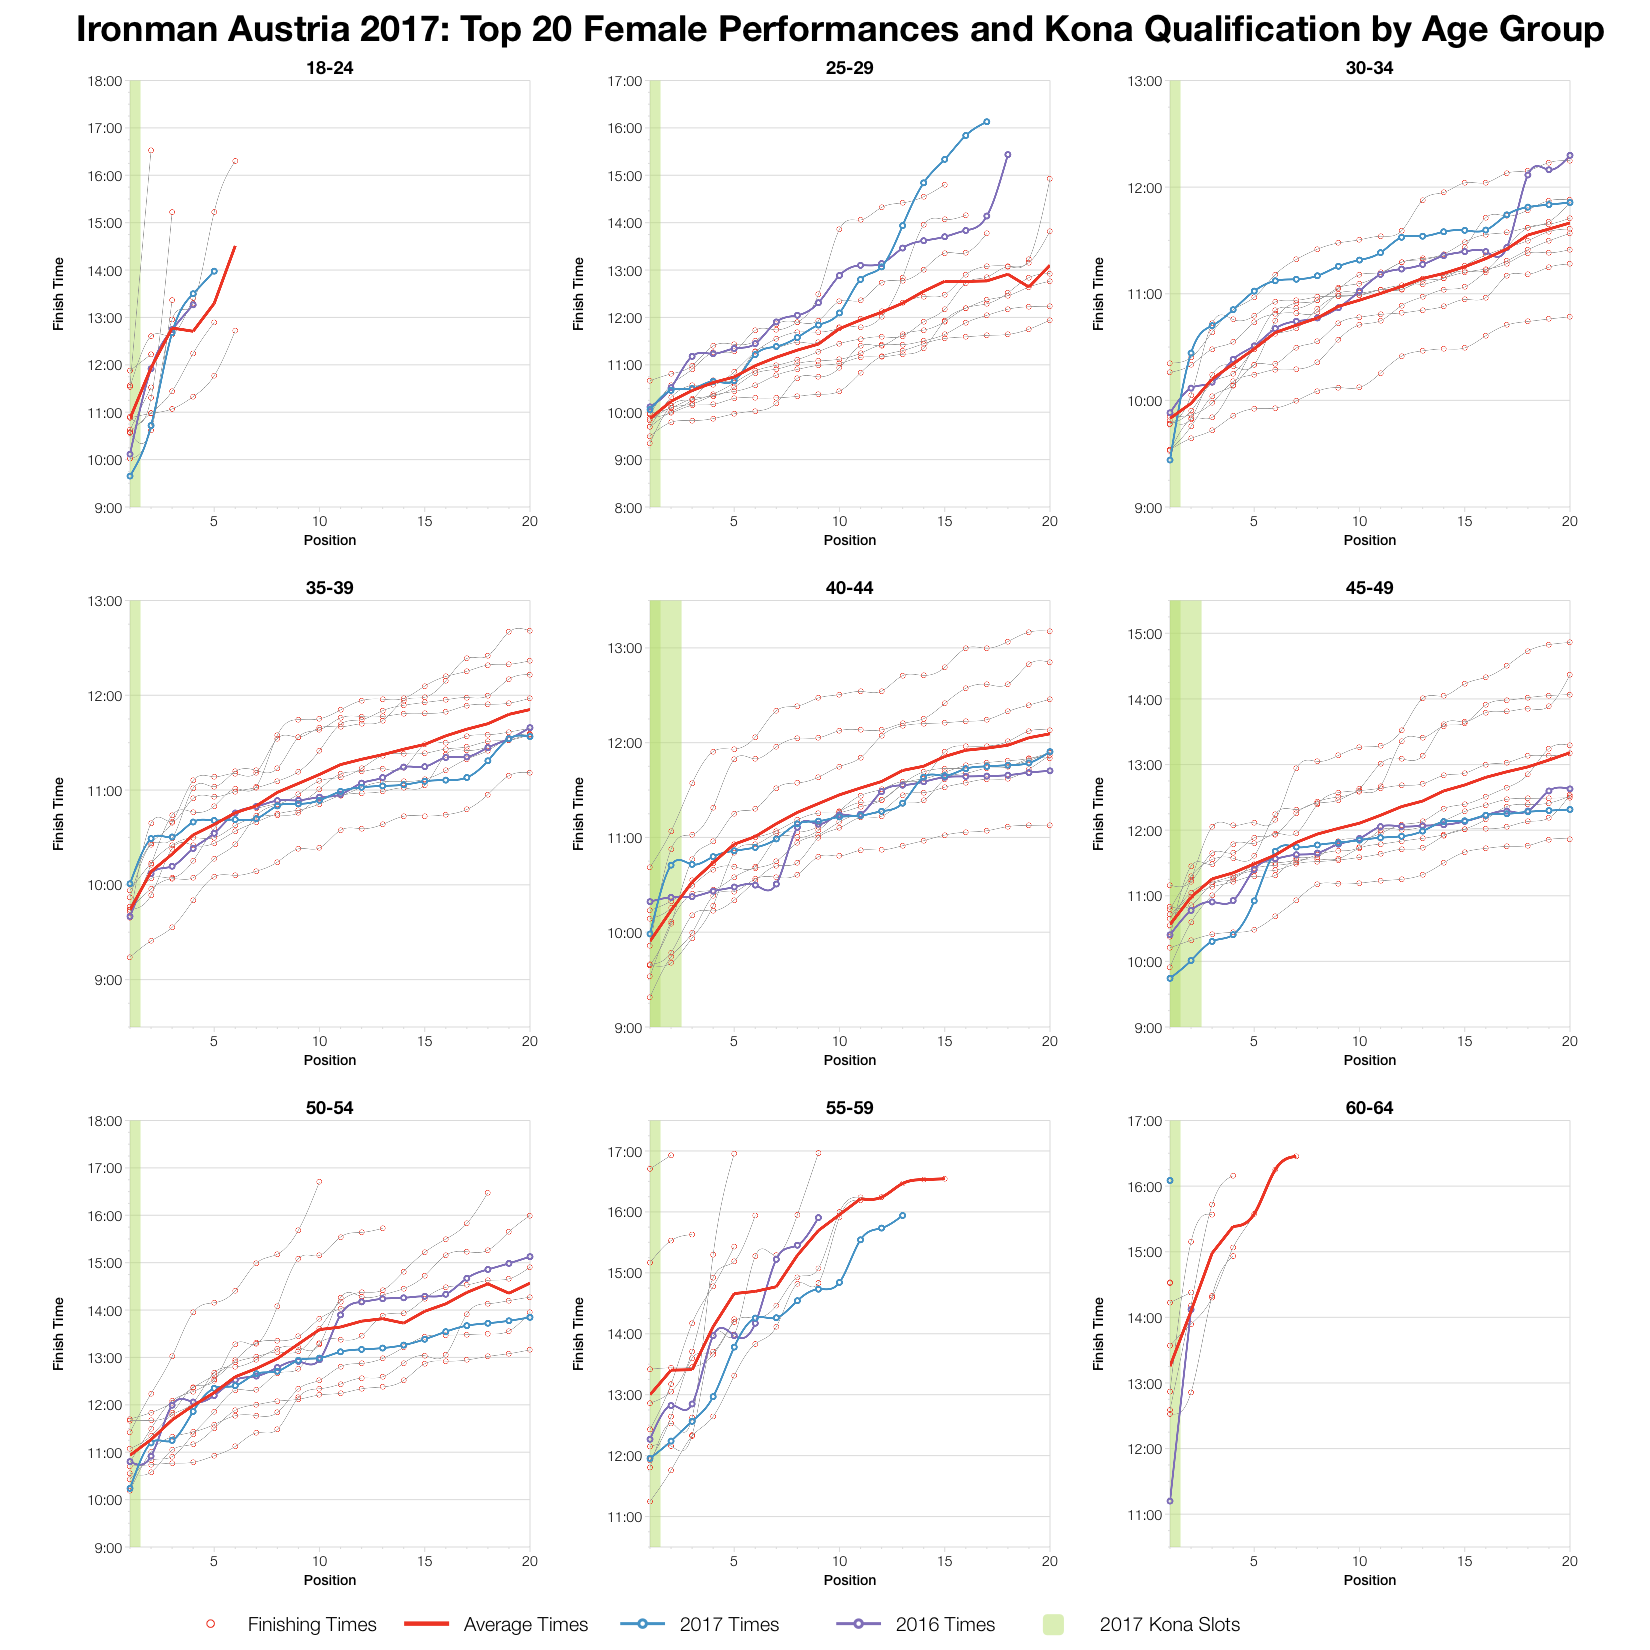
Finally, the times of the top twenty in each age group. It varies across the divisions, some were slower this year, some faster, but overall times fall quite close to the course averages and away from the extremes. By and large it was a typical qualifying year in Klagenfurt.
You can access a spreadsheet of the full results from Ironman Austria 2017 on my Google Drive.


