Second of the weekend’s Ironman races was Ironman Chattanooga. Like most US races it pulls in over 2,000 athletes and offers 40 Kona qualification slots for the fastest age groupers. Last year’s race was tough with hot and humid conditions leading to a high level of DNFs and an unusually slow race. 2017 isn’t quite as extreme, but equally doesn’t fully match the times from the first couple of years of the event.
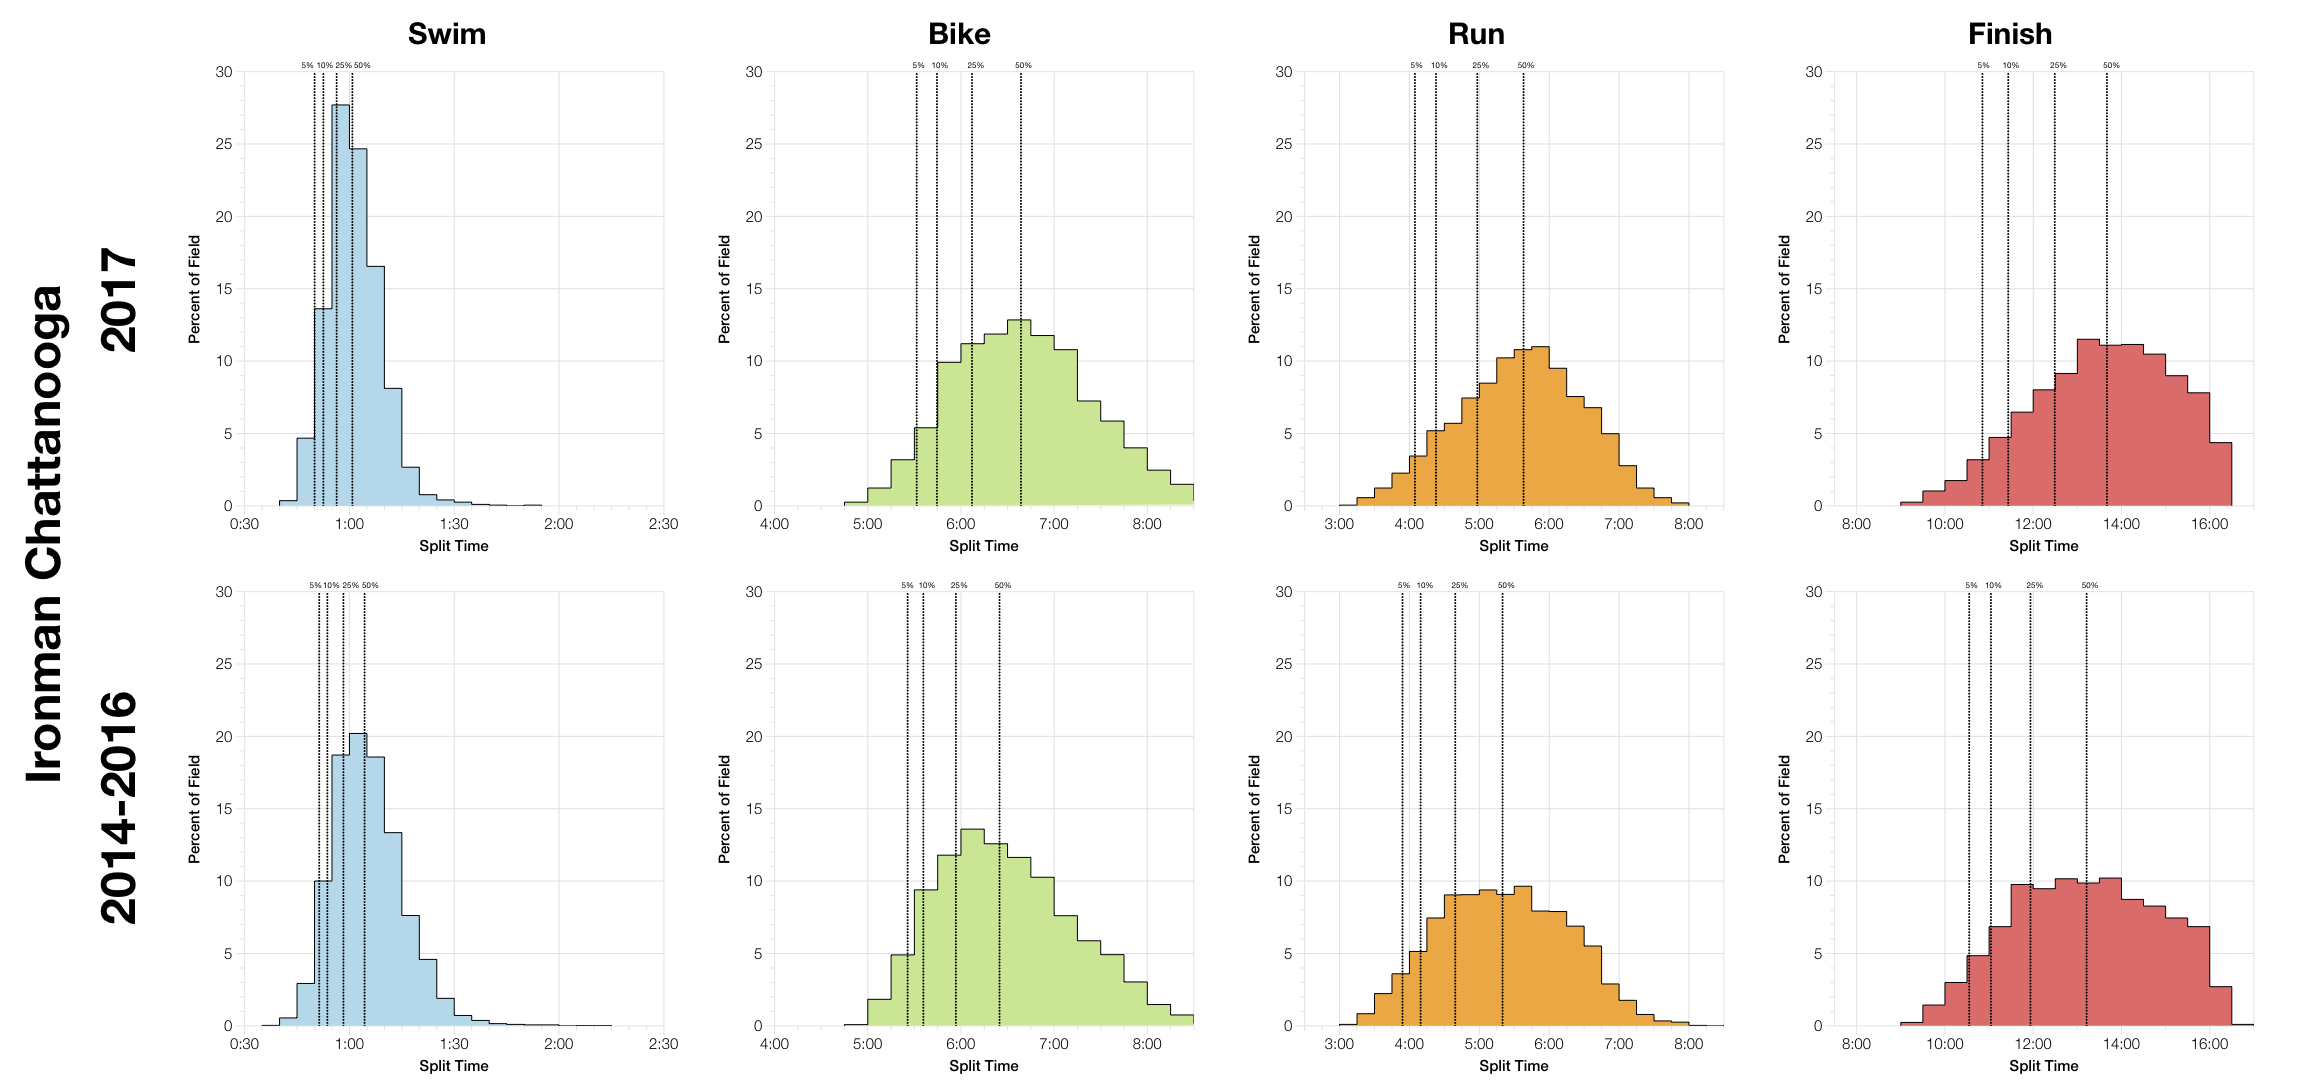
With the exception of the swim, every other stage of this race trended slower this year. As we’ll see later, 2016 is the slowest year on the course, but when combining all the historical results this is balanced out. So 2017 trends slower than the amalgamated results for the course. Only the swim proved faster and here times are more concentrated – the median is faster, but the top 5% are largely the same.
The DNF rates of this year’s race stretch a little higher than the first two years, but don’t compare to 2016 which had exceptional numbers for the run. Clearly not the fastest or easiest running of the course, but not as extreme as the year before.
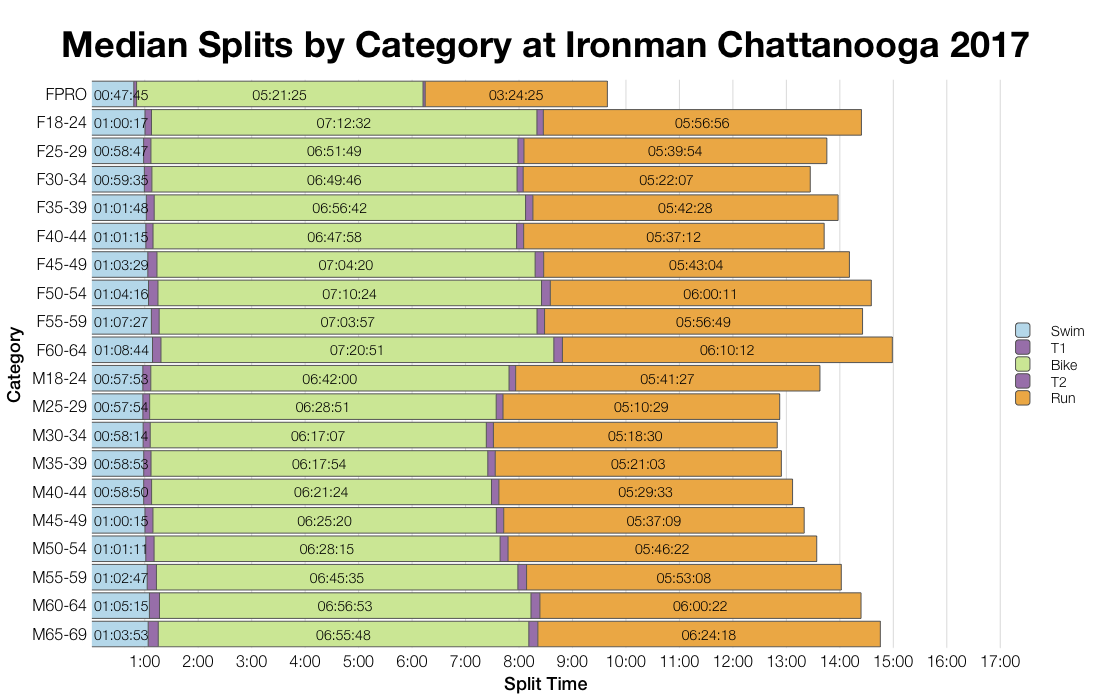
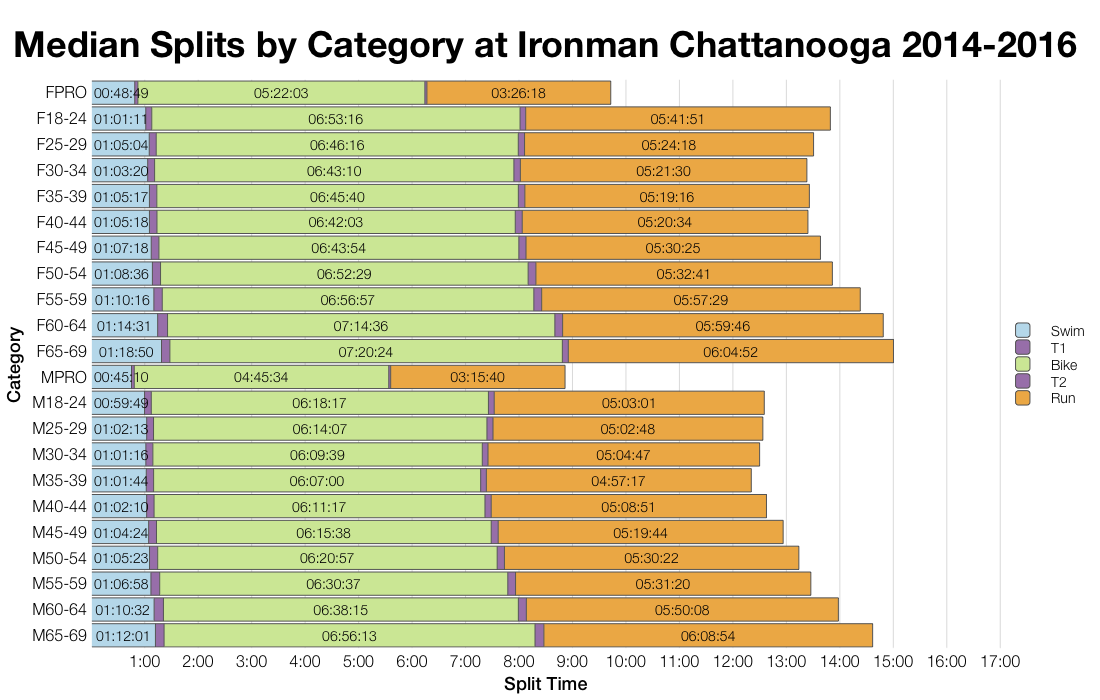
As with the distributions individual age group medians trend slower in bike and run while the swim is largely comparable. Again the historic results average out the unusually slow times of 2016.
The majority of the field comes from the US and that’s where the majority of Kona slots go too. A handful are spread round the other nations present.
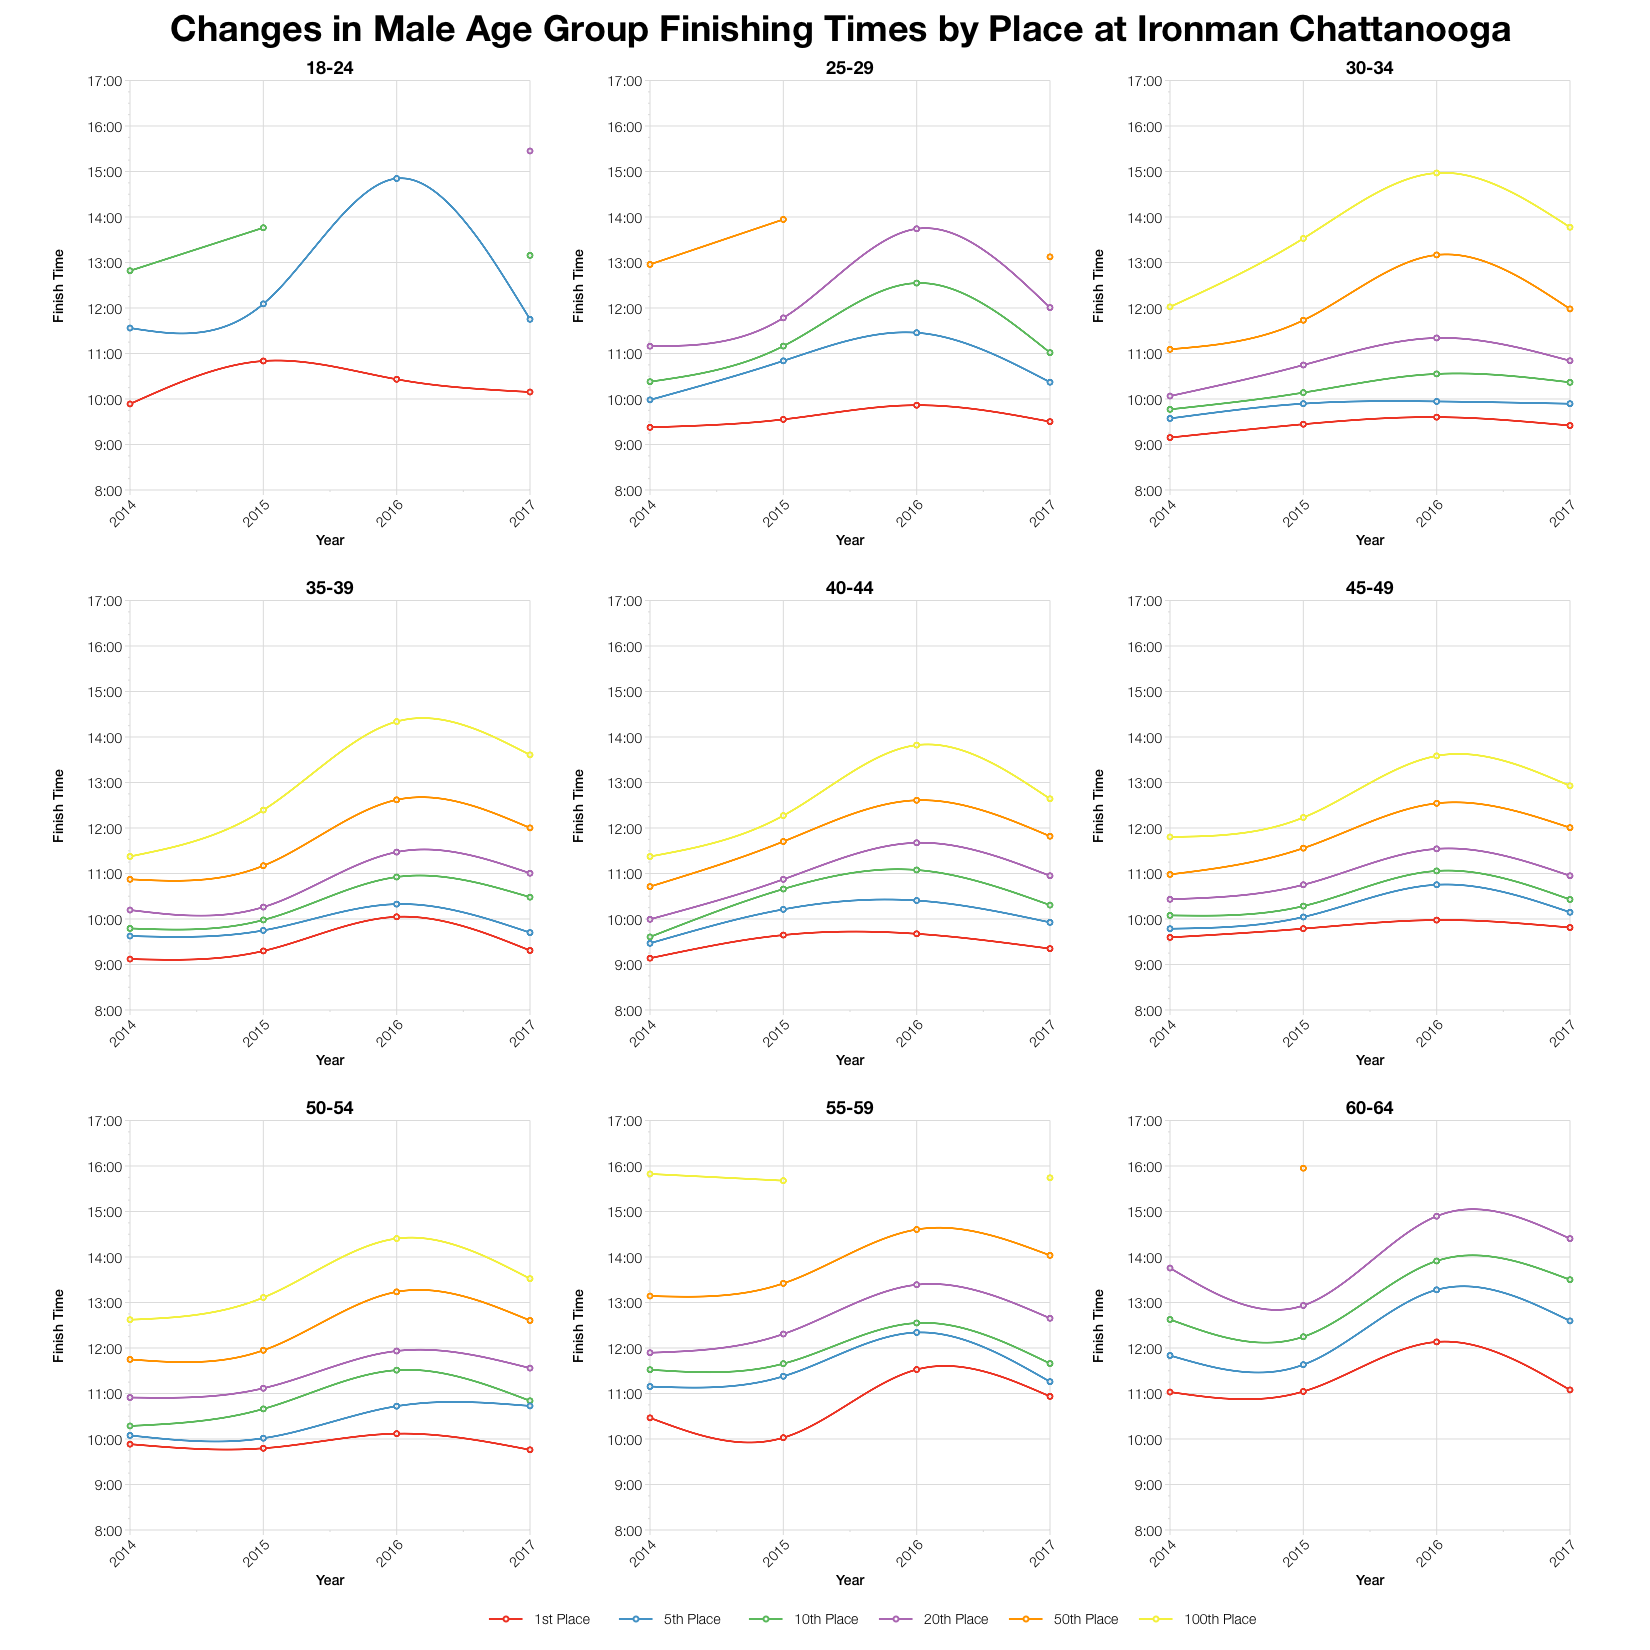
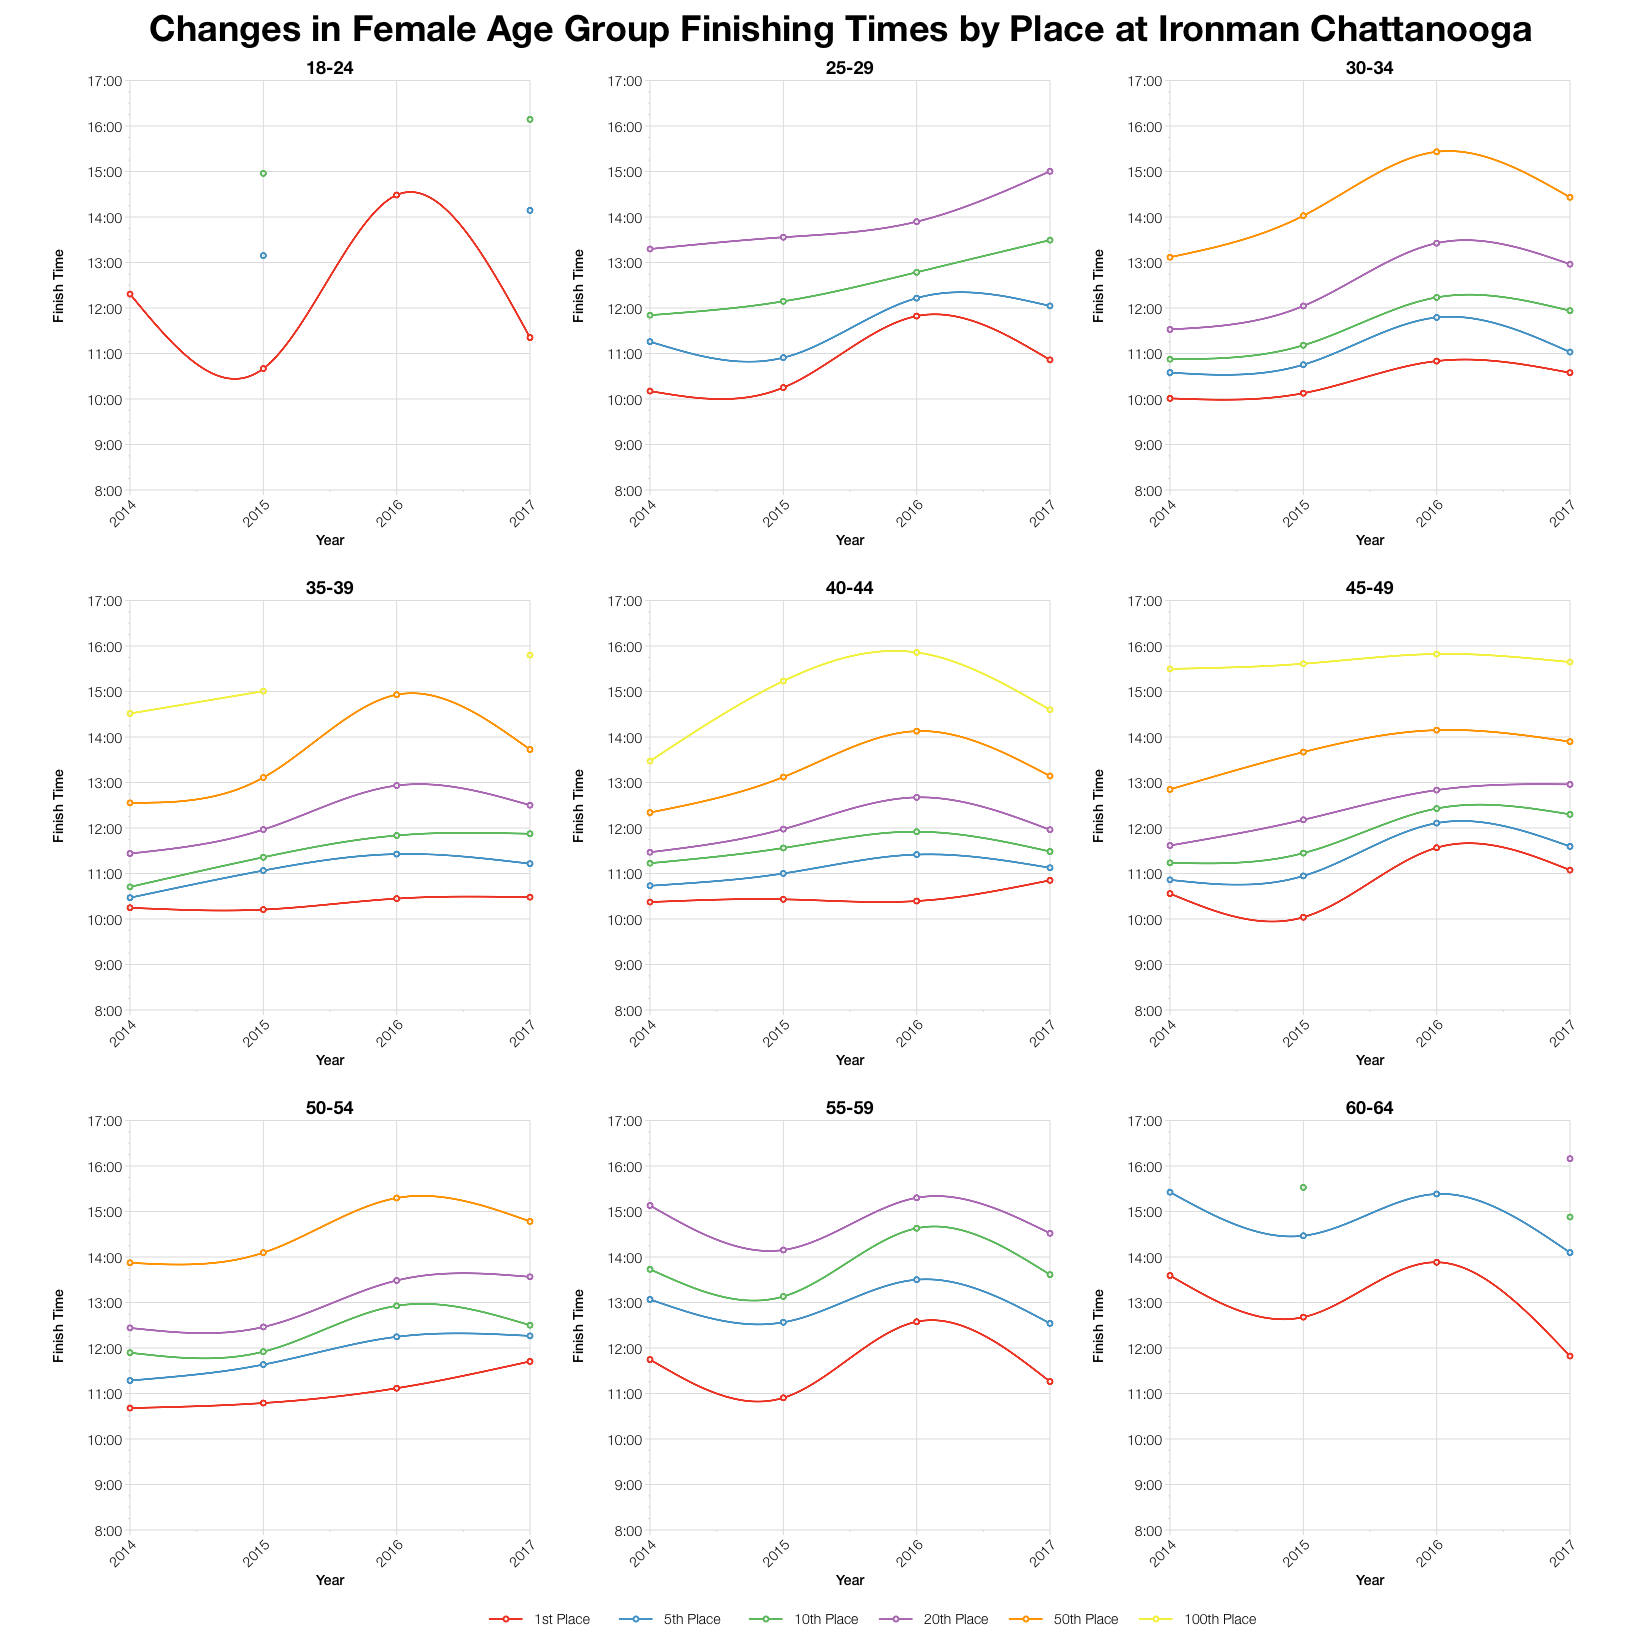
Tracking times over the 4 years of the race highlights how much slower 2016 was and how this year’s race falls more inline with earlier results. It also shows how the impact of tough conditions is felt more strongly further back in the field – you can see how first place times tend to be more consistent. Towards the front of each age group times aren’t too different this year, it’s further back where they remain slower.
Based on entry numbers I’ve calculated the likely Kona slot allocation in Chattanooga and from that the automatic qualification times in each age group. Actual numbers may vary slightly and roll down would affect final qualification times. You can compare with other races on my Kona qualification page.
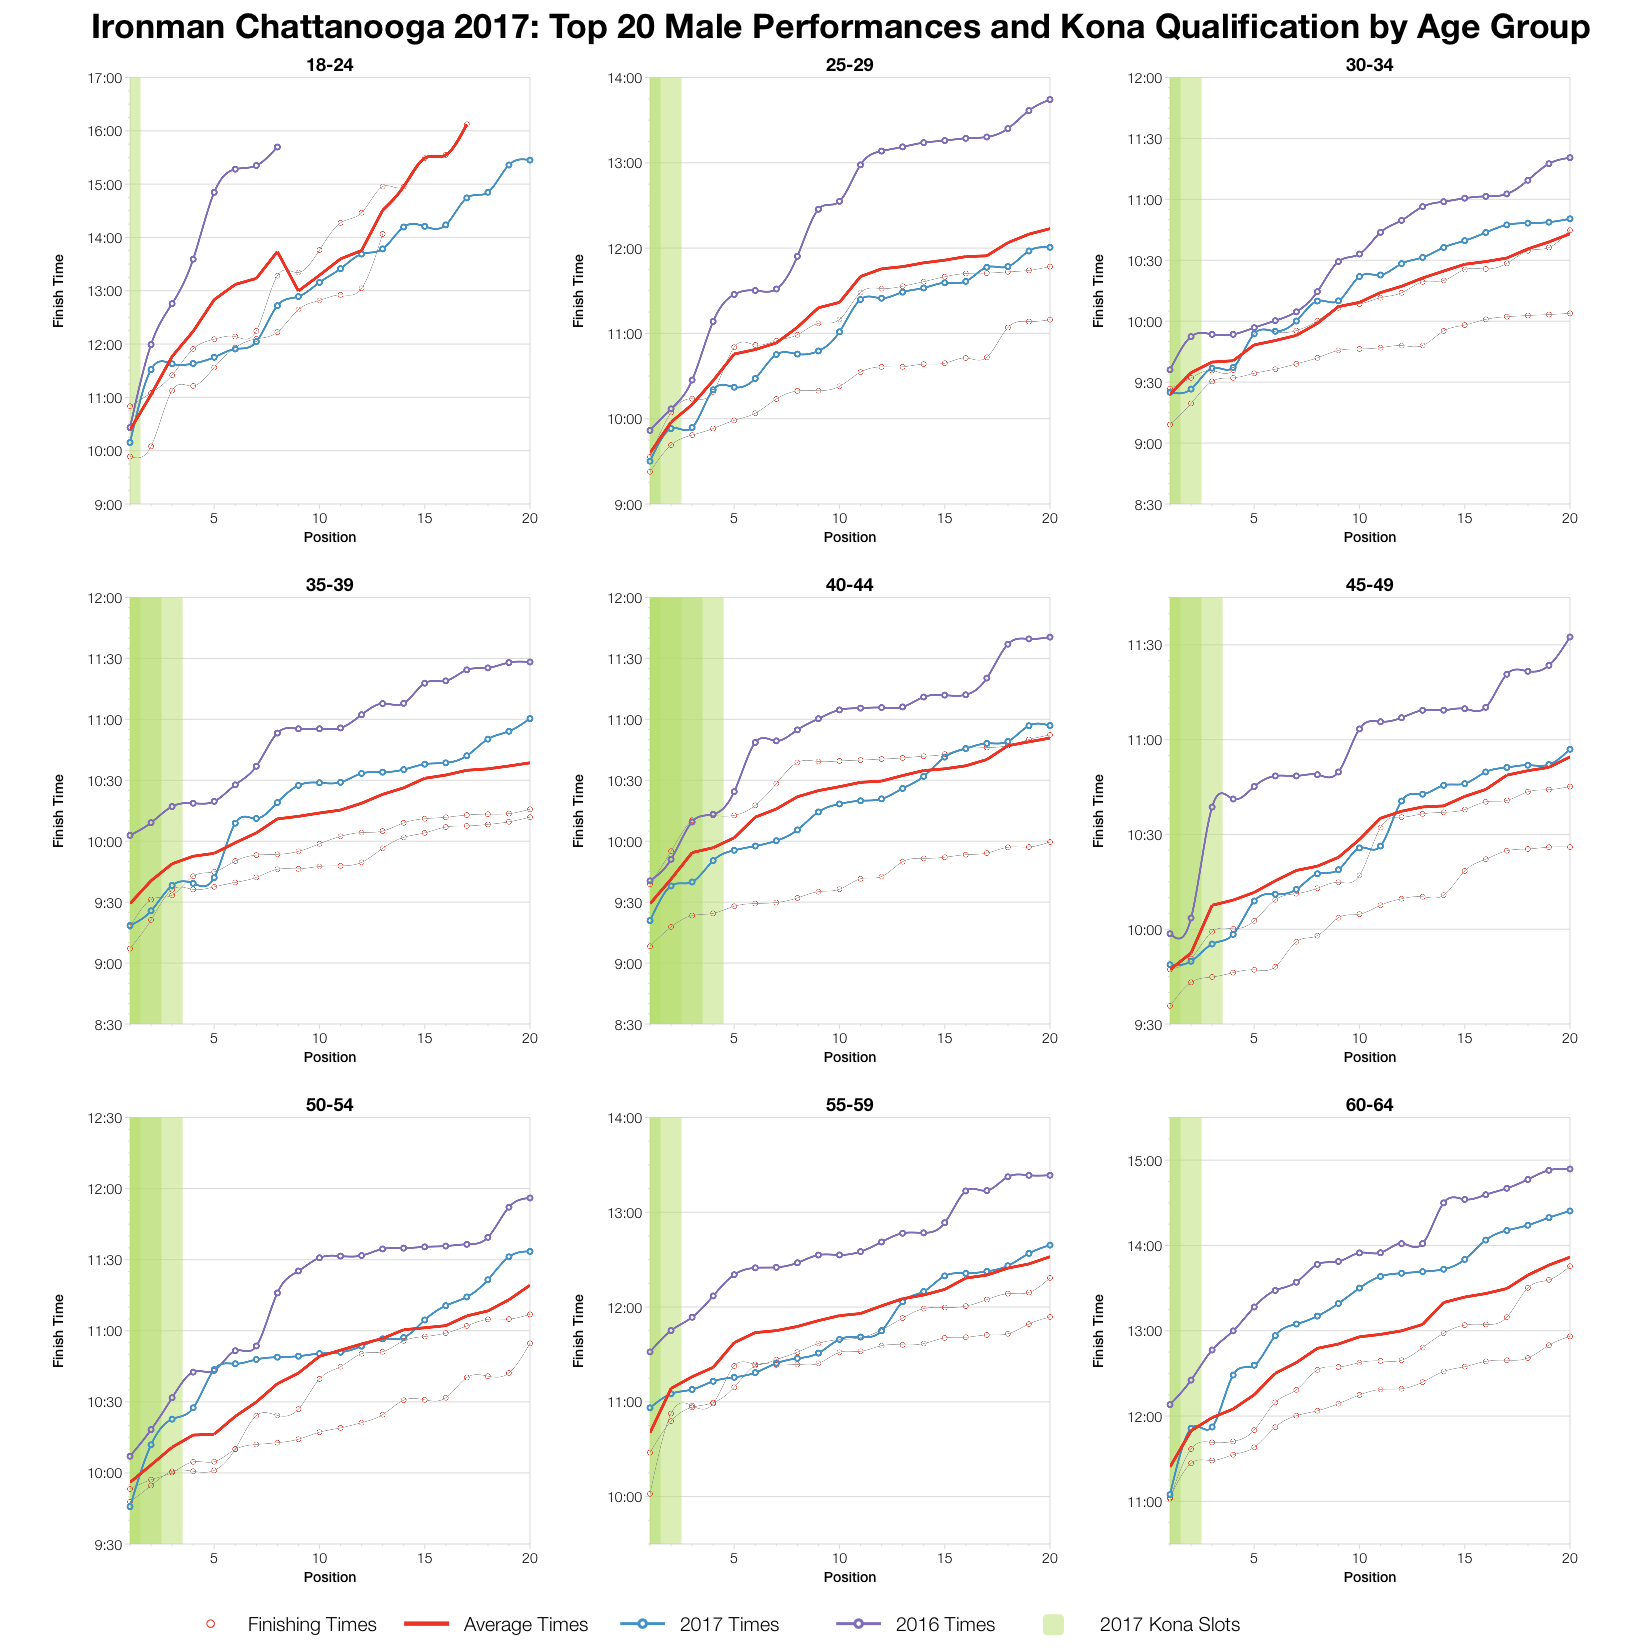
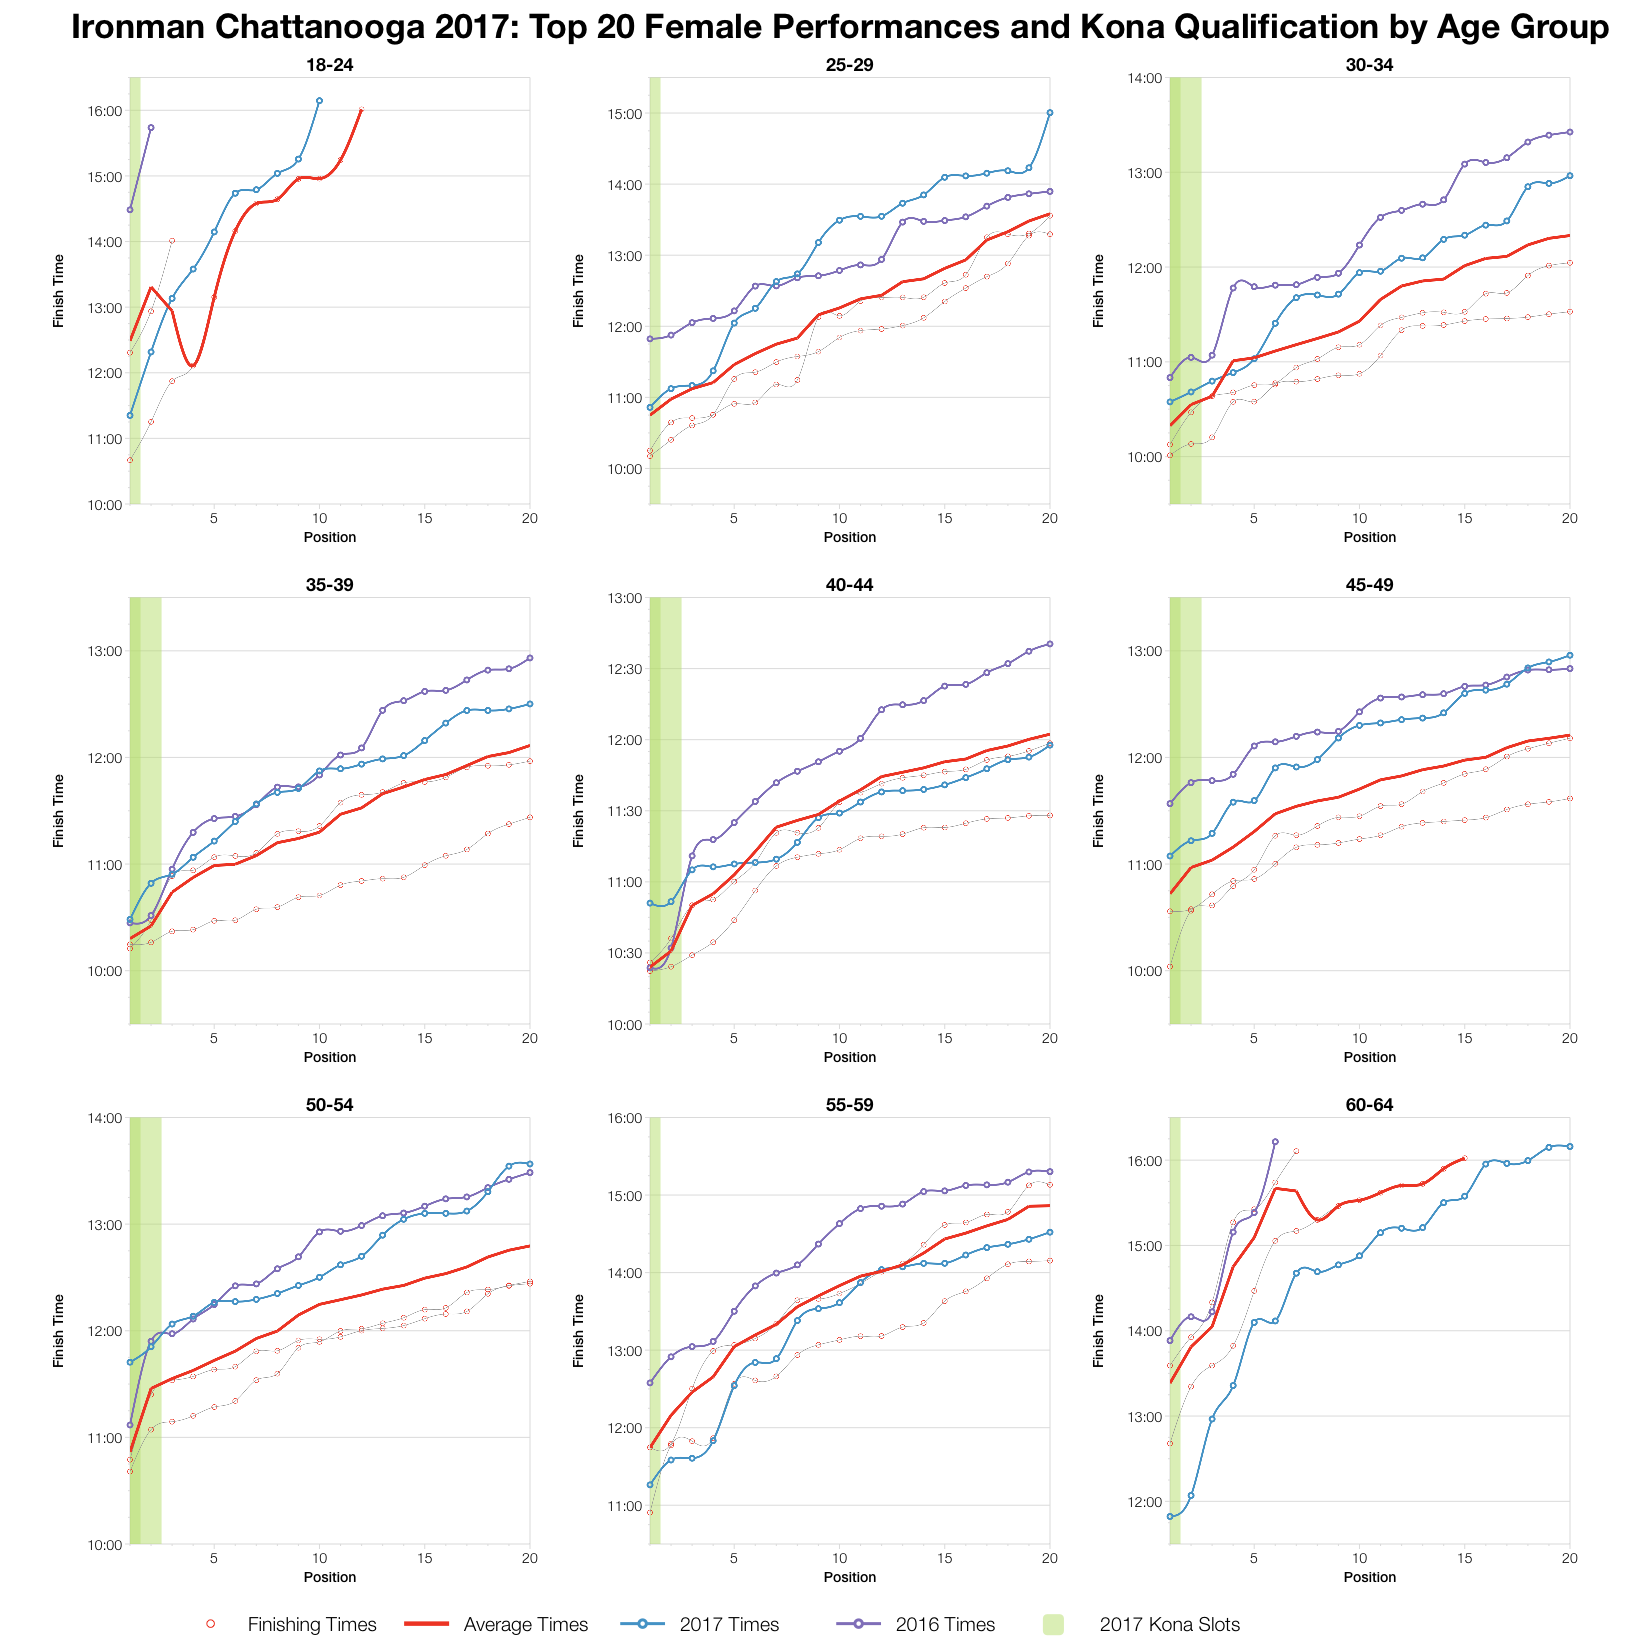
Finally the top twenty for each age group. There’s clear variation here, but for the most part the results lie around the average for the course. Not as slow as 2016 and not the fastest times for Chattanooga either. In most male age groups the winner falls very close to the average line as do the Kona qualifiers; things are a little more varied for the female age groups though.
You can access a spreadsheet of the full results and splits from Ironman Chattanooga 2017 on my Google Drive.


