Ironman Taiwan 2017: Age Group Results and Kona Qualification

Latest statistics for Ironman Taiwan

The second Ironman race of the weekend, Ironman Taiwan, was perhaps the smallest race of the season with fewer than 500 competitors. It also has the lowest number of Kona slots on offer – 25 distributed through the age groups present. The race itself is one of the slower Ironman events, but this may in part reflect the size and variance of the field along with the conditions.

Distribution of Finisher Splits at Ironman Taiwan 2017 Compared with 2015-2016

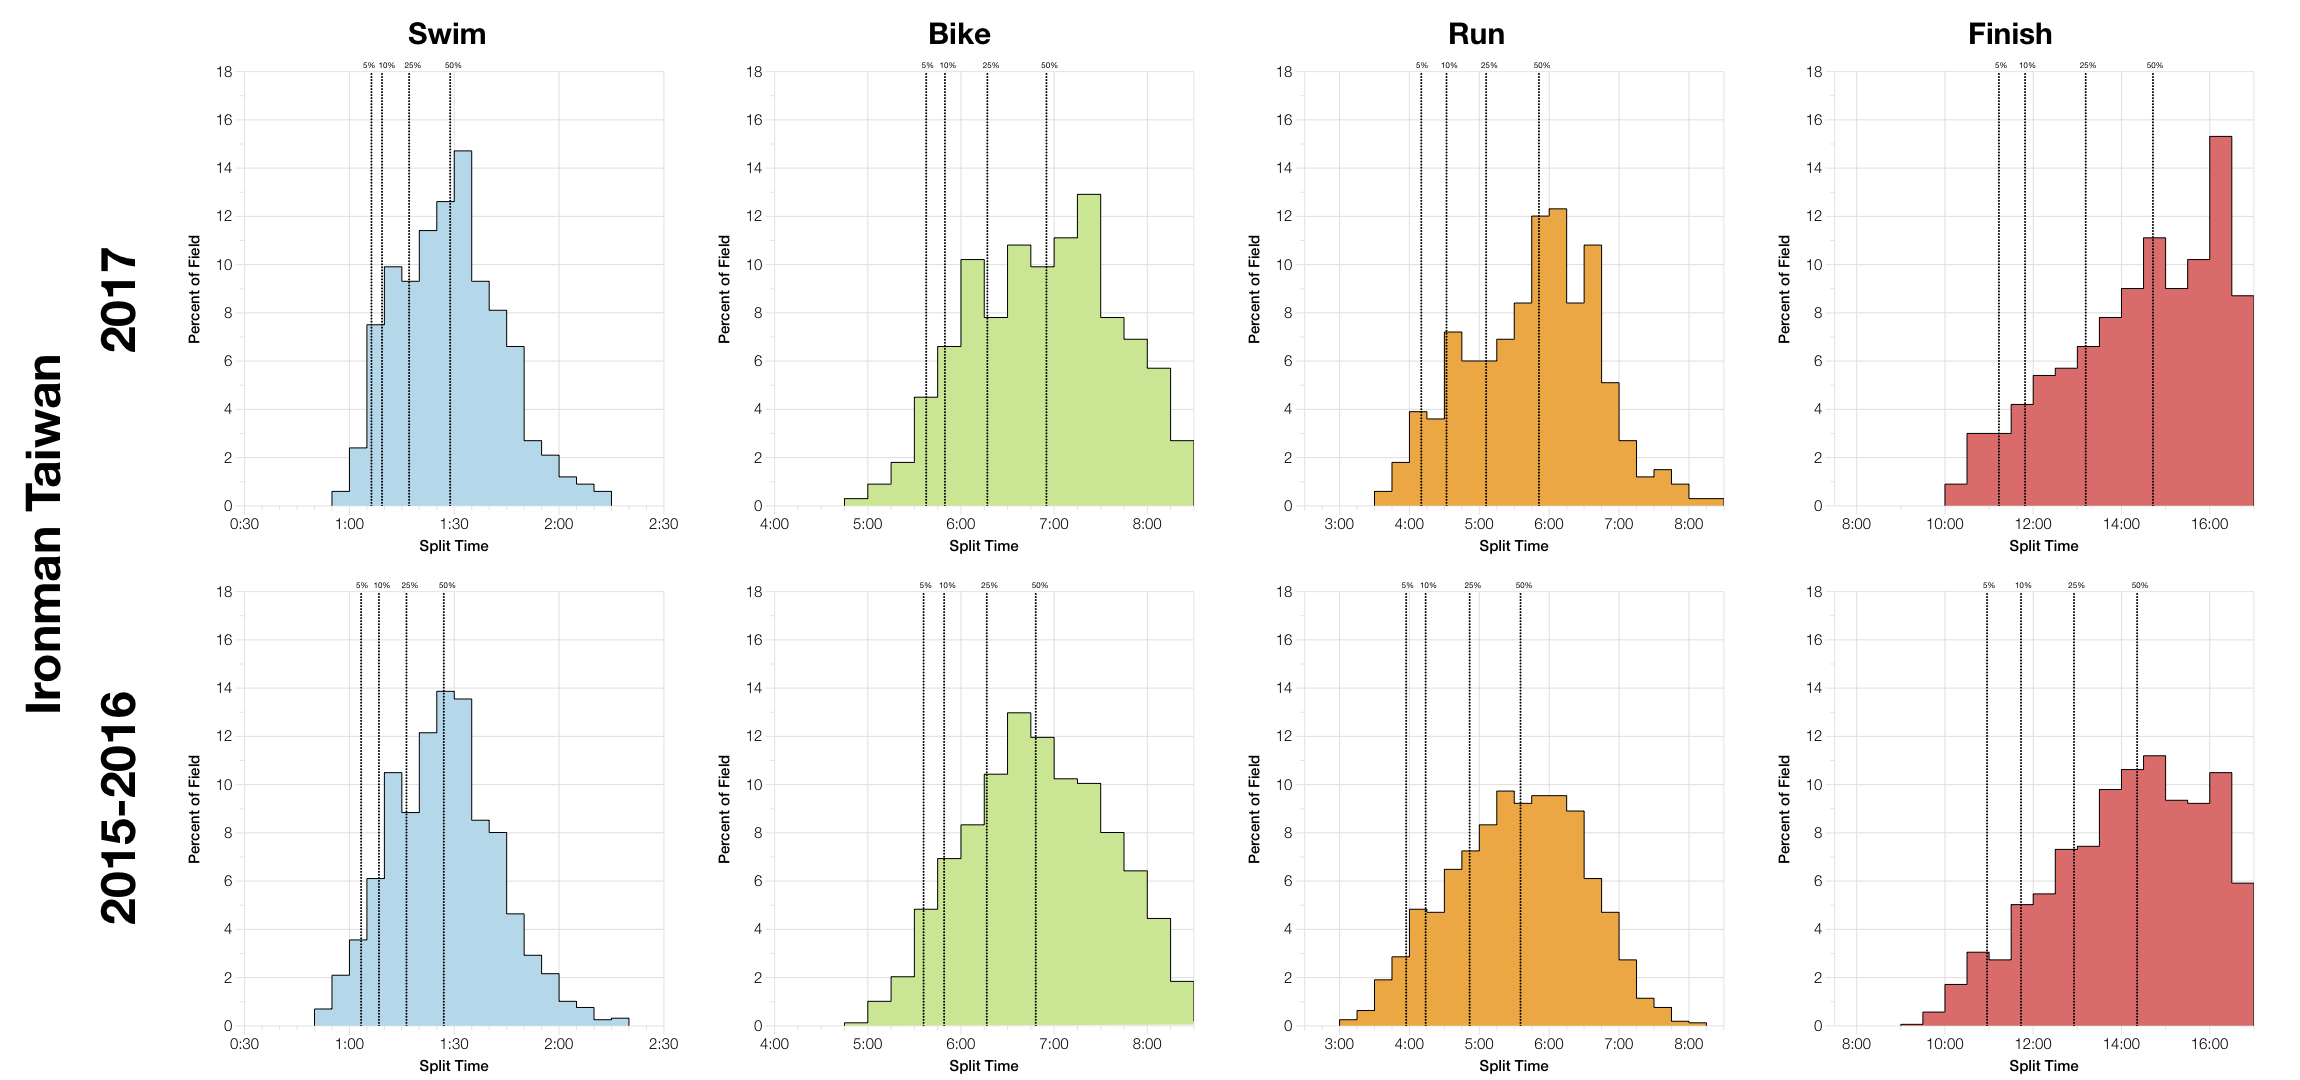
This year’s race trended slower than the previous two. It’s cumulative over all three disciplines, but most prominent on the run. The net effect is an overall distribution that’s 20-30 minutes slower than the historical results.

DNS and DNF Rates at Ironman Taiwan
Year
Listed Athletes
Swim Finish
Swim DNS/DNF
Bike Finish
Bike DNF
Run Finish
Run DNF
Overall DNS/DNF
2015
1023
888
13.2%
871
1.9%
815
6.4%
20.3%
2016
922
916
0.7%
881
3.8%
802
9%
13%
2017
428
425
0.7%
388
8.7%
340
12.4%
20.6%

Noting that the first year of results mixes in DNS numbers with the DNFs (inflating swim and overall figures) this year’s race saw a high proportion of the field DNF. Percentages were up on both bike and run, but with the field size so low the impact of drop outs is amplified.

Median Splits by Age Group at Ironman Taiwan 2017
Median Splits by Age Group at Ironman Taiwan 2015-2016

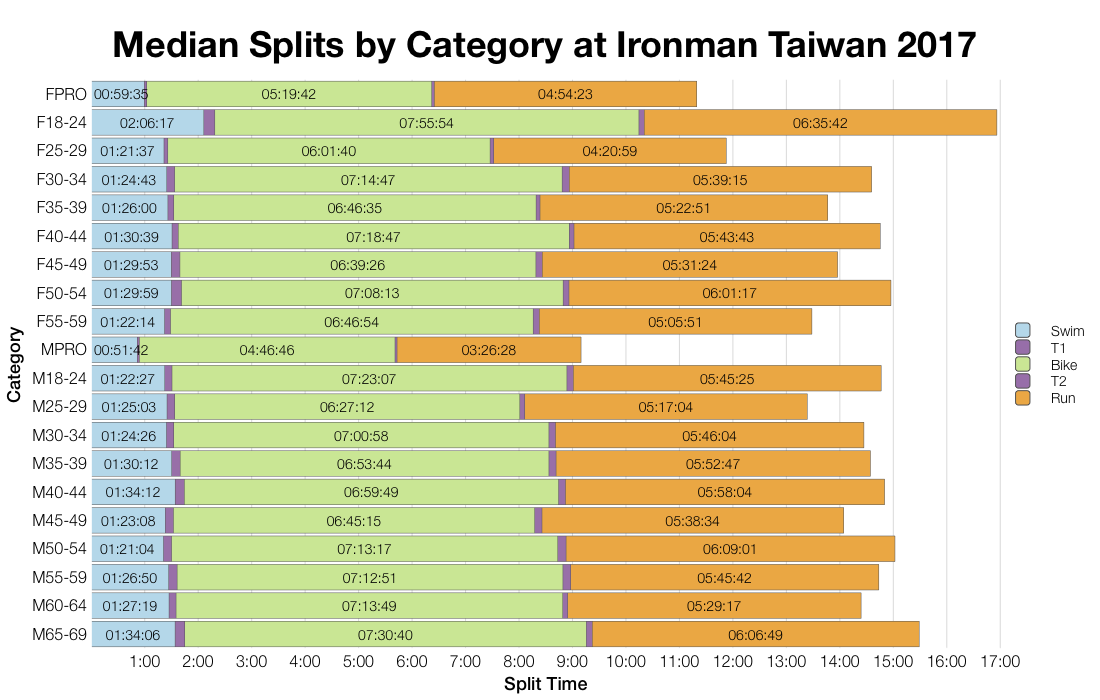
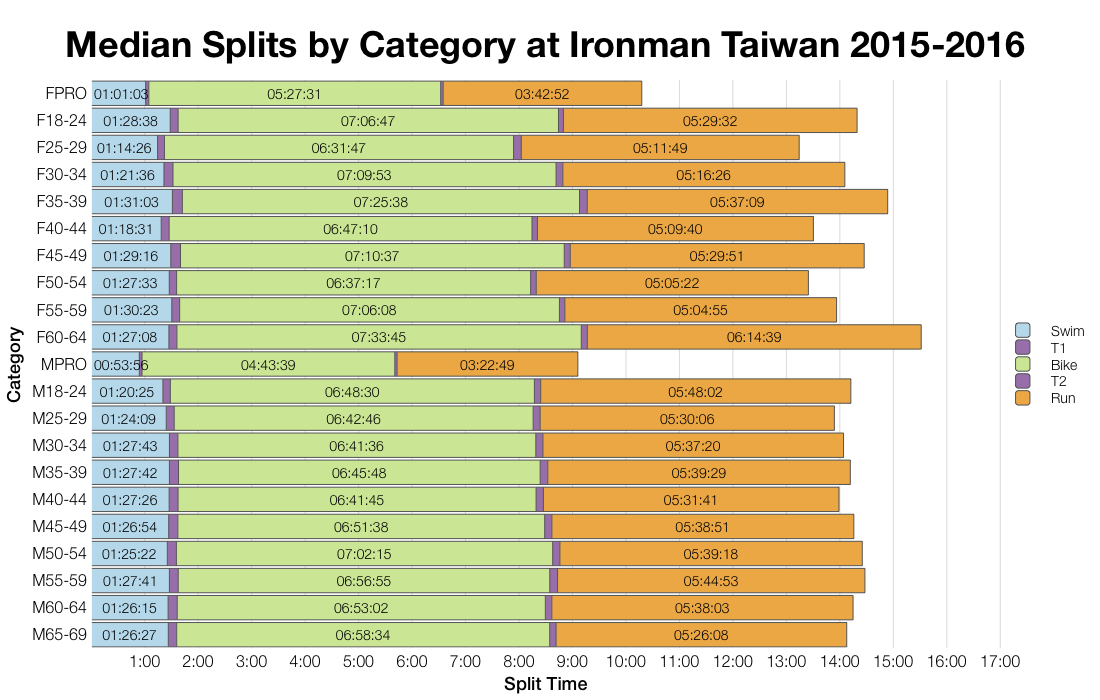
Age group medians are broadly slower this year, but we also see a lot more variation with the smaller age groups The impact of outliers is also amplified in a smaller field, enough to influence the medians a little.

Top 10 Nationalities at Ironman Taiwan
Country
Count
Percentage
Taiwan
141
32.9
Japan
129
30.1
China
46
10.7
Hong Kong
15
3.5
Philippines
13
3
United States
12
2.8
Thailand
9
2.1
United Kingdom
9
2.1
Malaysia
6
1.4
Australia
6
1.4
Ironman Taiwan 2017 Predicted Kona Qualifiers by Country
Country
Percentage of Slots
Percentage of Field
Japan
32.0
30.1
Taiwan
28.0
32.9
Australia
8.0
1.4
China
4.0
10.7
Finland
4.0
0.5
Reunion
4.0
0.2
Germany
4.0
0.9
Spain
4.0
0.5
United Kingdom
4.0
2.1

The race draws a spread of athletes, primarily from the region. Japan and Taiwan take the majority of the slots on offer.

Changes in Male Finishing Times by Position at Ironman Taiwan
Changes in Female Finishing Times by Position at Ironman Taiwan

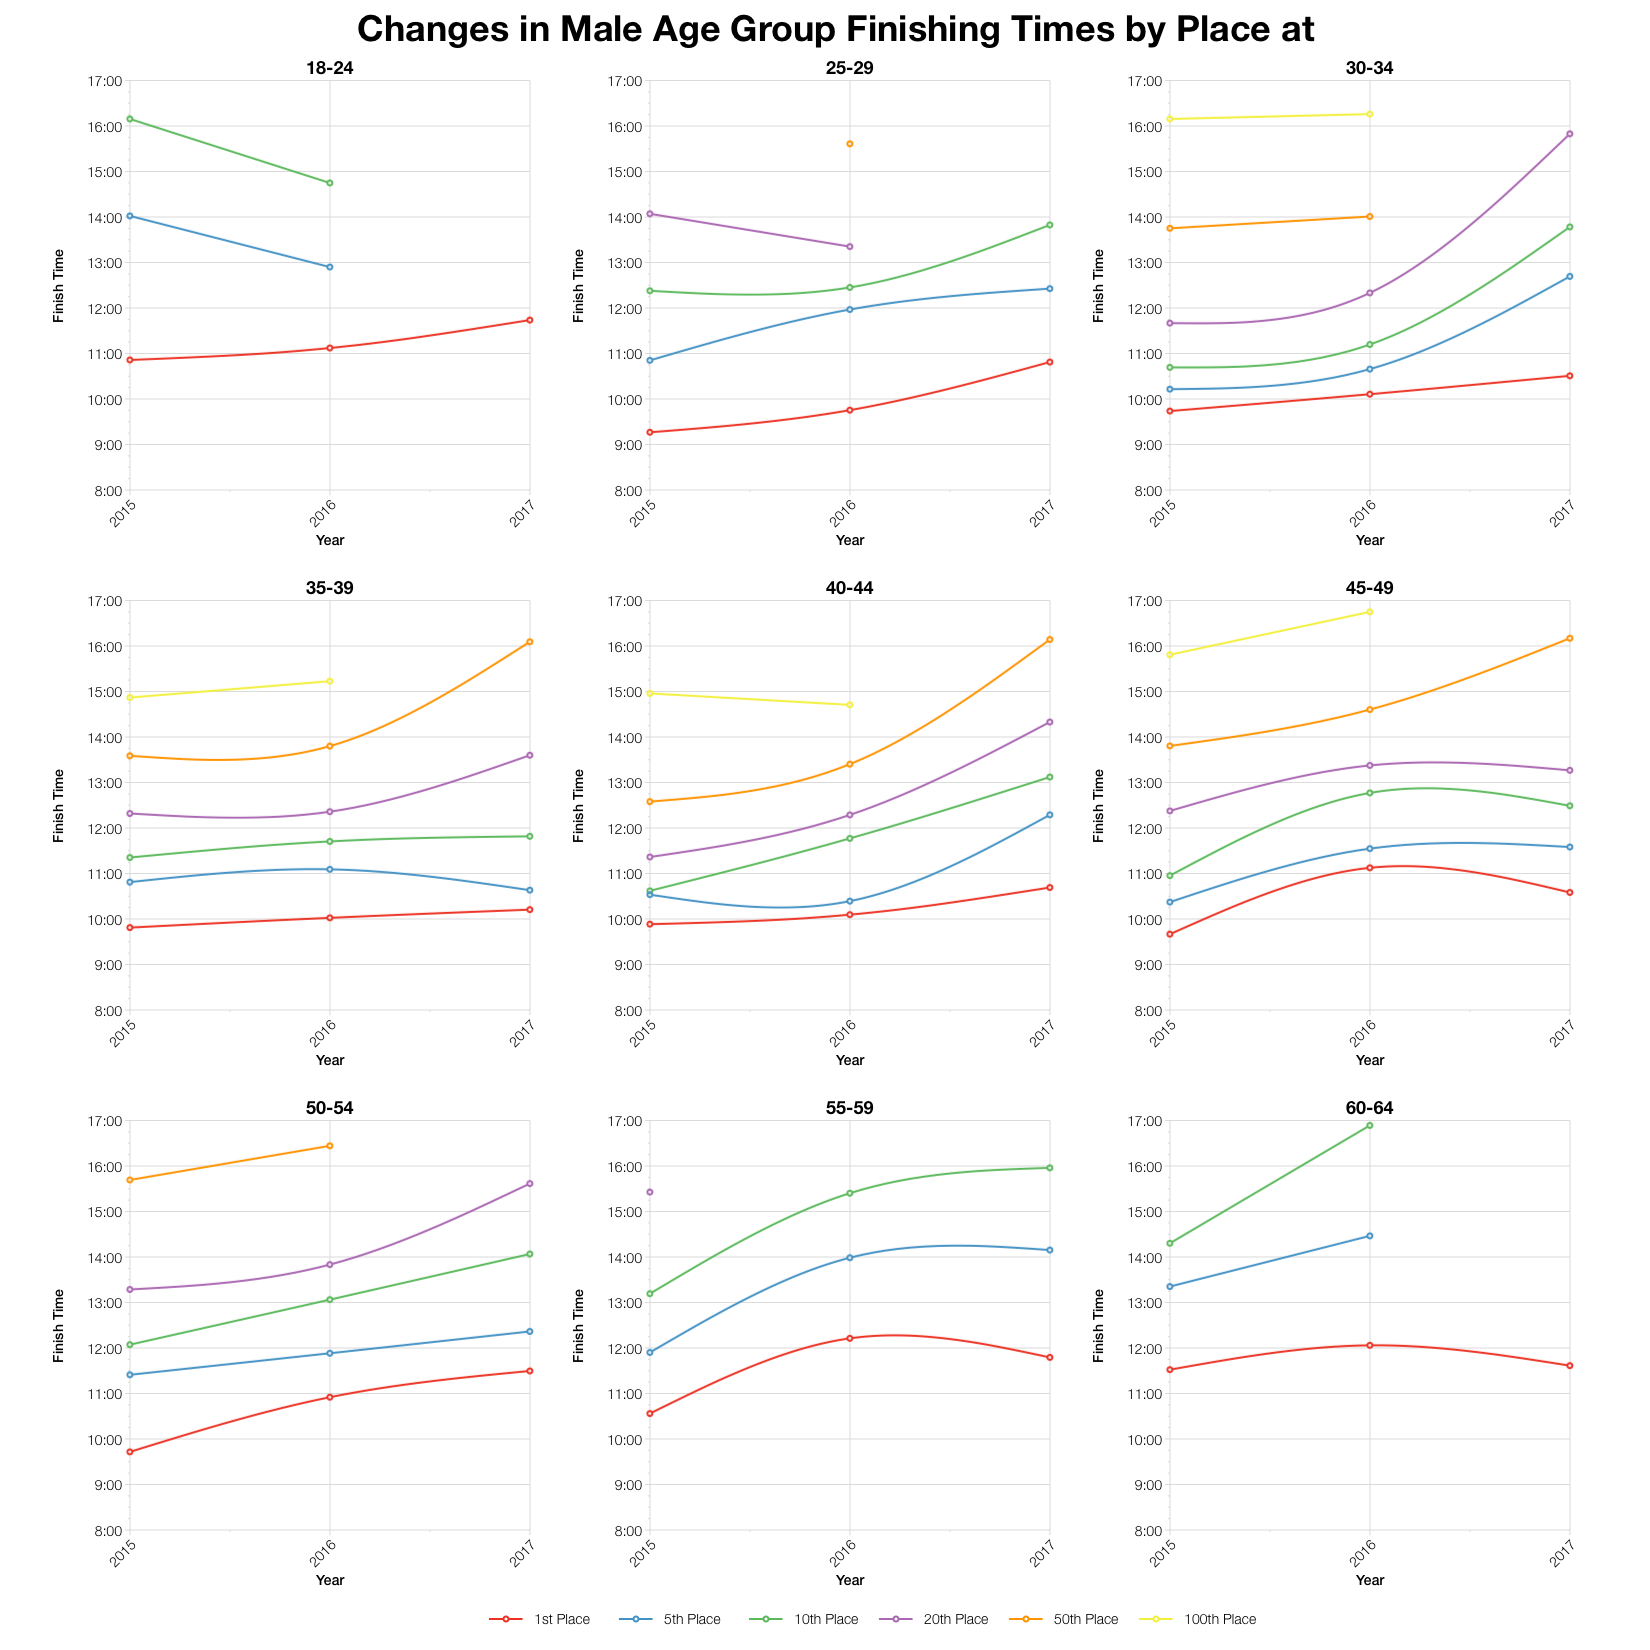
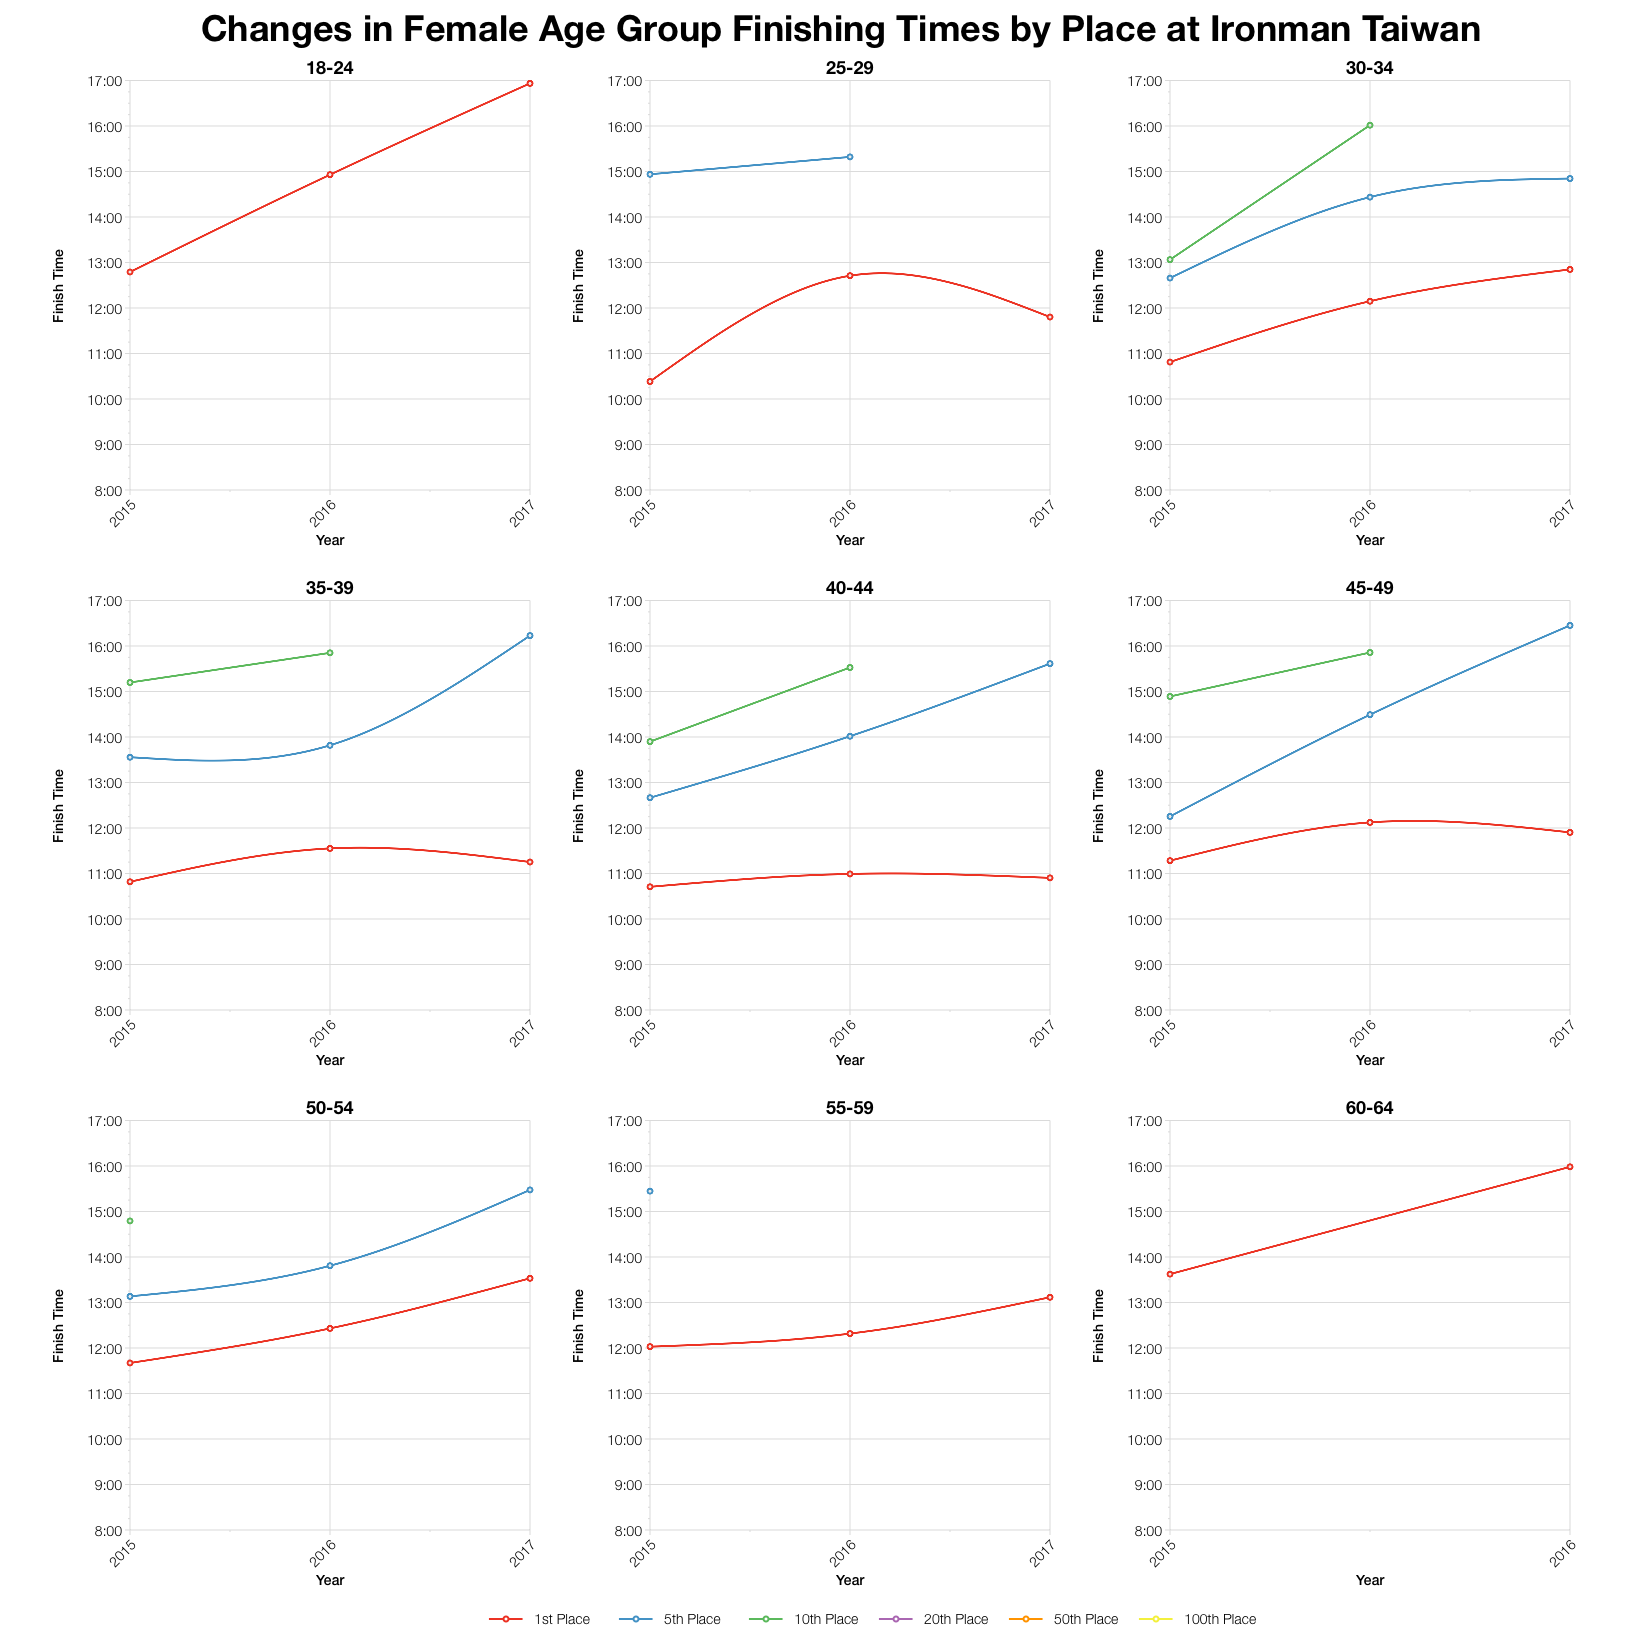
Tracking times for specific age group positions shows the impact of the reduction in numbers. There aren’t as many athletes in many of the age groups and times have dropped off considerably for later positions. As the field shrinks 50th place might move from being middle of the pack to back of pack. The front of the race, those taking the podium, hasn’t slowed as much.

Ironman Taiwan 2017 Predicted Kona Qualification Times
Age Group
Slots
Winner
Average Kona Qualifier
Final Qualifier
M18-24
1
11:44:17
11:44:17
11:44:17
M25-29
1
10:48:55
10:48:55
10:48:55
M30-34
1
10:30:47
10:30:47
10:30:47
M35-39
2
10:12:33
10:12:56
10:13:19
M40-44
2
10:41:43
10:46:48
10:51:54
M45-49
2
10:35:13
10:47:00
10:58:48
M50-54
1
11:29:55
11:29:55
11:29:55
M55-59
1
11:47:49
11:47:49
11:47:49
M60-64
1
11:36:56
11:36:56
11:36:56
M65-69
1
13:31:58
13:31:58
13:31:58
M70-74
1
13:54:07
13:54:07
13:54:07
M75-79
1
16:14:10
16:14:10
16:14:10
F18-24
1
16:56:13
16:56:13
16:56:13
F25-29
1
11:48:06
11:48:06
11:48:06
F30-34
1
12:50:53
12:50:53
12:50:53
F35-39
1
11:15:09
11:15:09
11:15:09
F40-44
1
10:54:13
10:54:13
10:54:13
F45-49
1
11:54:12
11:54:12
11:54:12
F50-54
1
13:31:58
13:31:58
13:31:58
F55-59
1
13:06:57
13:06:57
13:06:57

Based on the results list I’ve estimated the slot allocation at Ironman Taiwan and from that the likely automatic qualification times for the race. The final allocation may vary and roll down would also influence these times. You can review more qualifying times on my Kona qualification page.

Top Twenty Male Performances and Kona Qualification by Age Group at Ironman Taiwan 2017
Top Twenty Female Performances and Kona Qualification by Age Group at Ironman Taiwan 2017

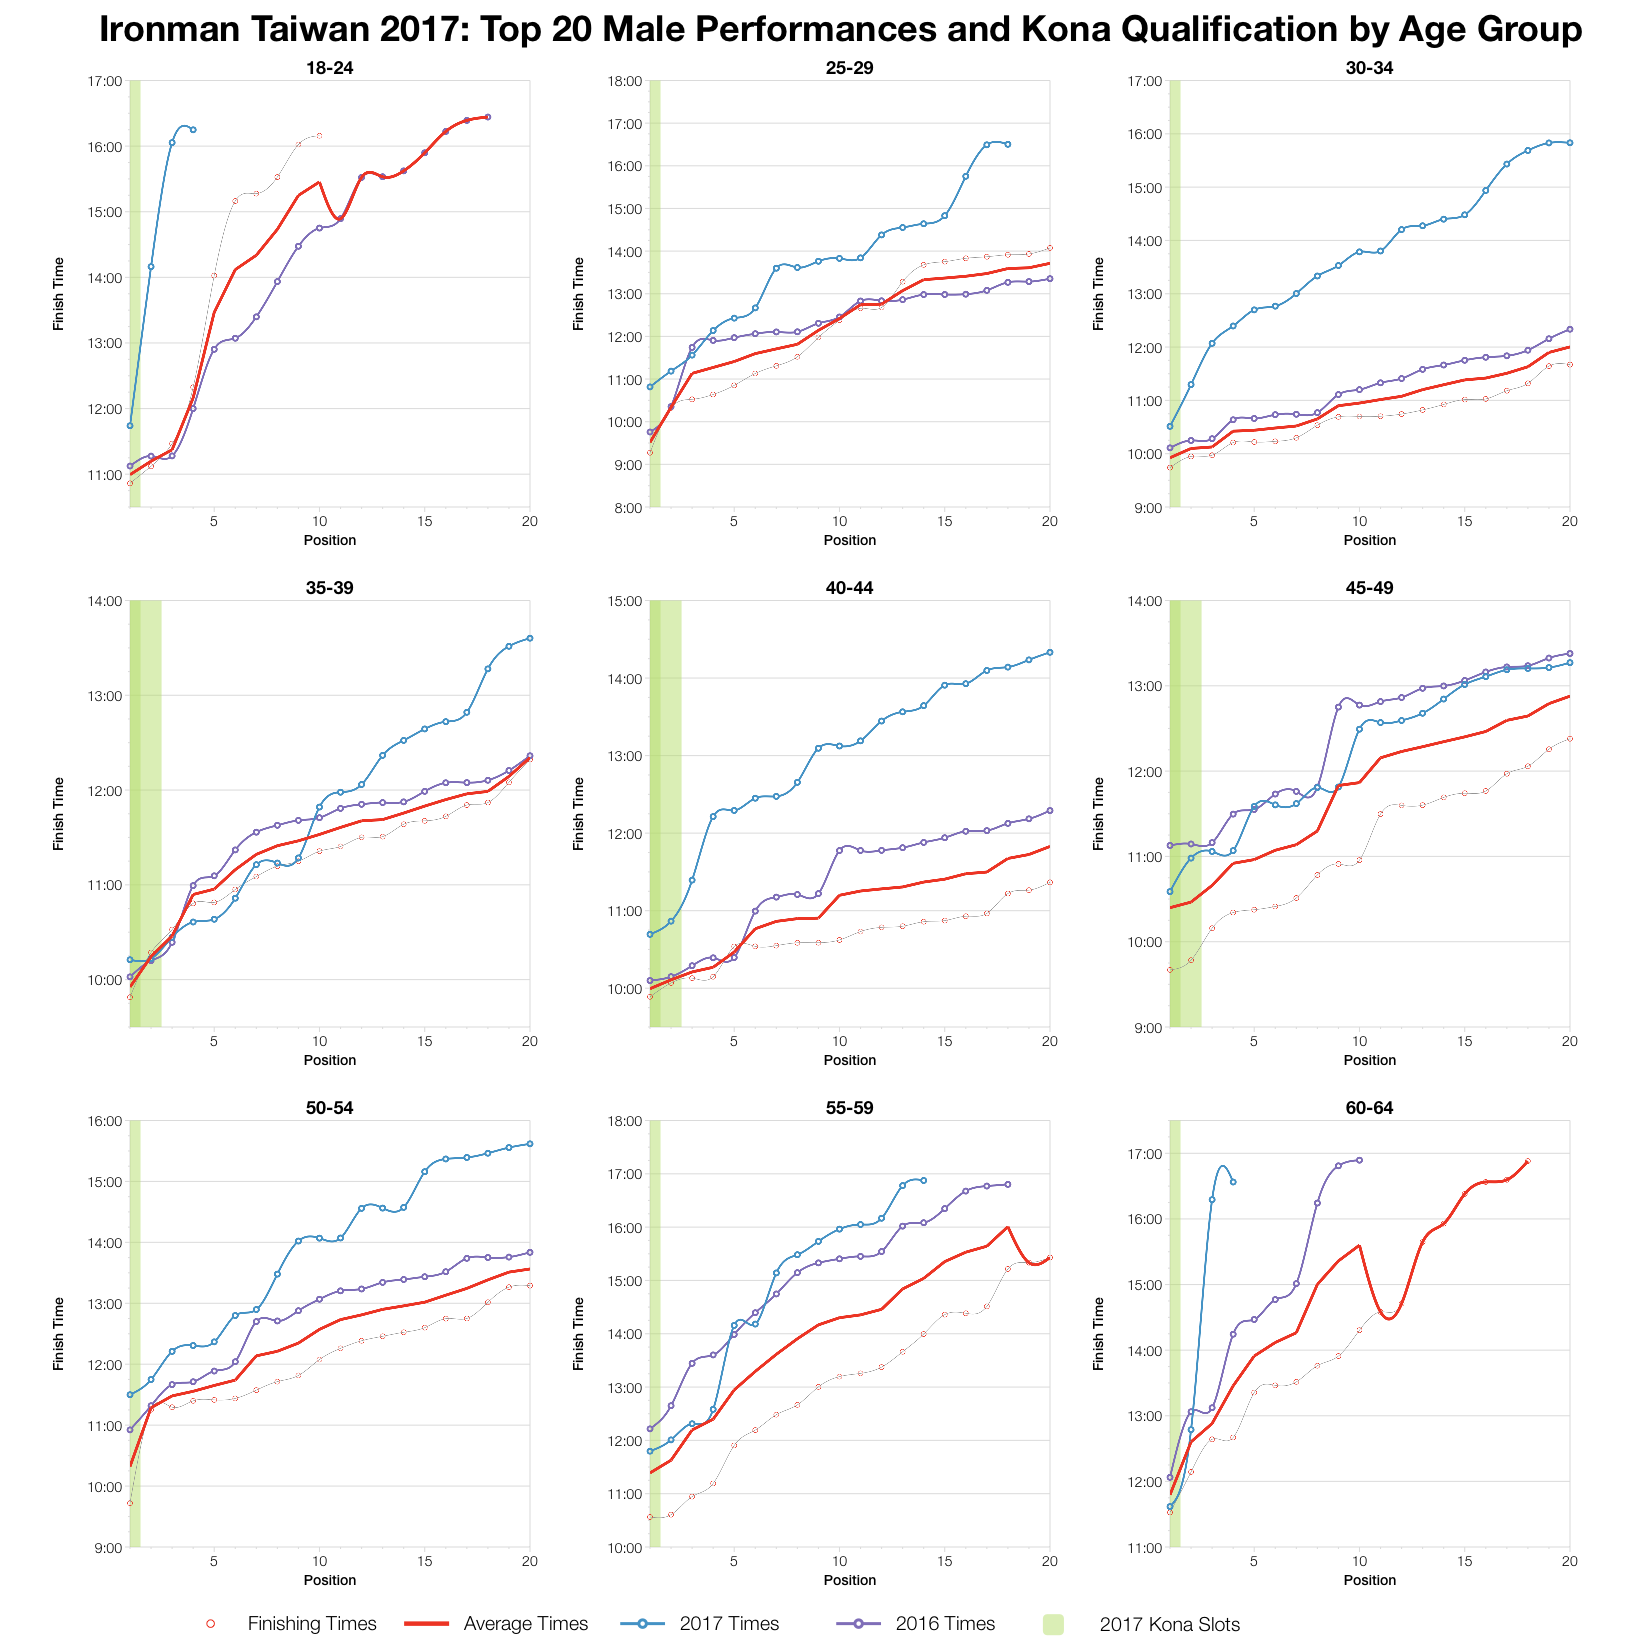
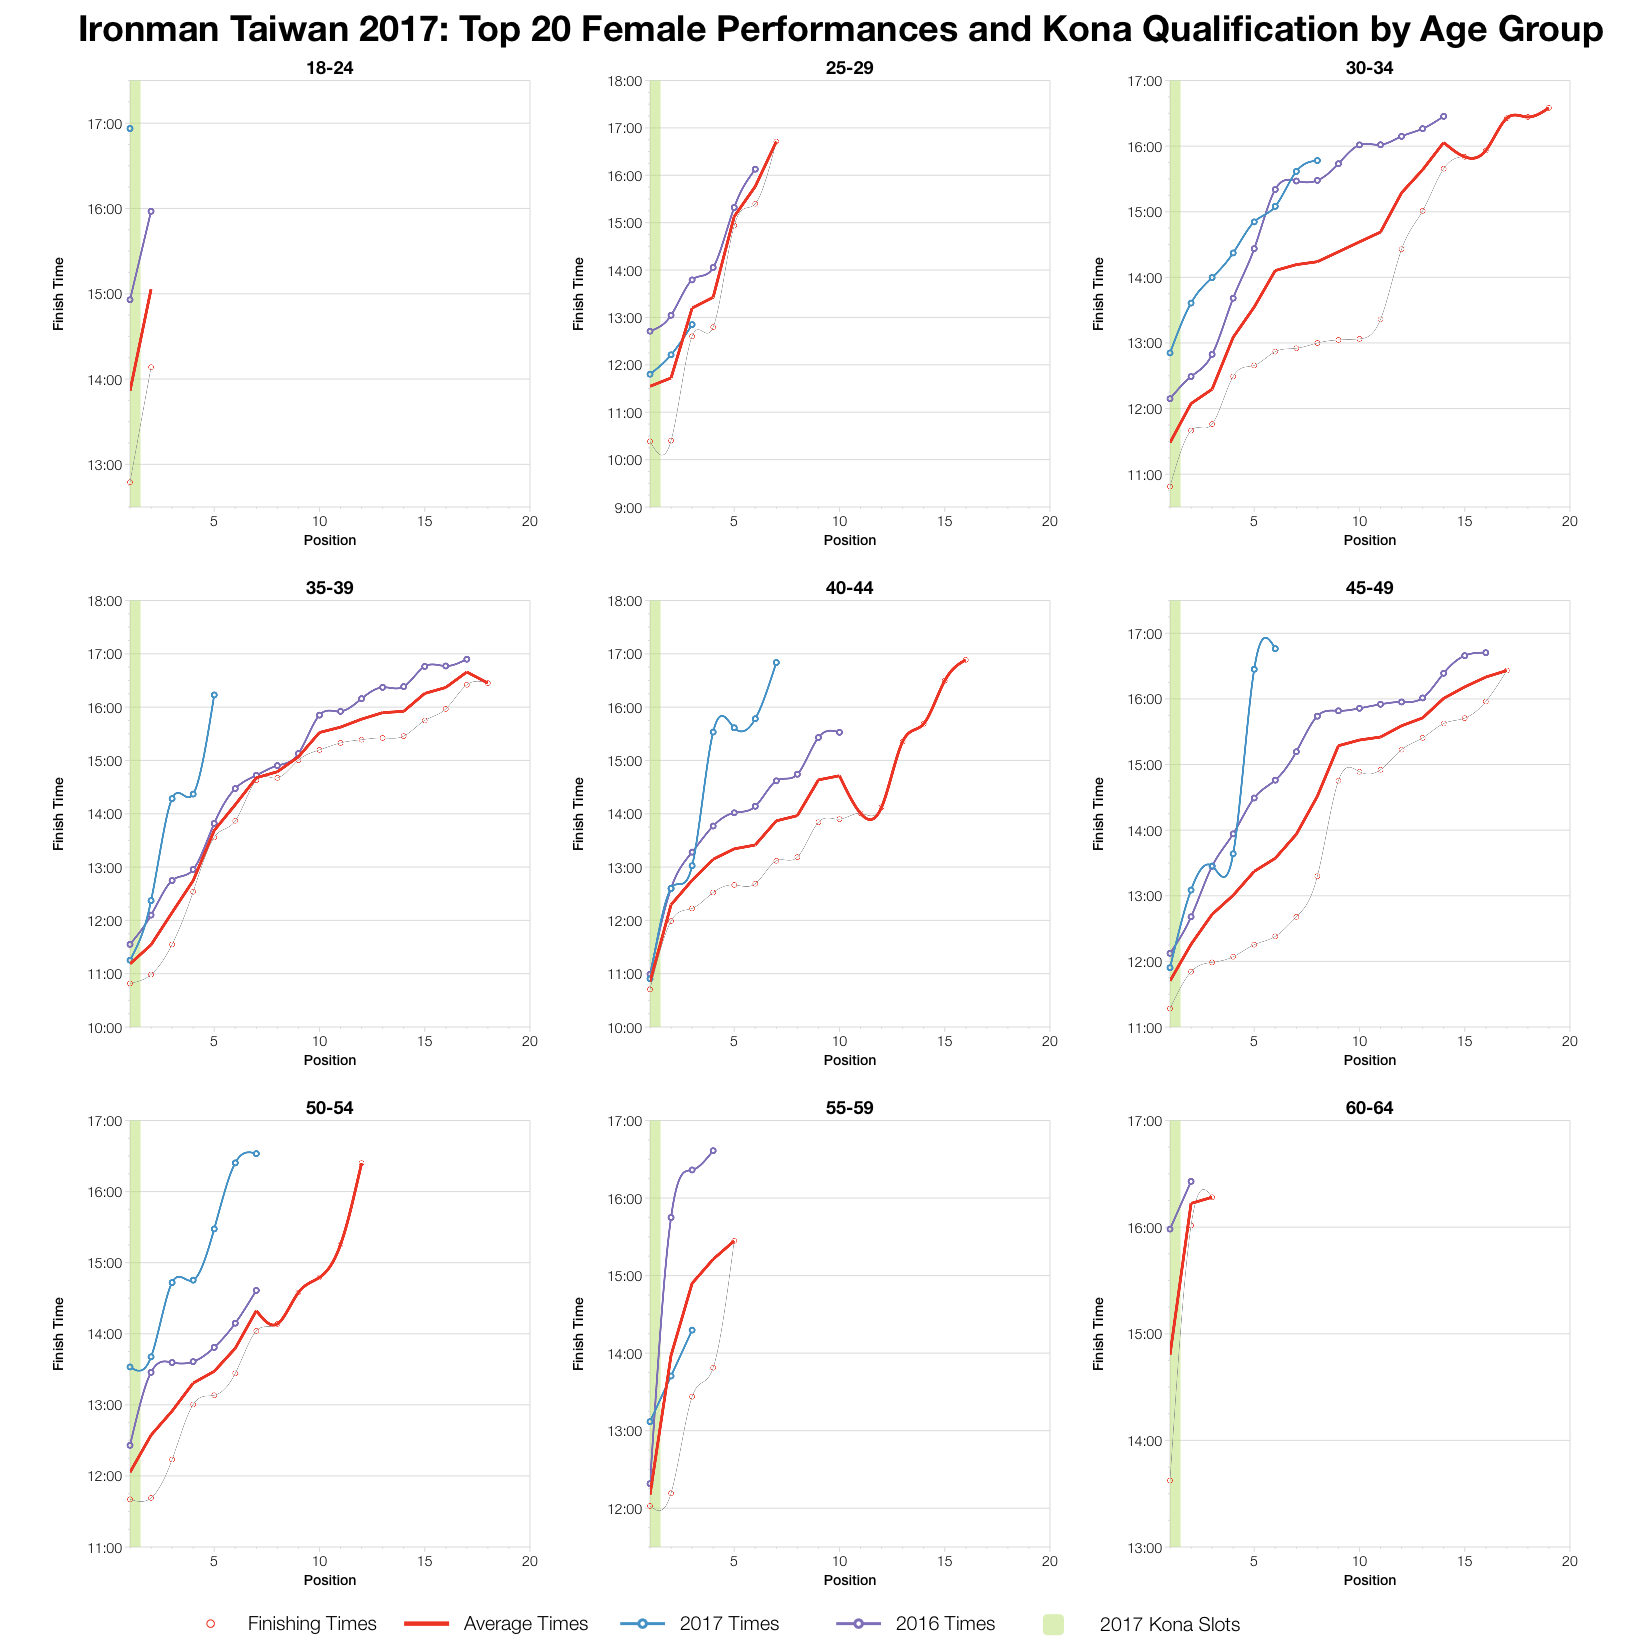
Finally, the top twenty in each age groups. Again, we see the variance from small groups of athletes. For the most part times are slower than average and often slower than last year’s race. This is less often the case at the very front of the race – there’s not so much change for first place. Overall though, this year’s race came out slower than before, perhaps a result of a thinning of the field.

You can access a spreadsheet of the full results from Ironman Taiwan 2017 on my Google Drive.

Latest statistics for Ironman Taiwan

Kona Qualification

Compare qualification times across the Ironman Calendar.

Kona Consultancy

Individual race analysis and guidance for Kona qualification.

Support the Stats

Support the continued development of these stats.

Comments