Ironman Louisville 2017: Age Group Results and Kona Qualification

Latest statistics for Ironman Louisville

Although somewhat overshadowed by the World Champs in Kona, Ironman Louisville also took place over the weekend. It’s a standard US Ironman with a field size over 2,000 and 40 Kona slots on offer, but the guarantee you won’t be competing with any current Kona participants. Not that this necessarily makes qualification any easier, given everyone knows recent qualifiers won’t be there.

Distribution of Finisher Splits at Ironman Louisville 2017 Compared with 2007-2016

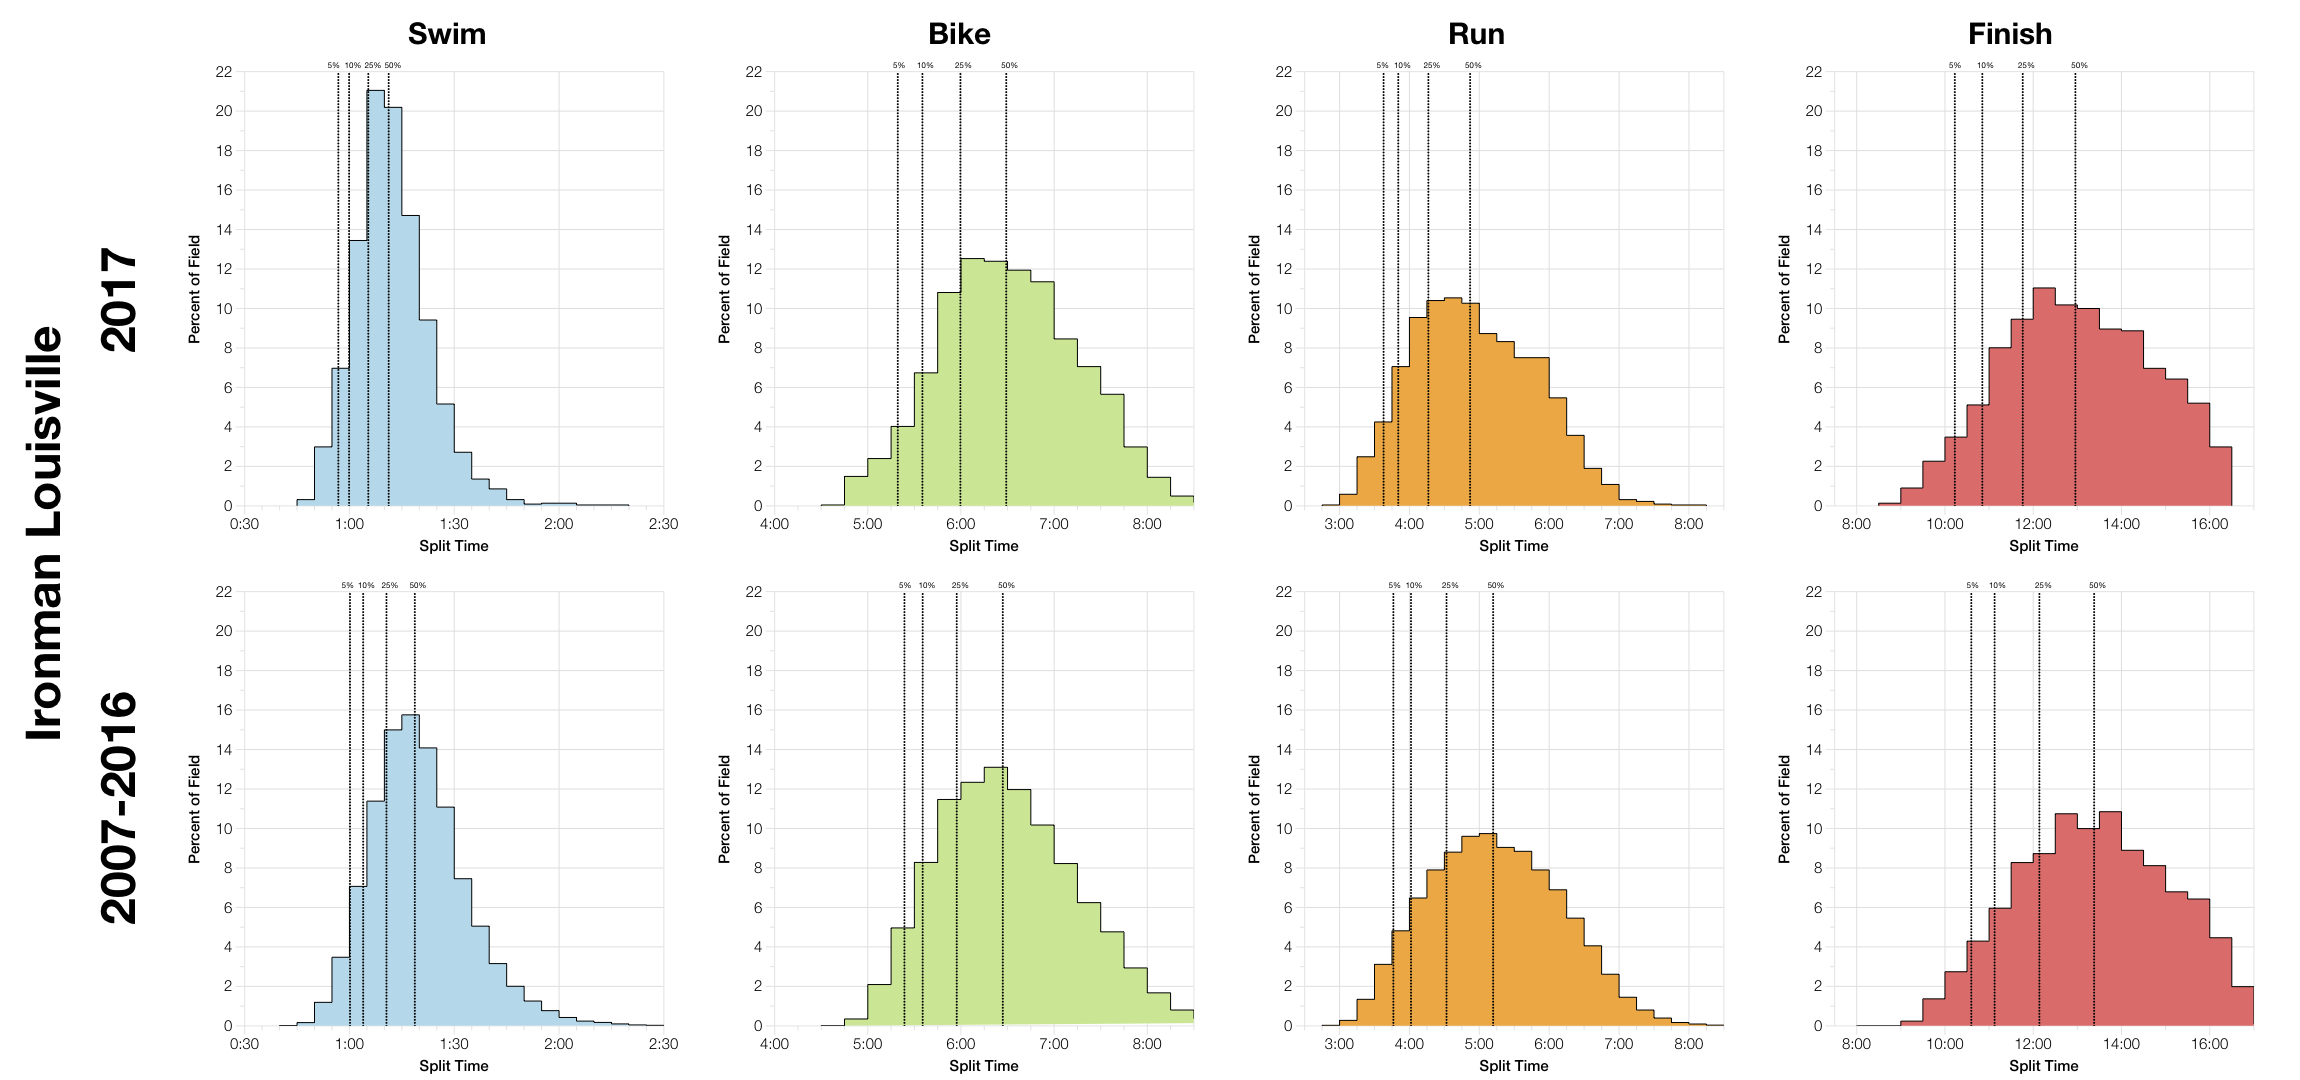
This year’s race trends faster than the previous decade of results. This seems to mostly come from a faster run distribution and also a much faster swim distribution. This year’s swim looks to have been unusually fast for the course with the median swim time around 10 minutes faster. Combine that with a run median 15-20 minutes faster and it’s quite a large shift to the overall results.

DNS and DNF Rates at Ironman Louisville
Year
Listed Athletes
Swim Finish
Swim DNS/DNF
Bike Finish
Bike DNF
Run Finish
Run DNF
Overall DNS/DNF
2007
2137
1695
20.7%
1662
1.9%
1562
6%
26.8%
2008
2452
1978
19.3%
1908
3.5%
1792
6.1%
26.9%
2009
2929
2402
18%
2399
0.1%
2351
2%
19.7%
2010
2994
2507
16.3%
2395
4.5%
2155
10%
28%
2011
2865
2437
14.9%
2386
2.1%
2276
4.6%
20.6%
2012
3014
2580
14.4%
2499
3.1%
2229
10.8%
26%
2013
2600
2547
2%
2507
1.6%
2347
6.4%
9.7%
2014
2387
2071
13.2%
2005
3.2%
1867
6.9%
21.7%
2015
2573
2534
1.5%
2470
2.5%
2365
4.3%
8.1%
2016
2652
2618
1.3%
2577
1.6%
2428
5.8%
8.4%
2017
2414
2397
0.7%
2336
2.5%
2272
2.7%
6.7%

Probably the most notable change in the DNF numbers for this year’s race is the much lower run DNF rate. As well as faster splits we also have a higher completion rate suggesting course and conditions were better than usual for this race. Bike DNF looks to be average for the course and swim numbers (which exclude DNS for this year) are probably typical too.

Median Splits by Age Group at Ironman Louisville 2017
Median Splits by Age Group at Ironman Louisville 2007-2016

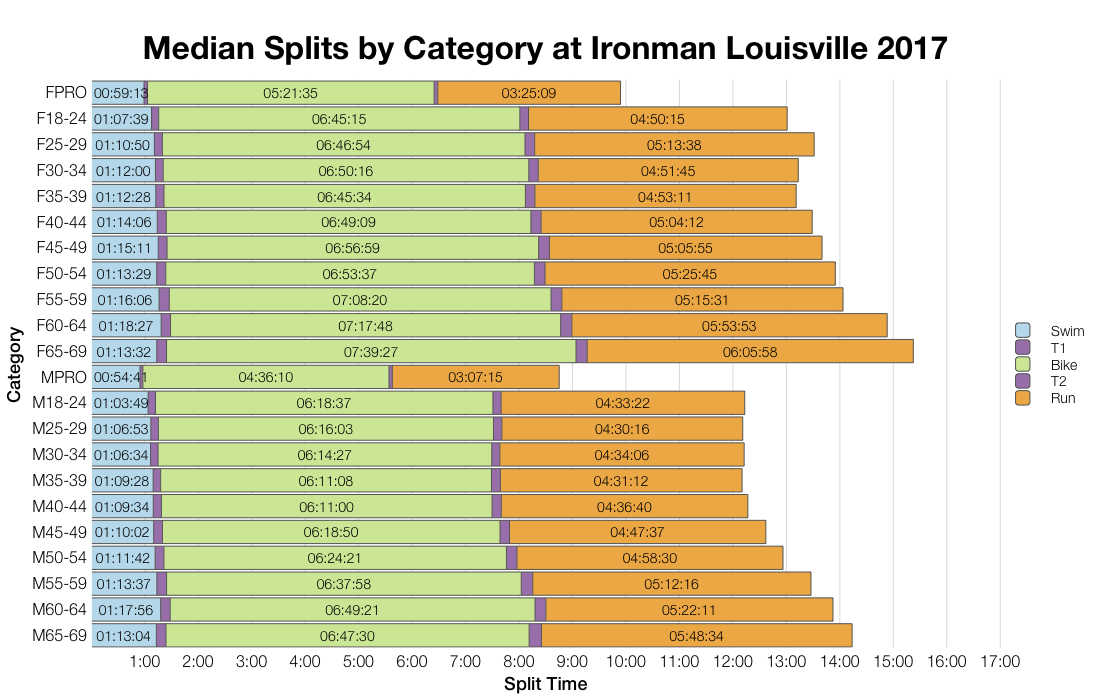
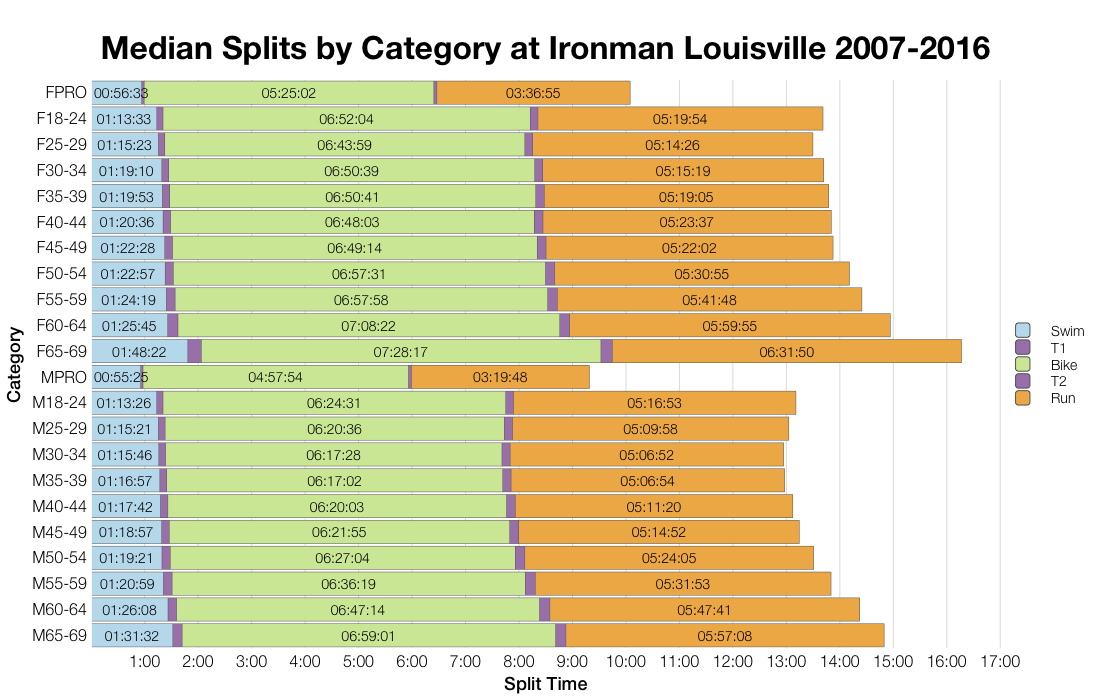
As is usually the case, the age group medians follow the patterns in the distribution. So we see faster swims, similar bikes and much faster runs across pretty much every age group.

Top 10 Nationalities at Ironman Louisville
Country
Count
Percentage
United States
2487
90.4
Canada
97
3.5
United Kingdom
23
0.8
Costa Rica
18
0.7
Germany
16
0.6
Mexico
13
0.5
Ireland
7
0.3
Australia
6
0.2
Japan
6
0.2
Brazil
6
0.2
Ironman Louisville 2017 Predicted Kona Qualifiers by Country
Country
Percentage of Slots
Percentage of Field
United States
77.5
90.4
Germany
7.5
0.6
Canada
5.0
3.5
Switzerland
2.5
0.1
Belgium
2.5
0.2
United Kingdom
2.5
0.8

A majority US field as we’d expect, perhaps more so as it falls on the same weekend as Kona. A few slots still go to other nationalities, with Germany pinching above its weight again.

Changes in Male Finishing Times by Position at Ironman Louisville
Changes in Female Finishing Times by Position at Ironman Louisville

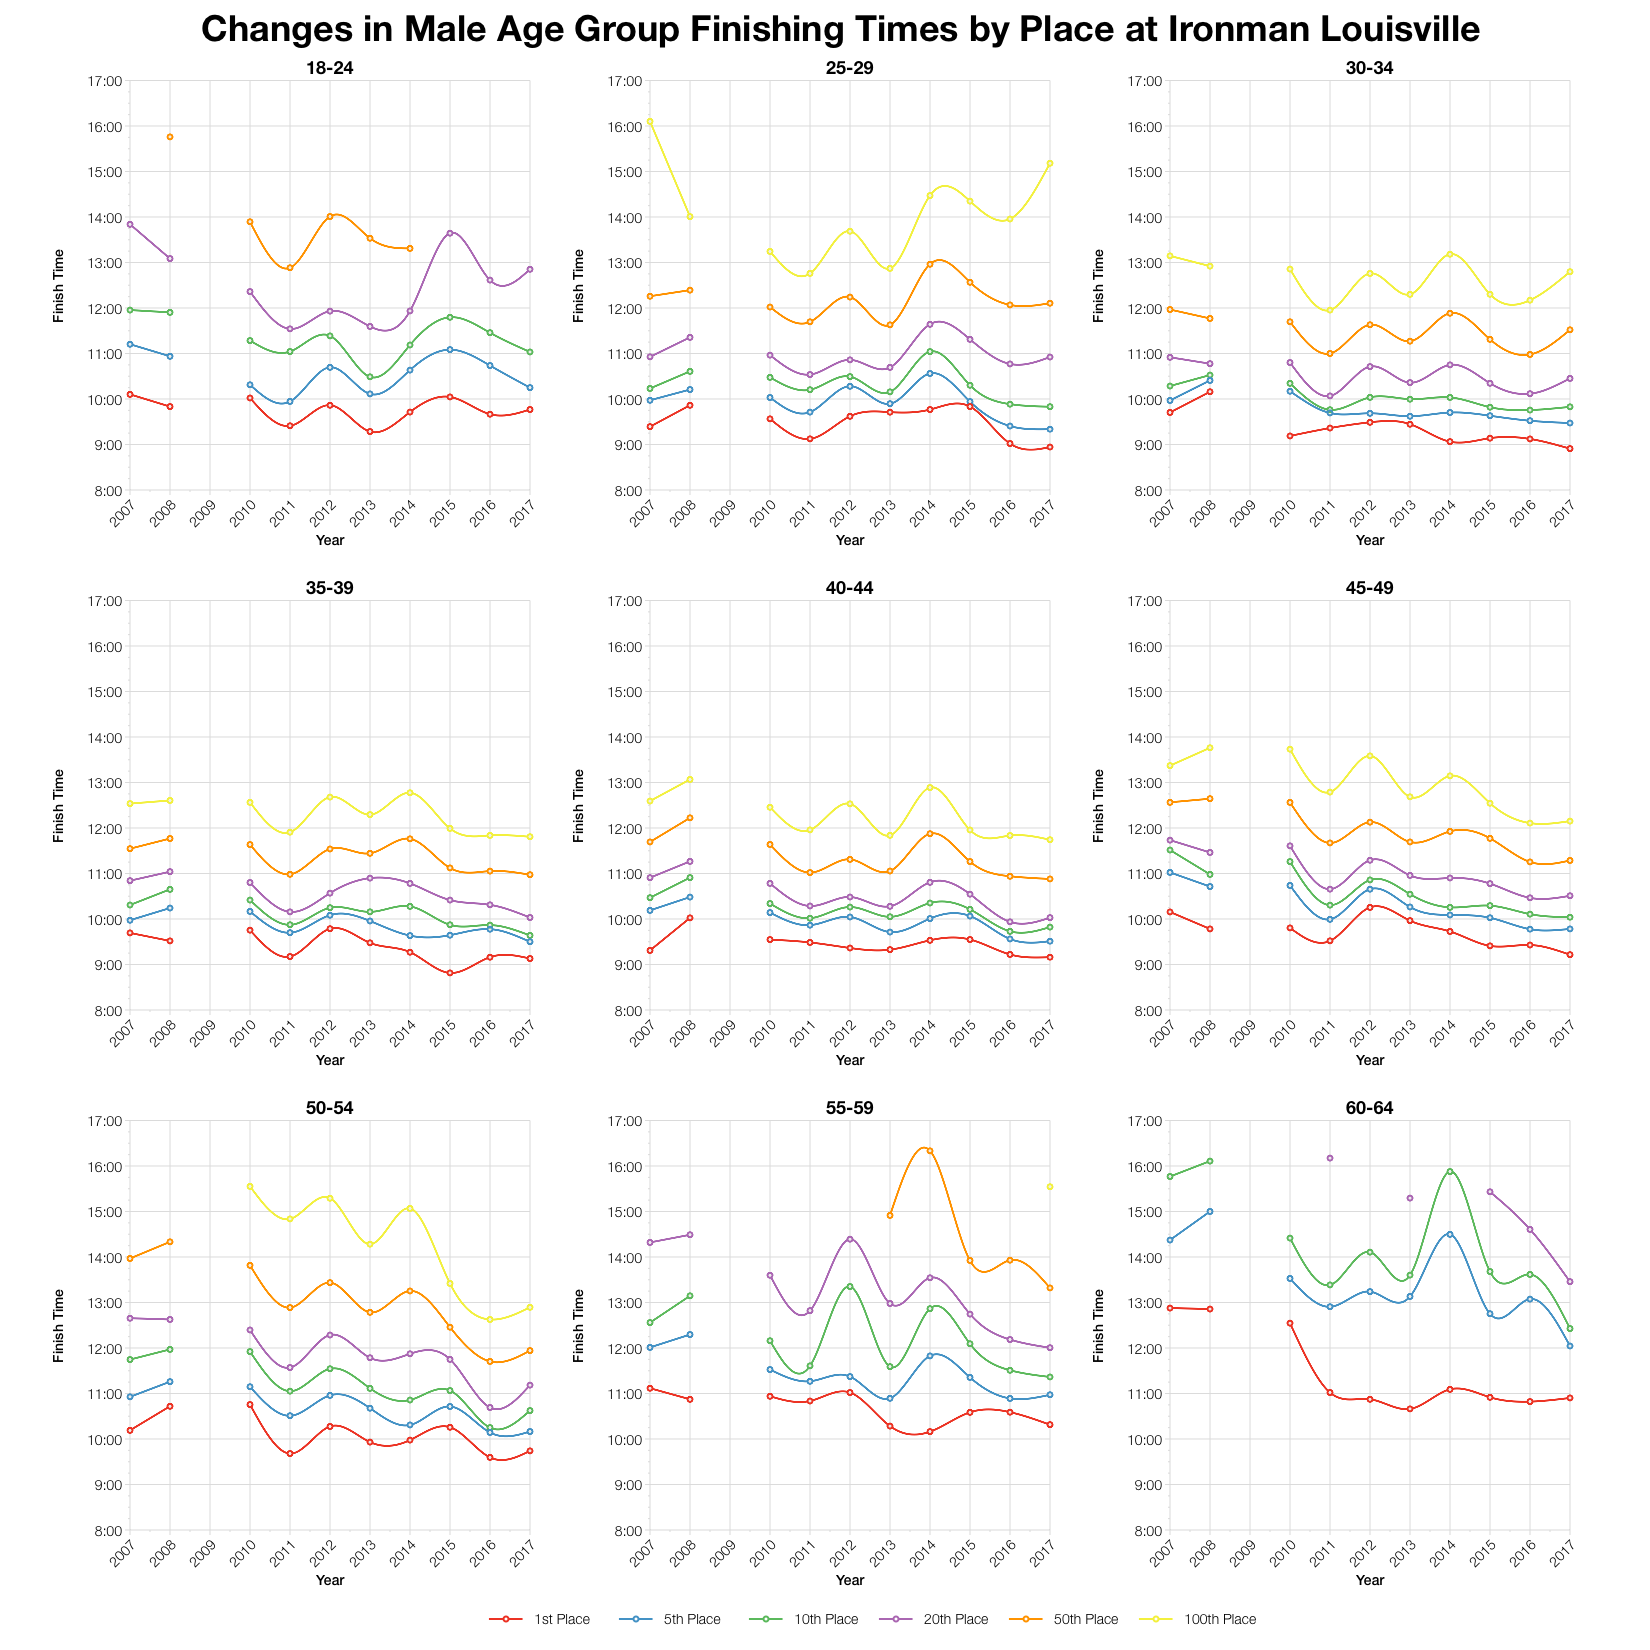
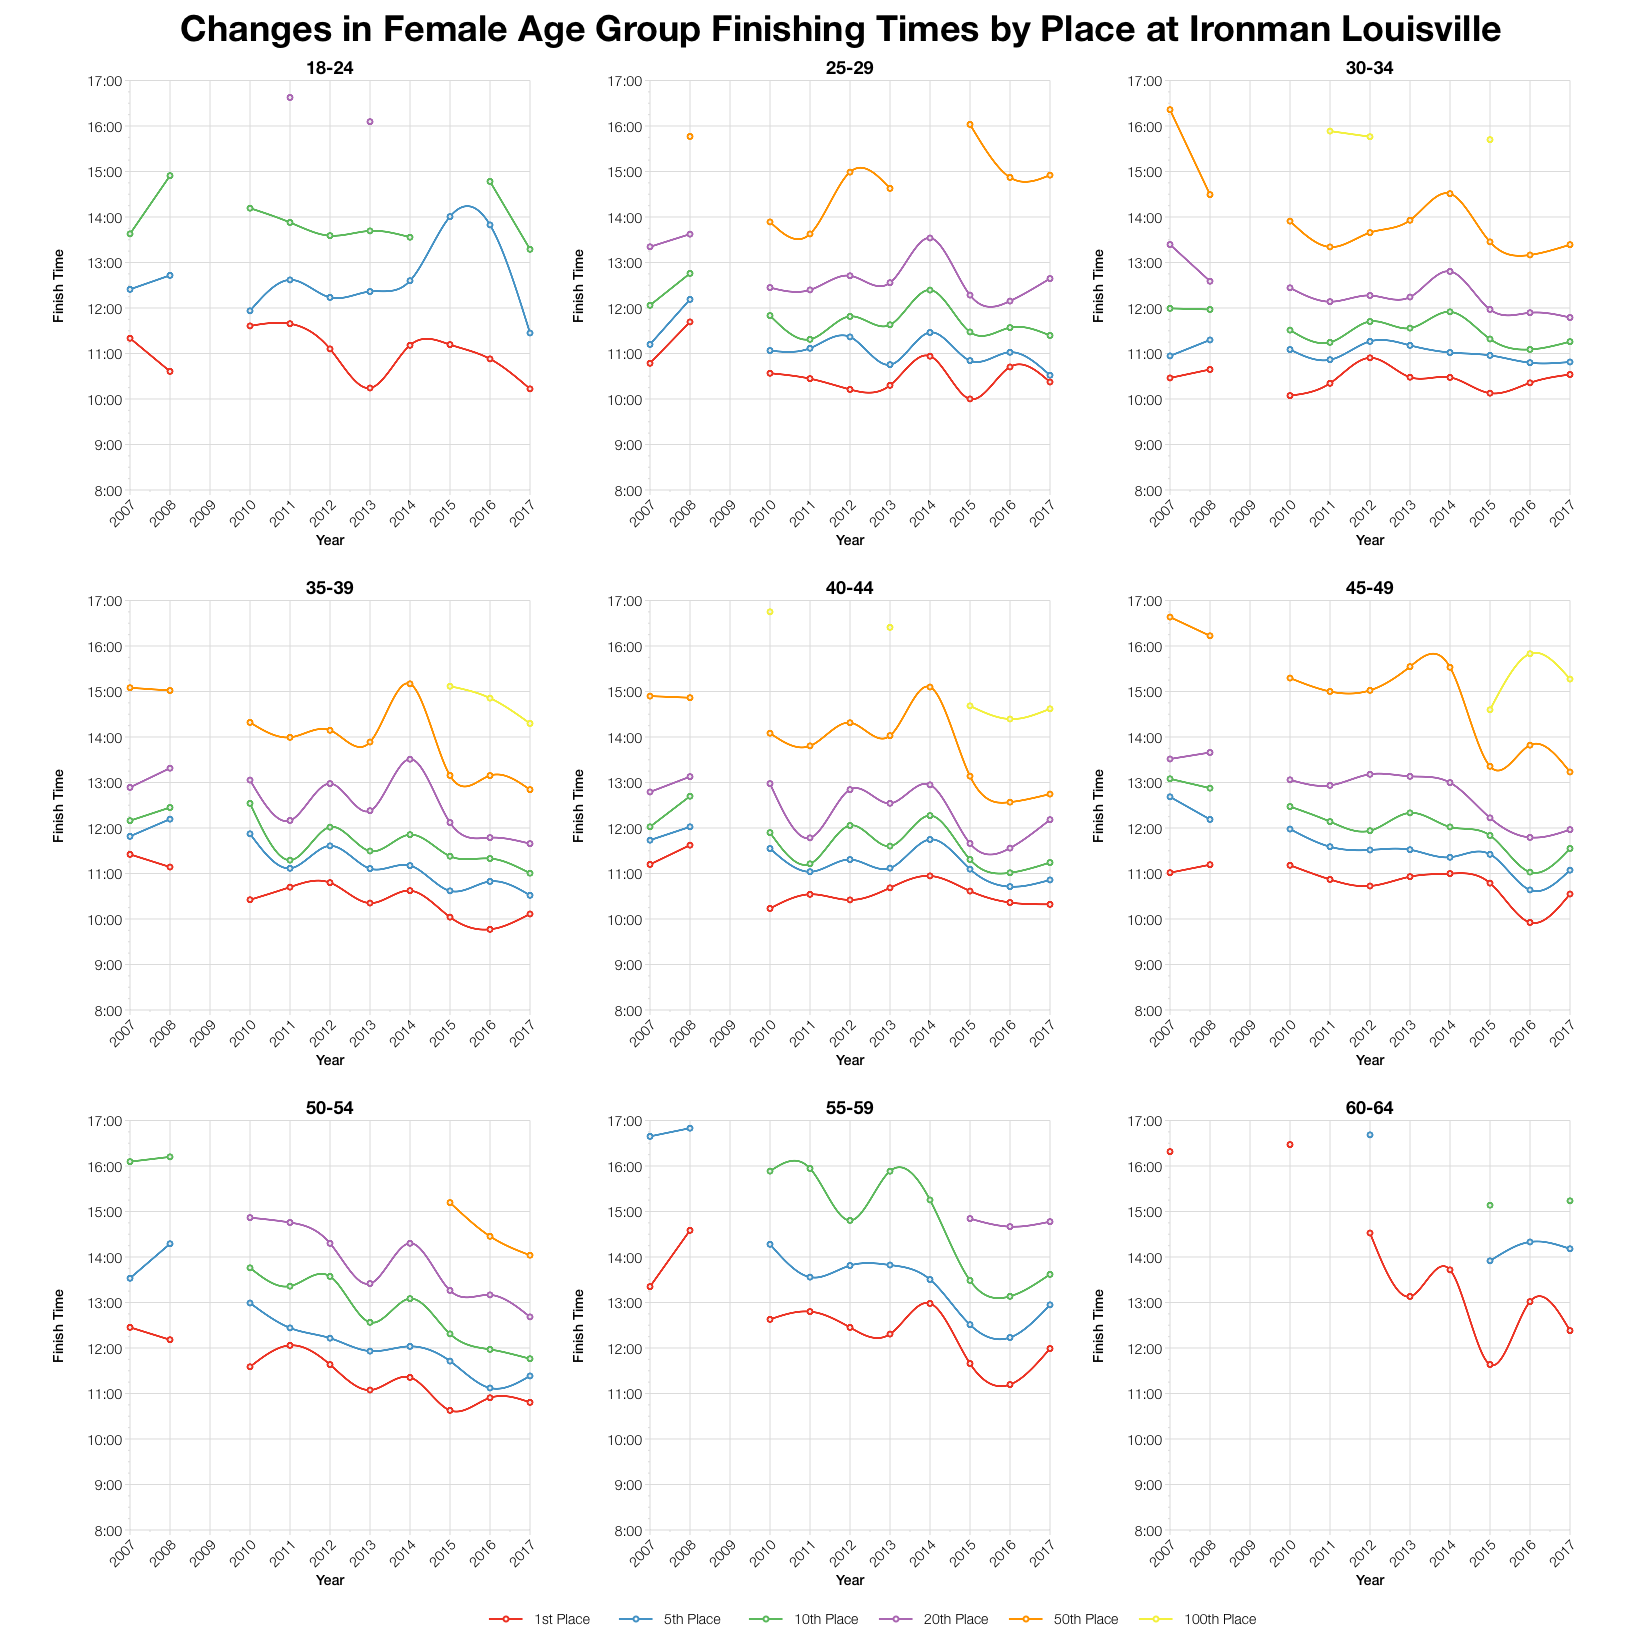
Results for this race look to have held pretty consistent, perhaps getting faster in some of the bigger age groups over the last 8-10 years. The last couple of years in particular have been among the quickest for those at the from of the race.

Ironman Louisville 2017 Predicted Kona Qualification Times
Age Group
Slots
Winner
Average Kona Qualifier
Final Qualifier
M18-24
1
09:46:08
09:46:08
09:46:08
M25-29
2
08:56:39
08:58:55
09:01:12
M30-34
2
08:54:32
08:55:05
08:55:39
M35-39
3
09:07:51
09:18:08
09:23:39
M40-44
3
09:09:38
09:13:29
09:20:00
M45-49
3
09:12:54
09:25:19
09:34:10
M50-54
3
09:44:19
09:51:21
10:01:45
M55-59
2
10:18:52
10:20:59
10:23:06
M60-64
1
10:54:09
10:54:09
10:54:09
M65-69
1
11:01:51
11:01:51
11:01:51
M70-74
1
14:11:45
14:11:45
14:11:45
F18-24
1
10:13:20
10:13:20
10:13:20
F25-29
2
10:22:24
10:25:25
10:28:27
F30-34
2
10:32:18
10:32:26
10:32:34
F35-39
2
10:06:37
10:14:07
10:21:37
F40-44
2
10:19:21
10:20:39
10:21:58
F45-49
2
10:32:57
10:33:05
10:33:14
F50-54
2
10:48:19
11:01:11
11:14:03
F55-59
1
11:59:16
11:59:16
11:59:16
F60-64
1
12:22:54
12:22:54
12:22:54
F65-69
1
13:25:00
13:25:00
13:25:00
F70-74
1
15:26:51
15:26:51
15:26:51

Based on the participant numbers I’ve estimated the slot allocation and from that the automatic qualification times. Final qualifying times may vary and will depend on roll down. You can compare the results with other races on my Kona qualification page.

Top Twenty Male Performances and Kona Qualification by Age Group at Ironman Louisville 2017
Top Twenty Female Performances and Kona Qualification by Age Group at Ironman Louisville 2017

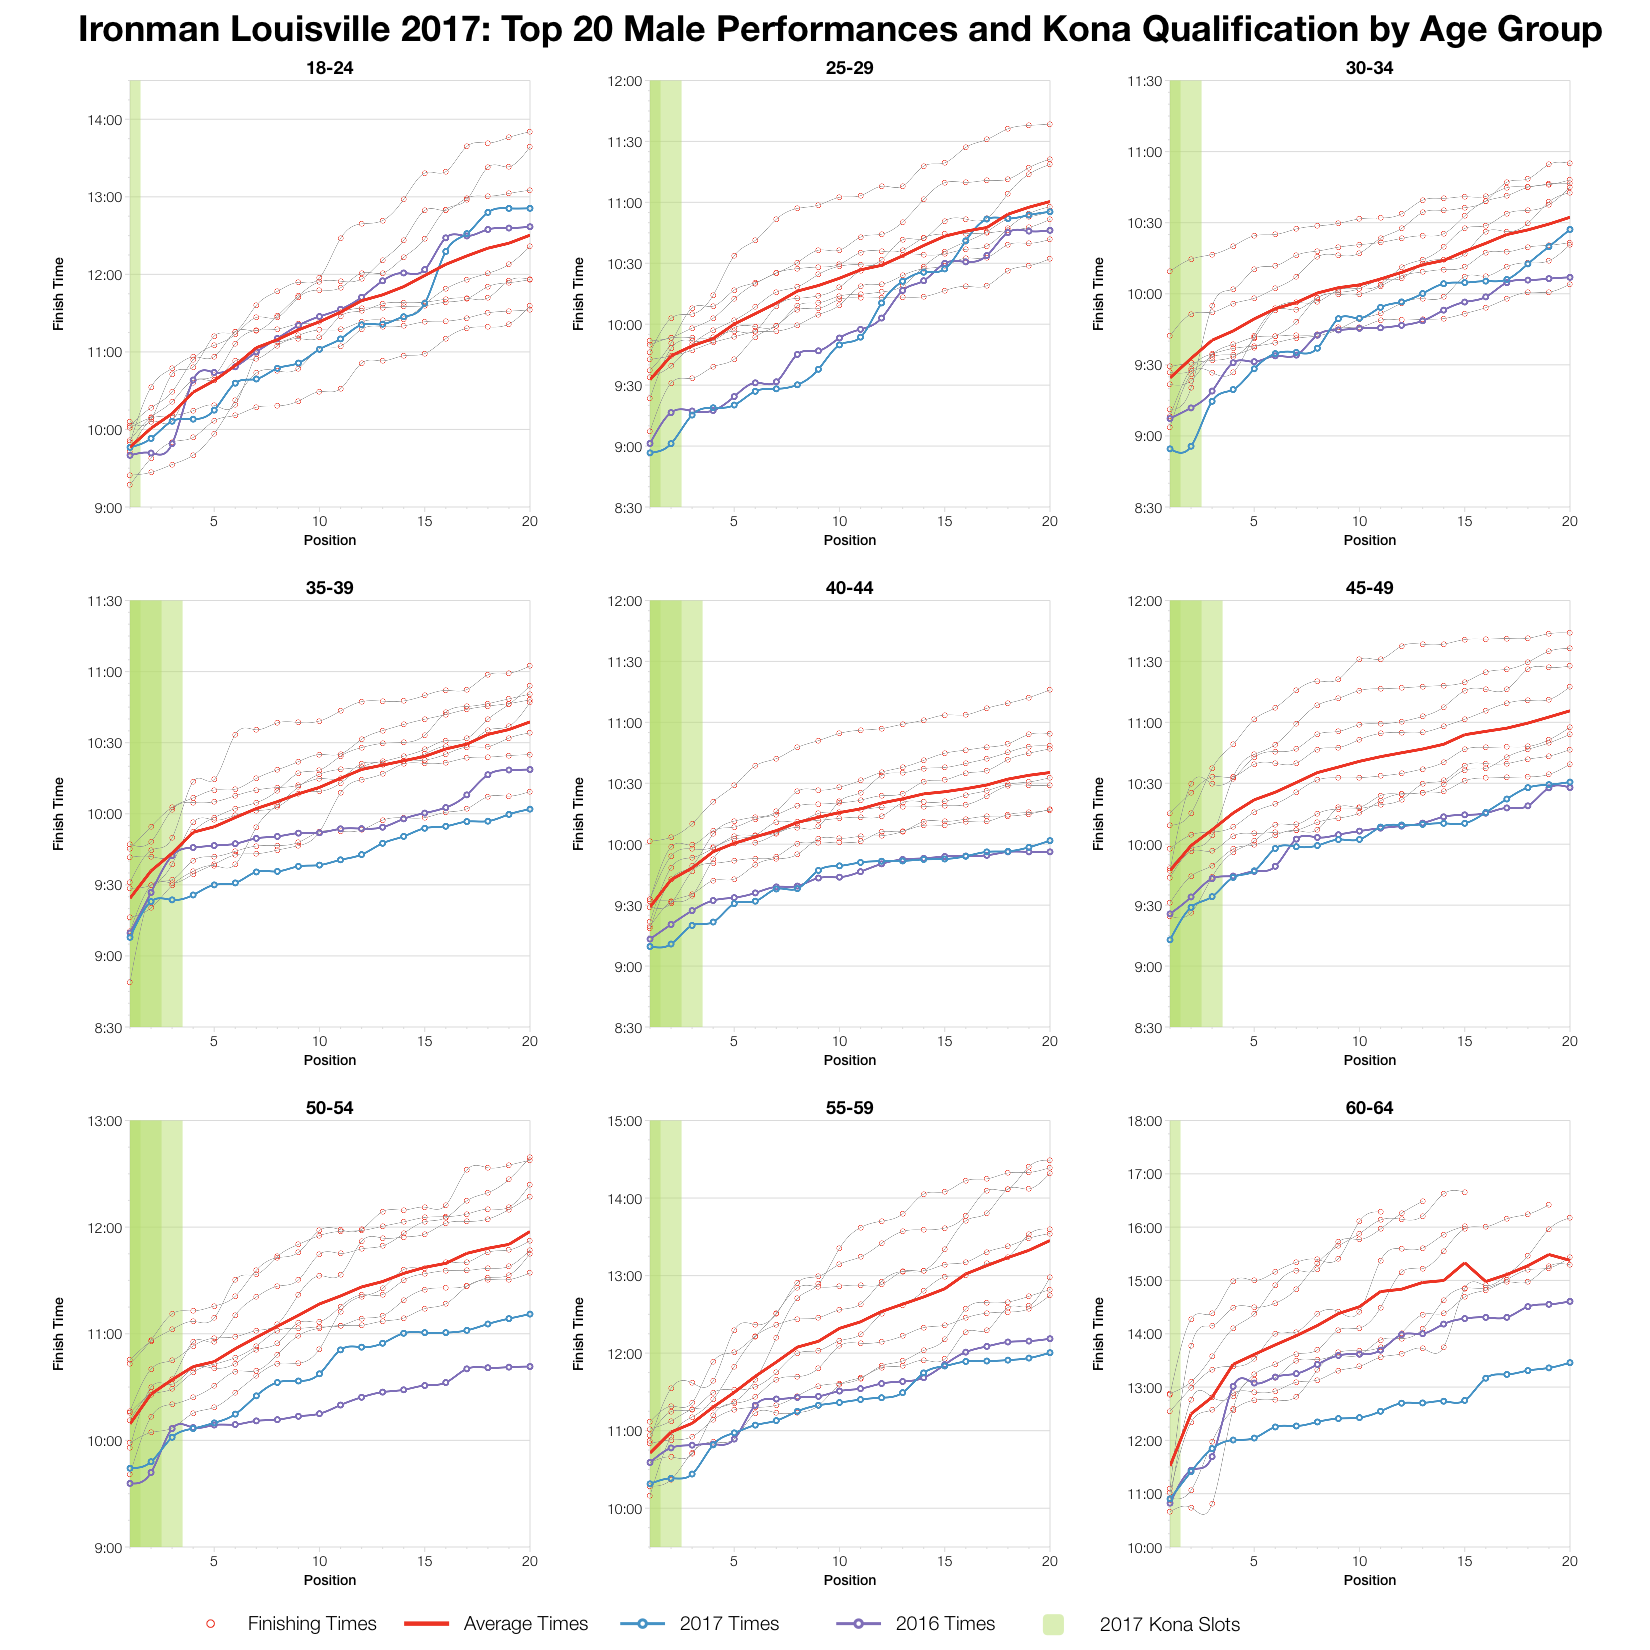
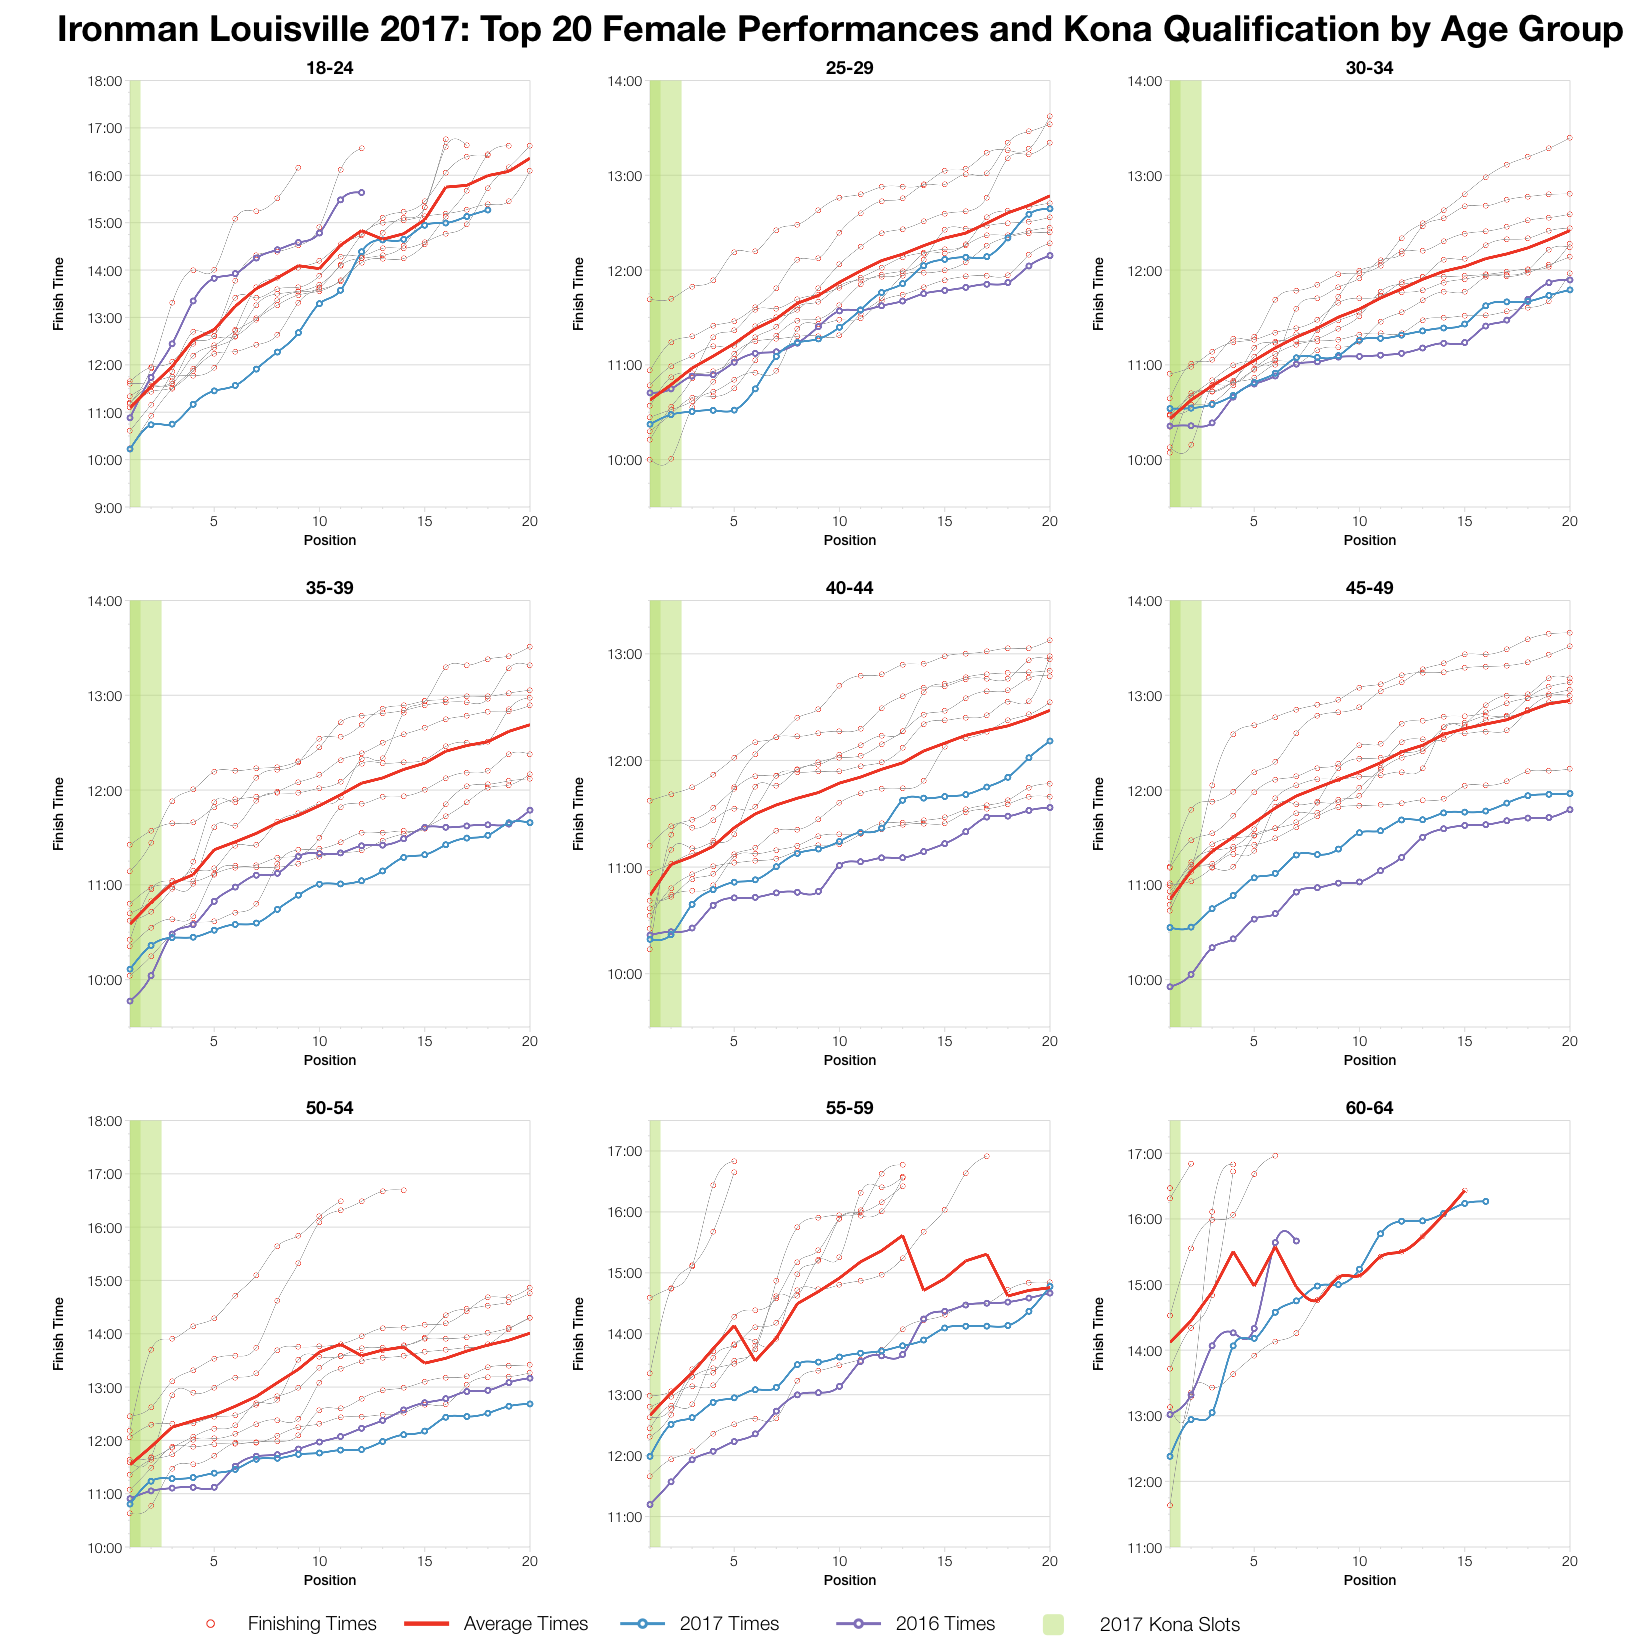
Results for the top twenty in each age group definitely trended ahead of the averages. In some cases these were the fastest times seen on the course, in others they come close with the 2016 race being the nearest competitor. This year’s race was definitely fast for Louisville.

You can access a spreadsheet of the full results from Ironman Louisville 2017 on my Google Drive.

Latest statistics for Ironman Louisville

Kona Qualification

Compare qualification times across the Ironman Calendar.

Kona Consultancy

Individual race analysis and guidance for Kona qualification.

Support the Stats

Support the continued development of these stats.

Comments