Ironman Australia 2018: Age Group Results and Kona Qualification

Latest statistics for Ironman Australia

Ironman Australia took place this weekend. It’s a long standing, mid-sized event that offers 40 Kona slots to its age group athletes. This year’s results look to be typical for the course trending a little slower at the middle of the field, but maintaining competition at the front of the pack.

Distribution of Finisher Splits at Ironman Australia 2018 Compared with 2008-2017

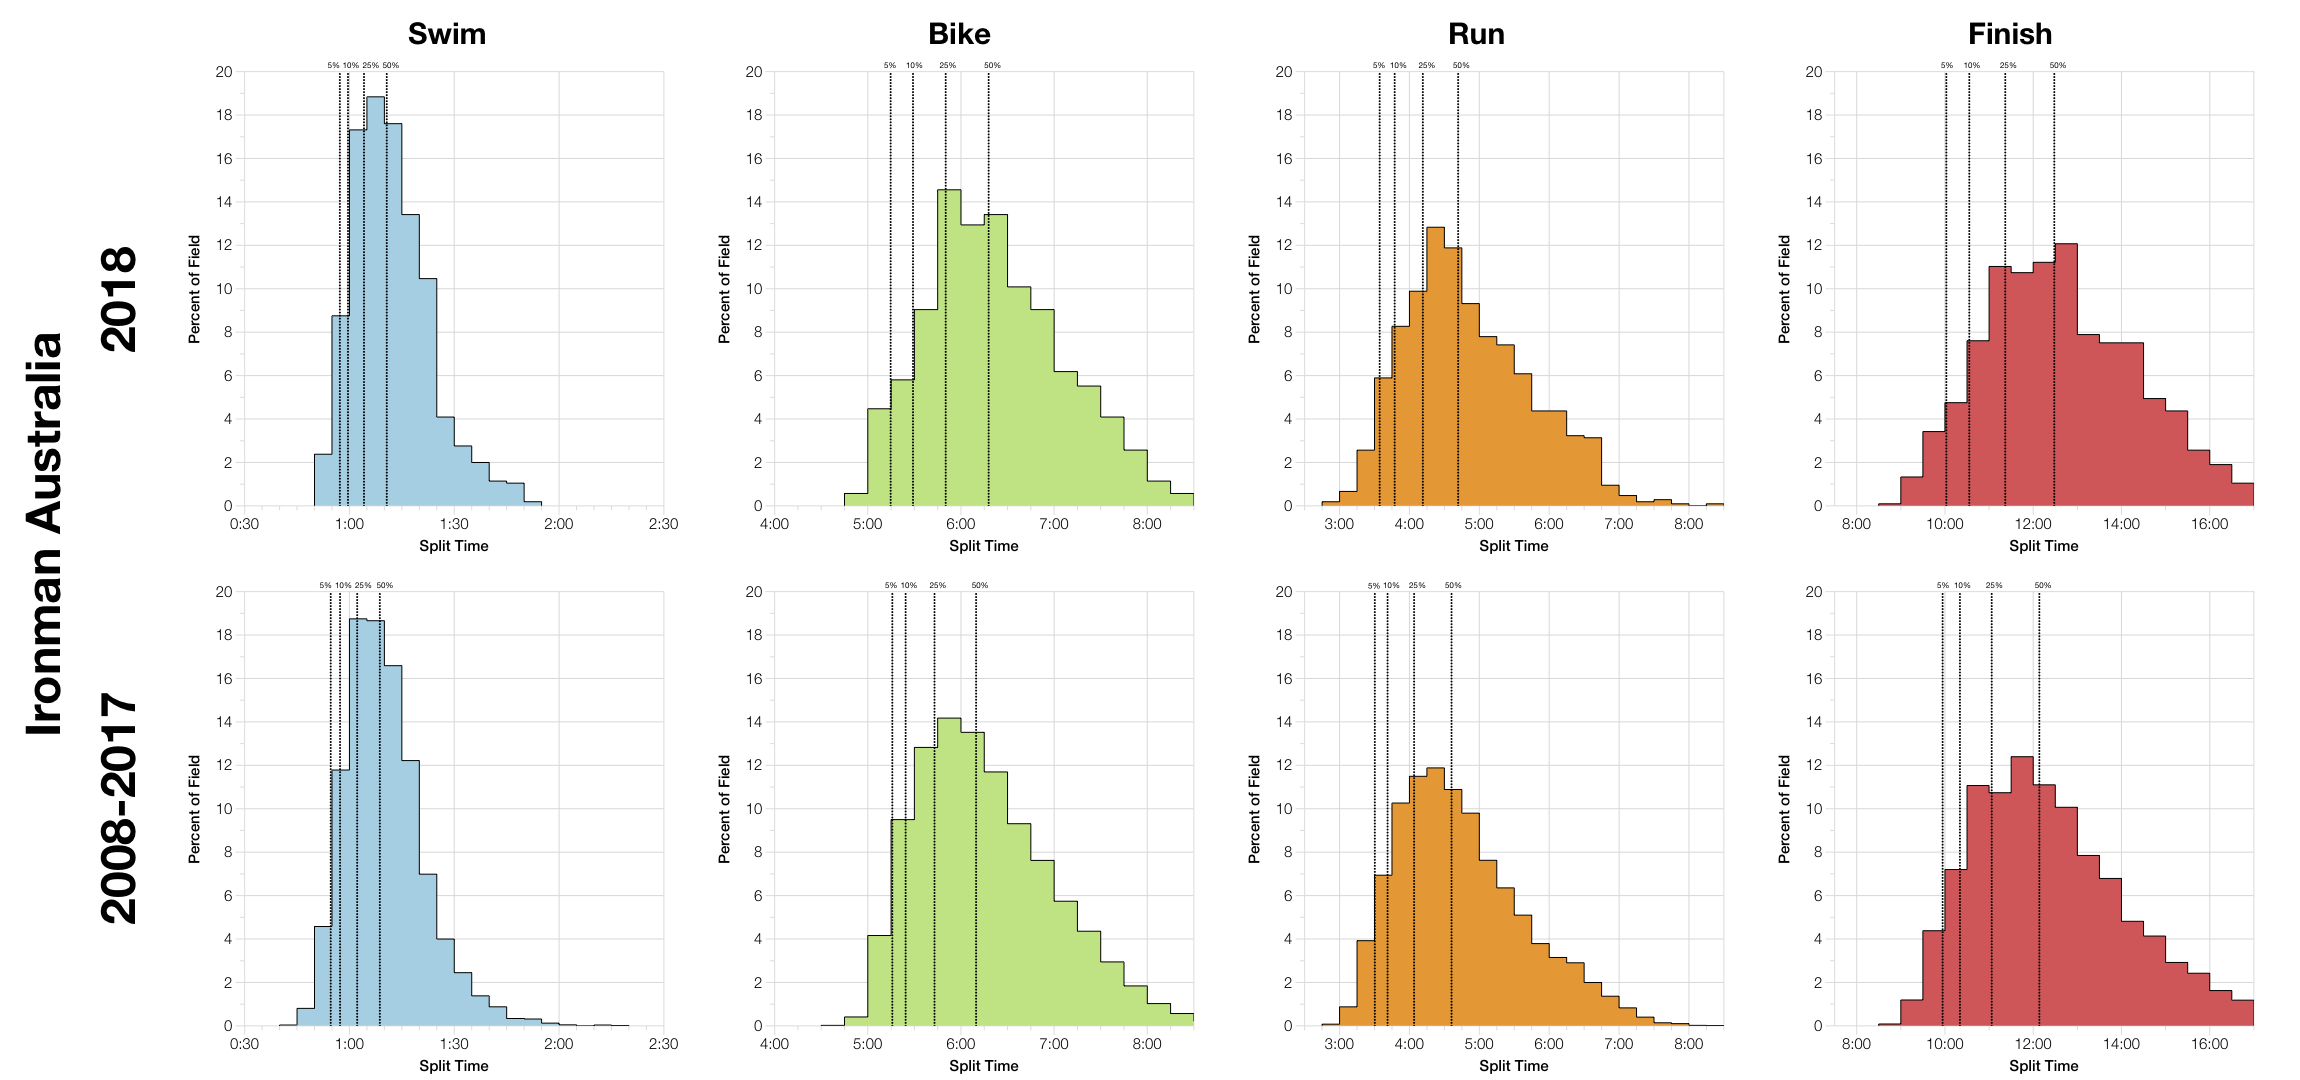
All three stages trend slightly slower at this year’s race when compared with the ten-year data. The changes are all moderate and although this adds up to a bigger impact in the overall splits, it’s not a significant shift. The impact is more at the middle of the pack and back than at the very front.

DNS and DNF Rates at Ironman Australia
Year
Listed Athletes
Swim Finish
Swim DNS/DNF
Bike Finish
Bike DNF
Run Finish
Run DNF
Overall DNS/DNF
2005
1619
1539
4.9%
1092
29%
1366
%
15.6%
2006
1580
1510
4.4%
1475
2.3%
1448
1.8%
8.4%
2007
1620
1521
6.1%
1493
1.8%
1458
2.3%
10%
2008
1543
1460
5.4%
1432
1.9%
1410
1.5%
8.6%
2009
1400
1323
5.5%
1300
1.7%
1282
1.4%
8.4%
2010
1482
1458
1.6%
1422
2.5%
1384
2.7%
6.6%
2011
1070
1048
2.1%
1038
1%
1016
2.1%
5%
2012
1348
1342
0.4%
1323
1.4%
1298
1.9%
3.7%
2013
1603
1423
11.2%
1389
2.4%
1352
2.7%
15.7%
2014
1699
1505
11.4%
1480
1.7%
1451
2%
14.6%
2015
1530
1365
10.8%
1325
2.9%
1282
3.2%
16.2%
2016
1355
1345
0.7%
1325
1.5%
1294
2.3%
4.5%
2017
1132
1131
0.1%
1099
2.8%
1072
2.5%
5.3%
2018
1135
1135
0%
1103
2.8%
1071
2.9%
5.8%

Although the DNF numbers for this race are towards the higher end of the range for this course, they’re far from extreme and suggest conditions were reasonable on race day.

Median Splits by Age Group at Ironman Australia 2018
Median Splits by Age Group at Ironman Australia 2008-2017

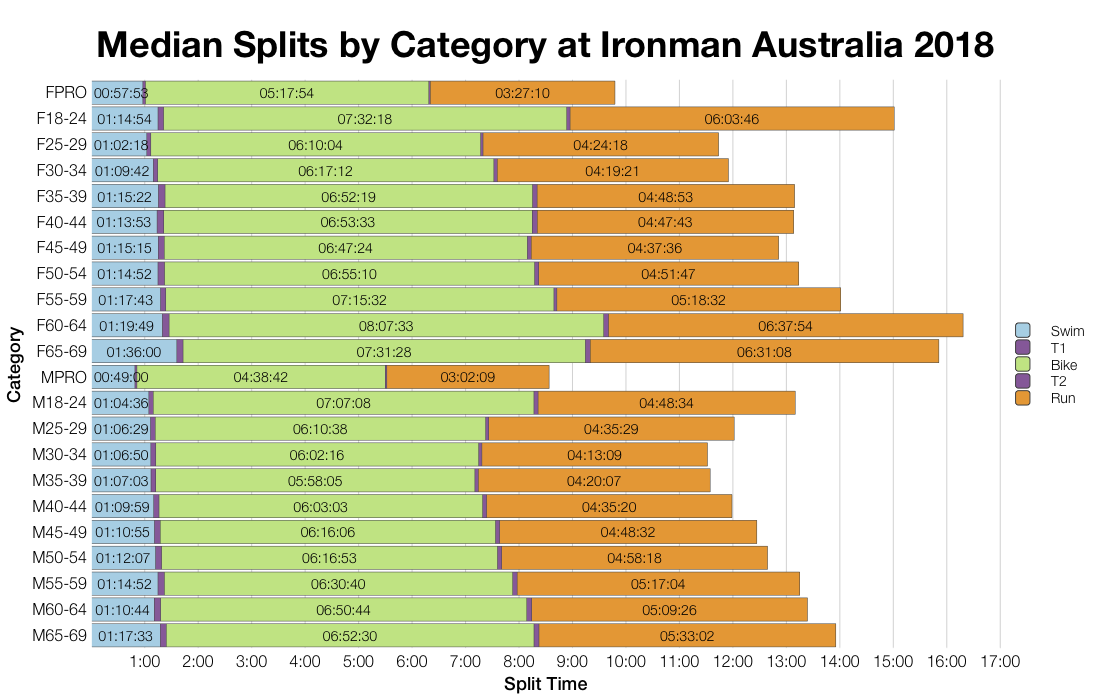
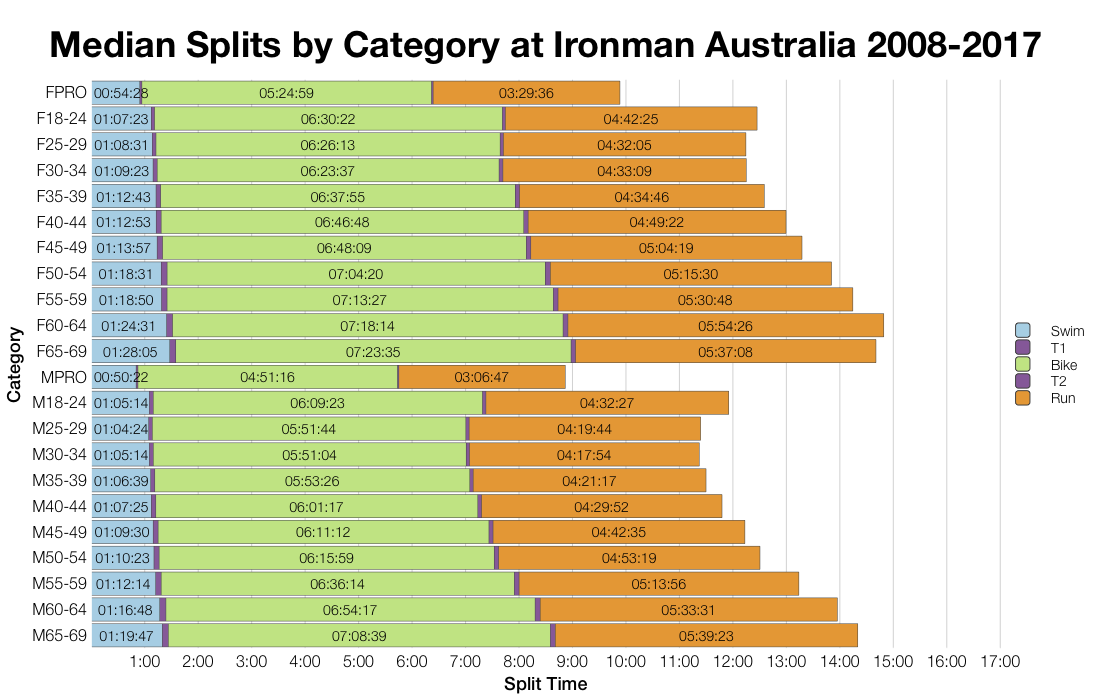
There’s some variability in how age group medians compare and not all divisions have slower median bike or run splits at this year’s race. While some age groups were more inline with past results than others, the overall trend is towards a slightly slower race.

Top 10 Nationalities at Ironman Australia
Country
Count
Percentage
Australia
996
82.6
United Kingdom
51
4.2
Japan
19
1.6
New Zealand
18
1.5
Hong Kong
12
1
United States
11
0.9
China
9
0.7
Thailand
8
0.7
Singapore
8
0.7
Philippines
8
0.7
Ironman Australia 2018 Predicted Kona Qualifiers by Country
Country
Percentage of Slots
Percentage of Field
Australia
92.5
82.6
New Zealand
2.5
1.5
France
2.5
0.4
United Kingdom
2.5
4.2

Ironman Australia pulls in a reasonable number of other nationalities to the race, but the majority of the slots remain in Australia.

Changes in Male Finishing Times by Position at Ironman Australia
Changes in Female Finishing Times by Position at Ironman Australia

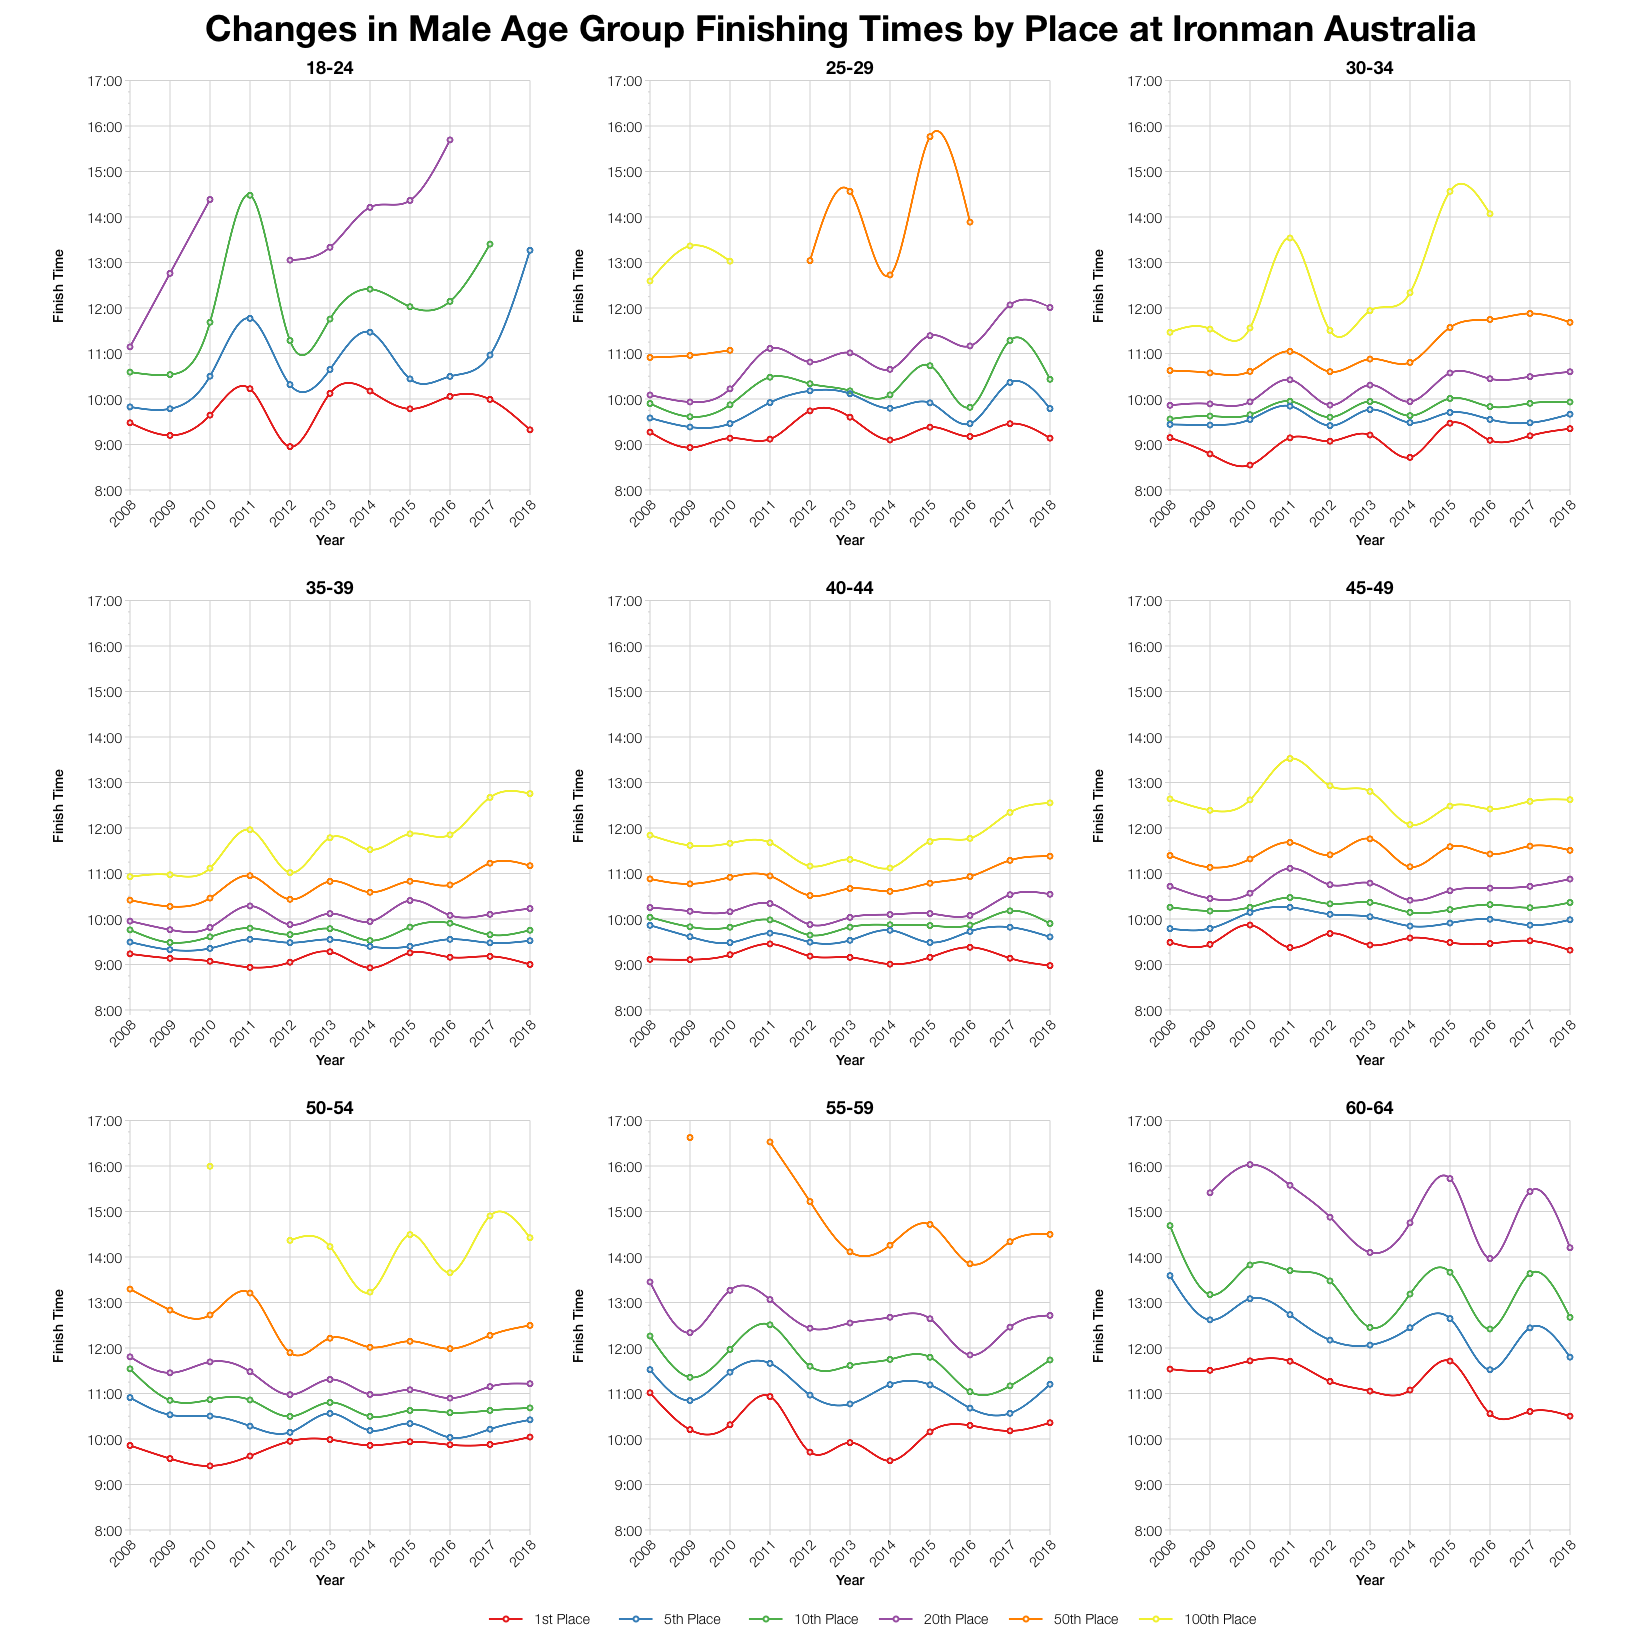
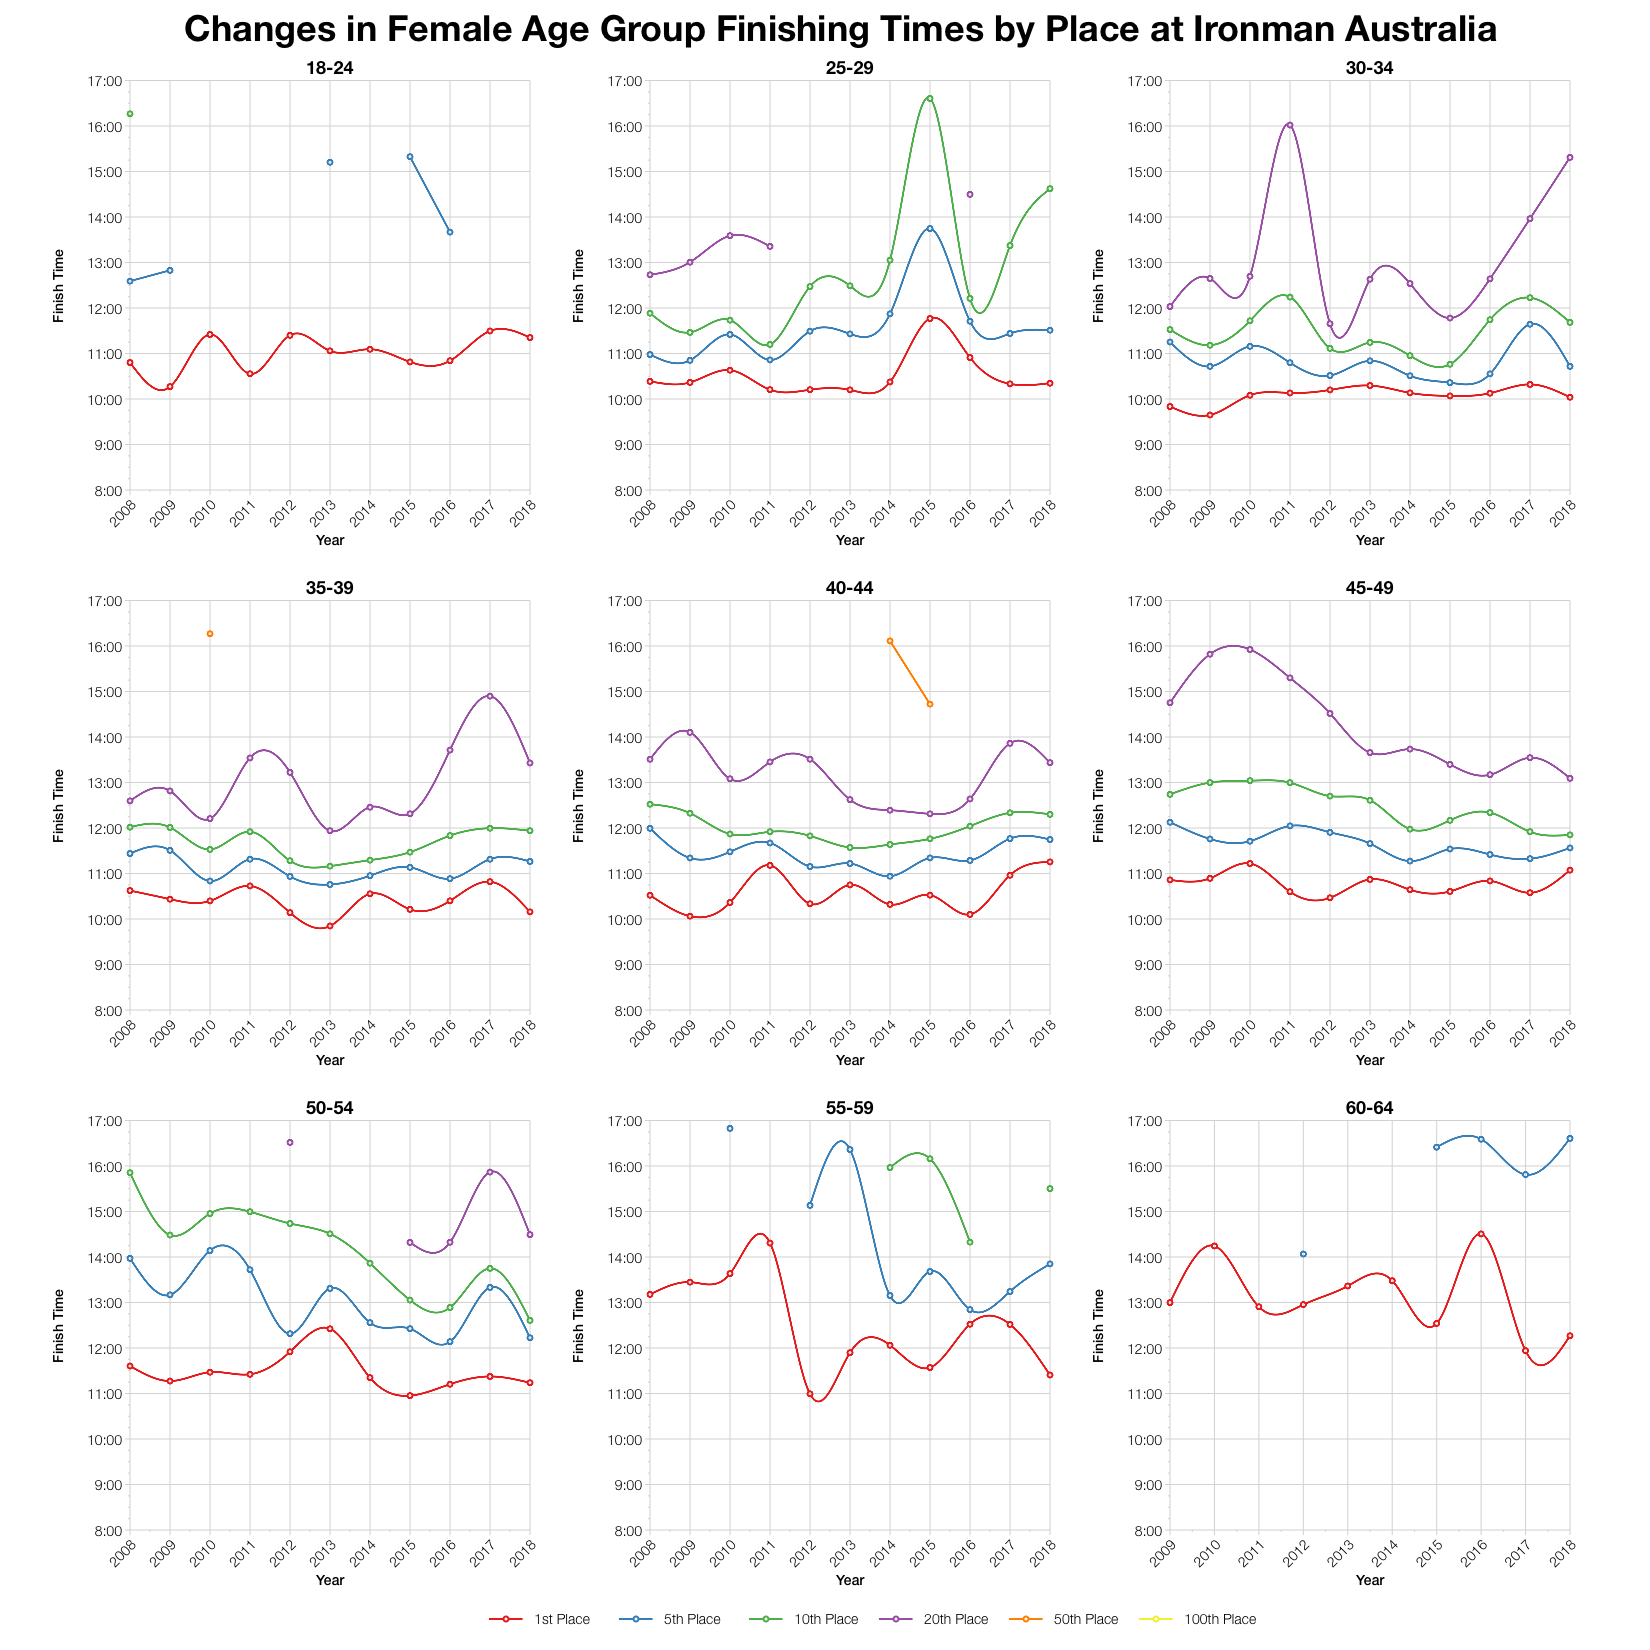
Comparing age group positions over time shows that this year’s race doesn’t diverge much from previous years. More specifically we can see both how changes in times do vary a lot over age groups, but also position. As noted, times at the front aren’t too different to previous years, it’s further back where there’s more change, often with a slightly slower time than recent races.

Ironman Australia 2018 Predicted Kona Qualification Times
Age Group
Slots
Winner
Average Kona Qualifier
Final Qualifier
M18-24
1
09:19:18
09:19:18
09:19:18
M25-29
2
09:08:25
09:12:05
09:15:45
M30-34
2
09:20:49
09:25:10
09:29:31
M35-39
3
09:00:02
09:08:03
09:14:25
M40-44
4
08:58:30
09:18:34
09:31:50
M45-49
4
09:18:54
09:39:43
09:57:13
M50-54
3
10:02:36
10:06:33
10:08:39
M55-59
2
10:21:23
10:29:38
10:37:54
M60-64
2
10:30:10
10:33:11
10:36:12
M65-69
1
11:36:45
11:36:45
11:36:45
M70-74
1
12:13:40
12:13:40
12:13:40
M75-79
1
15:27:46
15:27:46
15:27:46
F18-24
1
11:21:00
11:21:00
11:21:00
F25-29
1
10:20:51
10:20:51
10:20:51
F30-34
1
10:02:23
10:02:23
10:02:23
F35-39
2
10:09:22
10:28:12
10:47:02
F40-44
2
11:15:15
11:17:53
11:20:31
F45-49
2
11:04:29
11:05:53
11:07:17
F50-54
1
11:14:09
11:14:09
11:14:09
F55-59
1
11:24:23
11:24:23
11:24:23
F60-64
1
12:16:05
12:16:05
12:16:05
F65-69
1
15:51:06
15:51:06
15:51:06
F70-74
1
15:45:01
15:45:01
15:45:01

Based on the start list I’ve estimated the Kona slot allocation and from that the automatic Kona qualification times. Final numbers may vary and roll down will affect the qualifying times too. You can review times for every Ironman race on my Kona qualification page.

Top Twenty Male Performances and Kona Qualification by Age Group at Ironman Australia 2018
Top Twenty Female Performances and Kona Qualification by Age Group at Ironman Australia 2018

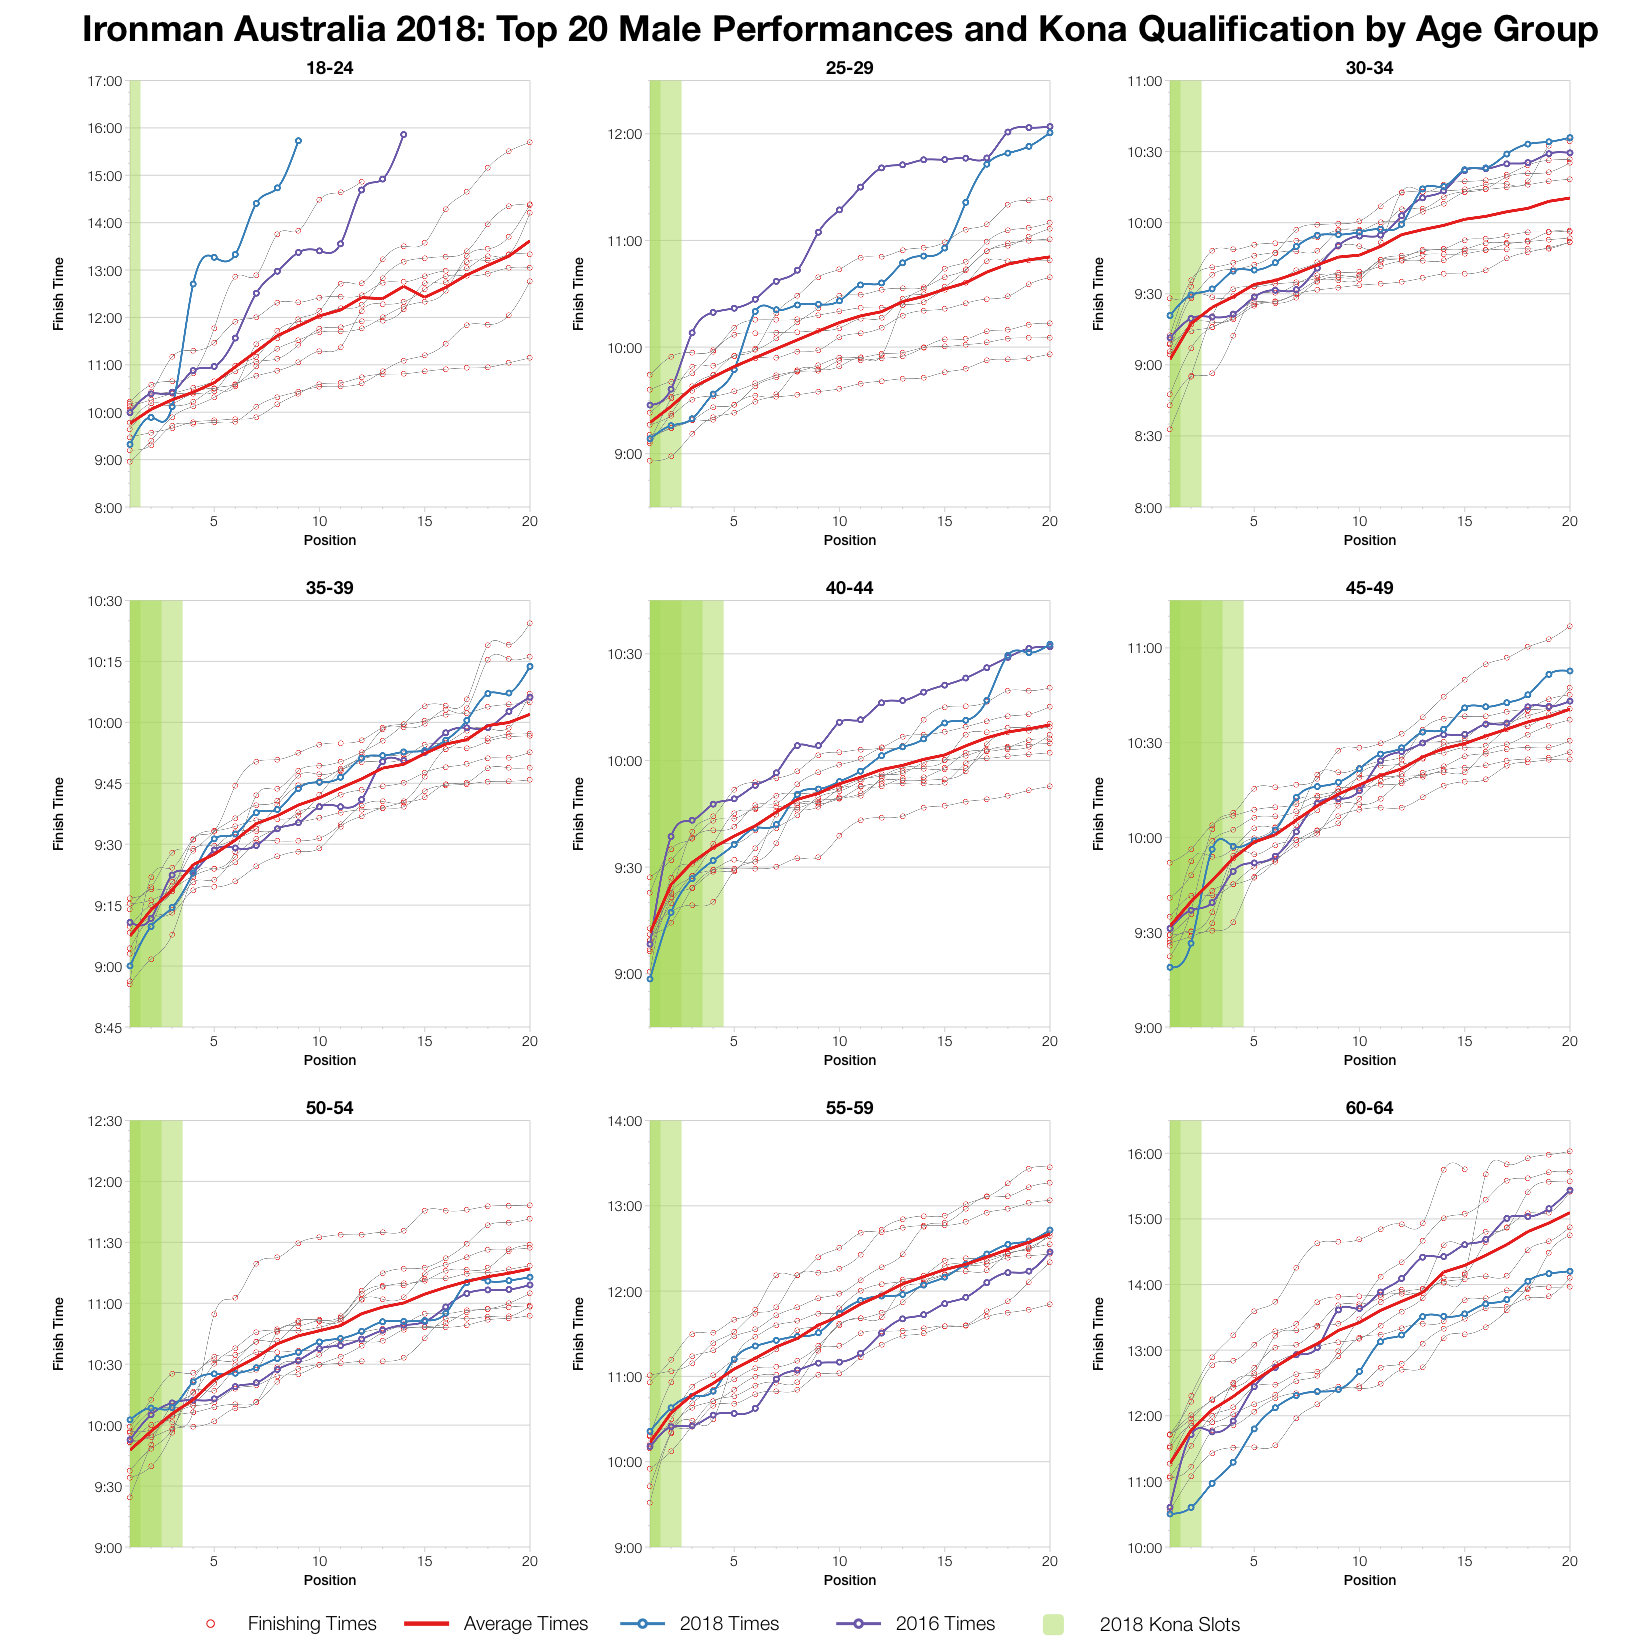
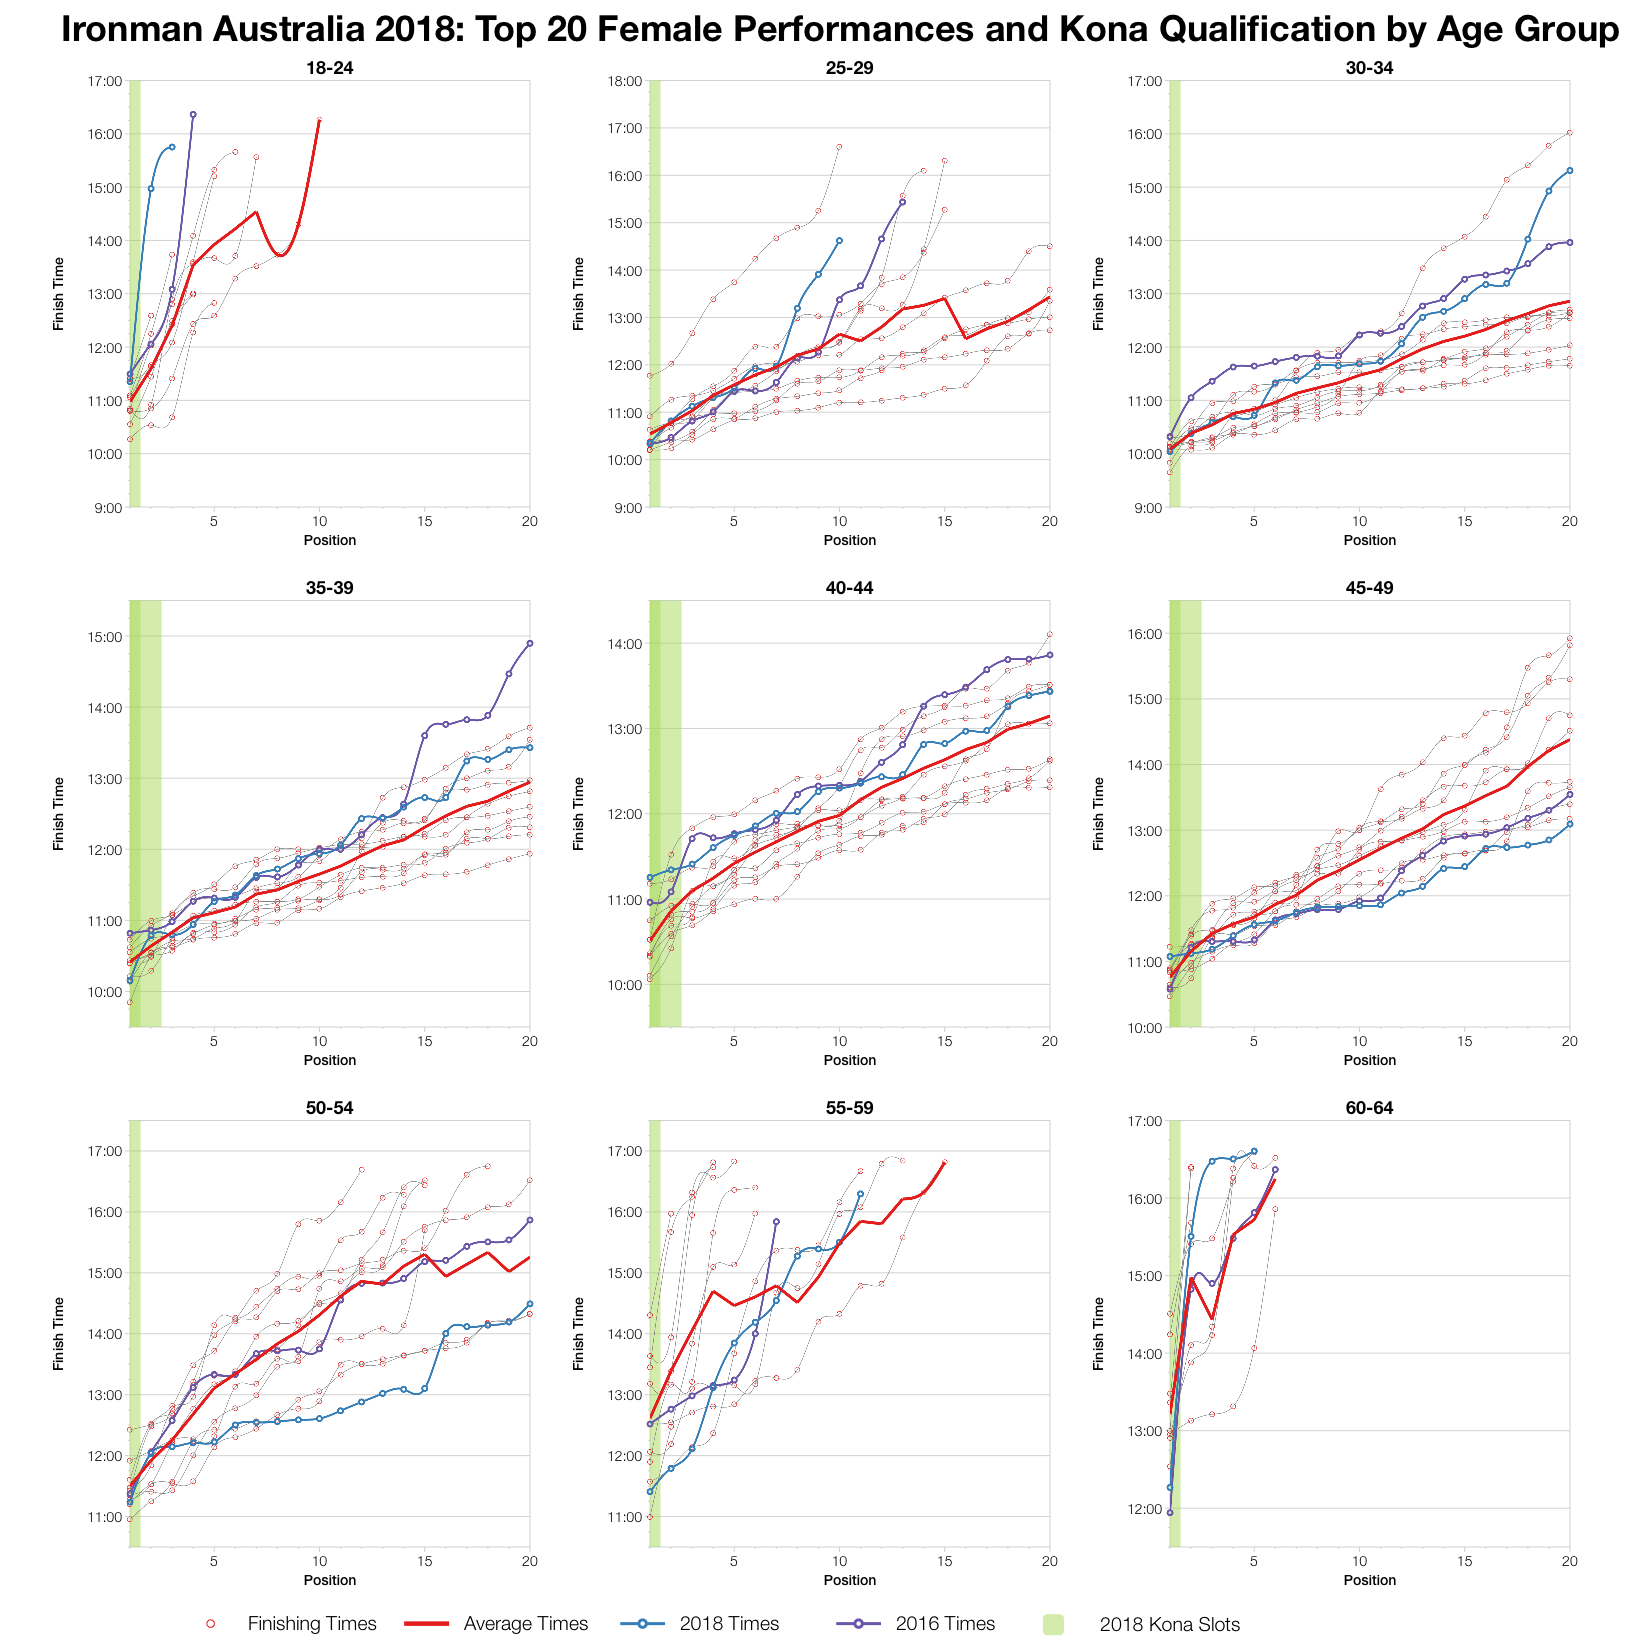
There’s a lot of variability over the top twenty age group times. For the biggest age groups though the times are very close to the average at the front of the pack and qualification times tend to fall in line with past results too.

You can access a spreadsheet of the full results from Ironman Australia 2018 on my Google Drive.

Latest statistics for Ironman Australia

Kona Qualification

Compare qualification times across the Ironman Calendar.

Kona Consultancy

Individual race analysis and guidance for Kona qualification.

Support the Stats

Support the continued development of these stats.

Comments