On Friday I was certain a 9:30 finish at Ironman France was a safe bet for a Kona slot. In the last 10 years of racing that time would have easily been sufficient to place within the slots. This year it was a close call. Results from the 2013 Ironman France are fast with some impressive age group performances at the front. The pros weren’t bad either with Mary Beth Ellis setting a new course record in the women’s field. How did the overall race shape up?
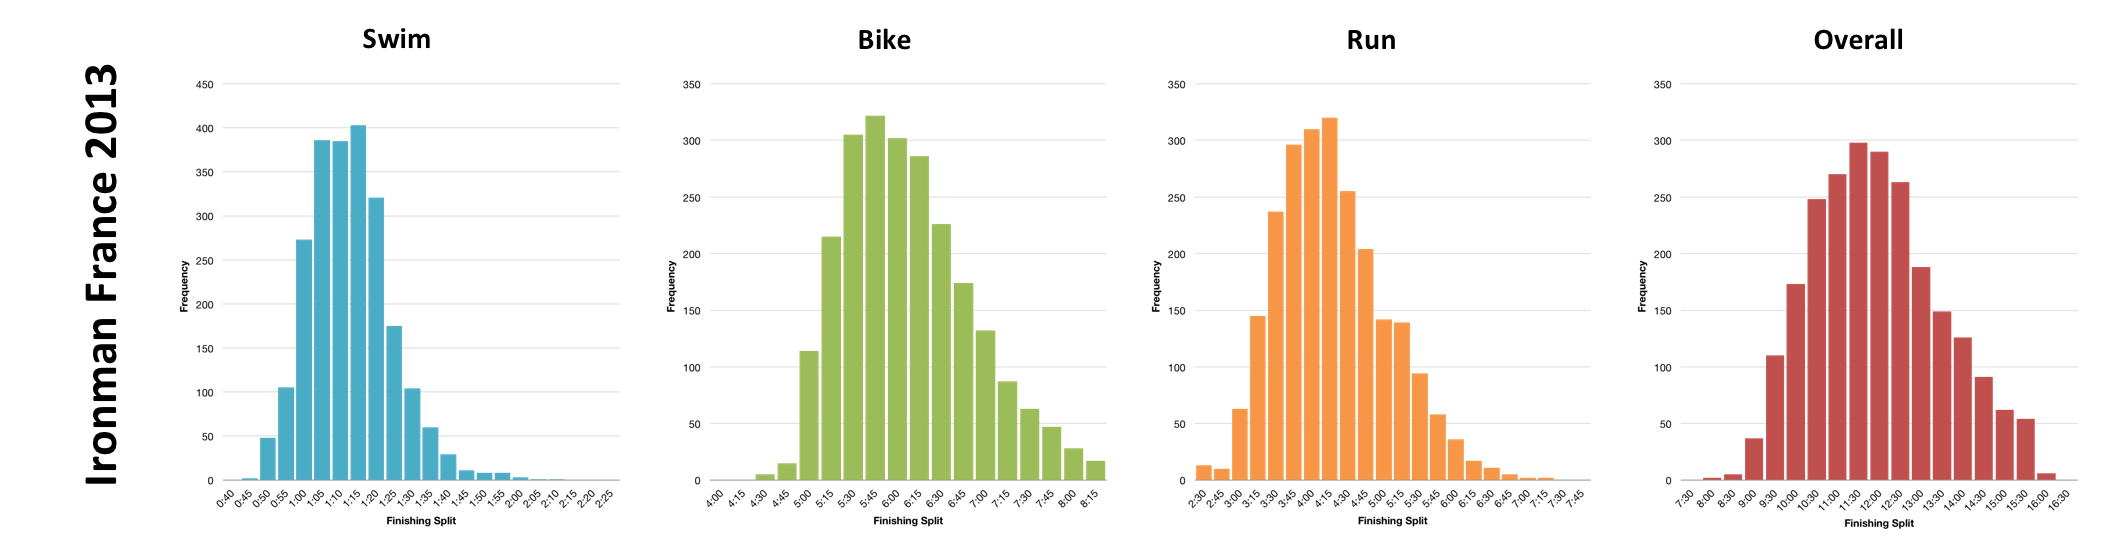

If we compare the 2013 distribution of splits with those from previous races (roughly 10 years of data) there is a clear skew towards faster overall times this year. Similarly when looking at run splits we again see a leftward skew to the data not present in the cumulative distribution. I’ve heard some talk of a slightly short run course, but couldn’t comment if this was a factor in that shift. We also see a more subtle, but still evident skew in the bike splits; there is a little more weight in the sub-6 hour region. The swim however bucks the trend and appears to be slightly slower than the norm. Ultimately though a marginally slower swim is easily counterbalanced by faster bike and run and a faster race results.
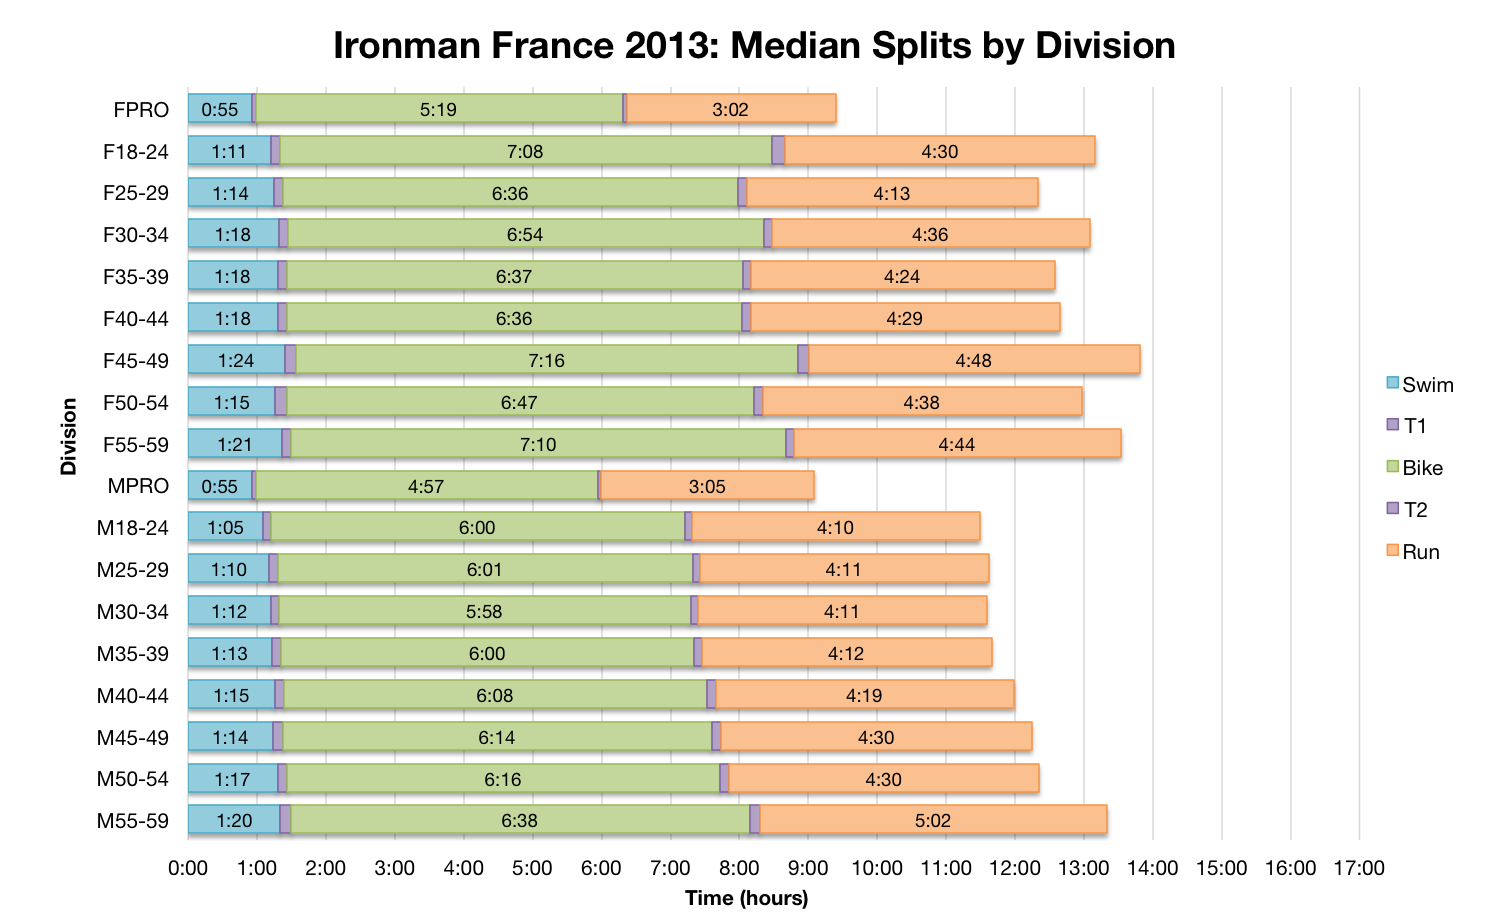
Average splits fully support this breakdown of the race: swim times are slightly slower, bike and run slightly faster. The pattern is clear leaving little more to add. Conditions were presumably very good and combined with some fit athletes we saw one of the faster instances of this race.
I’ve not yet seen a list of Kona slots to determine if my predicted allocation is correct. The Ironman France website may publish these details, but at this point the slots in the graphs below are estimates rather than final numbers.
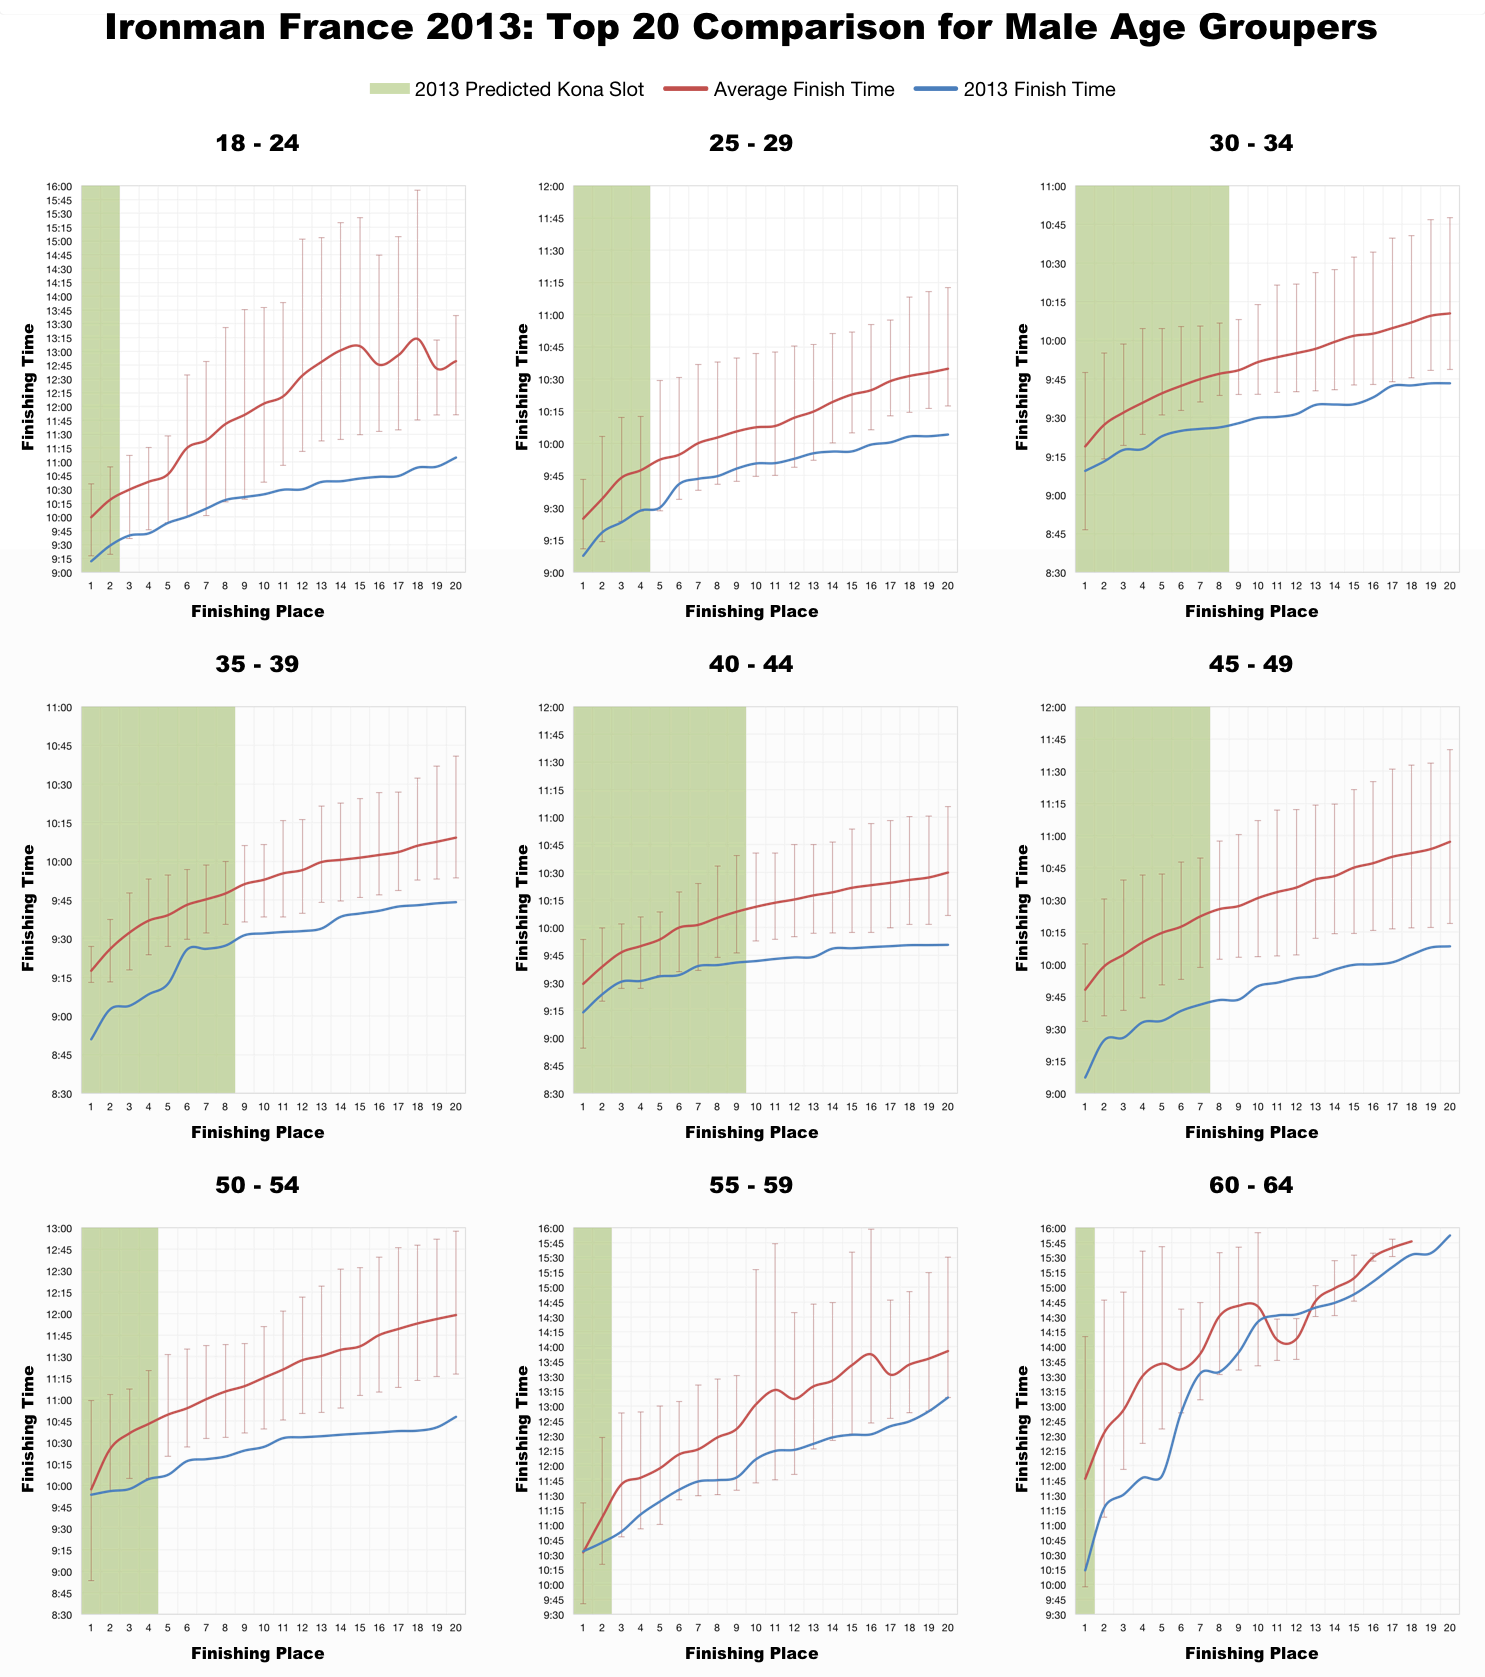
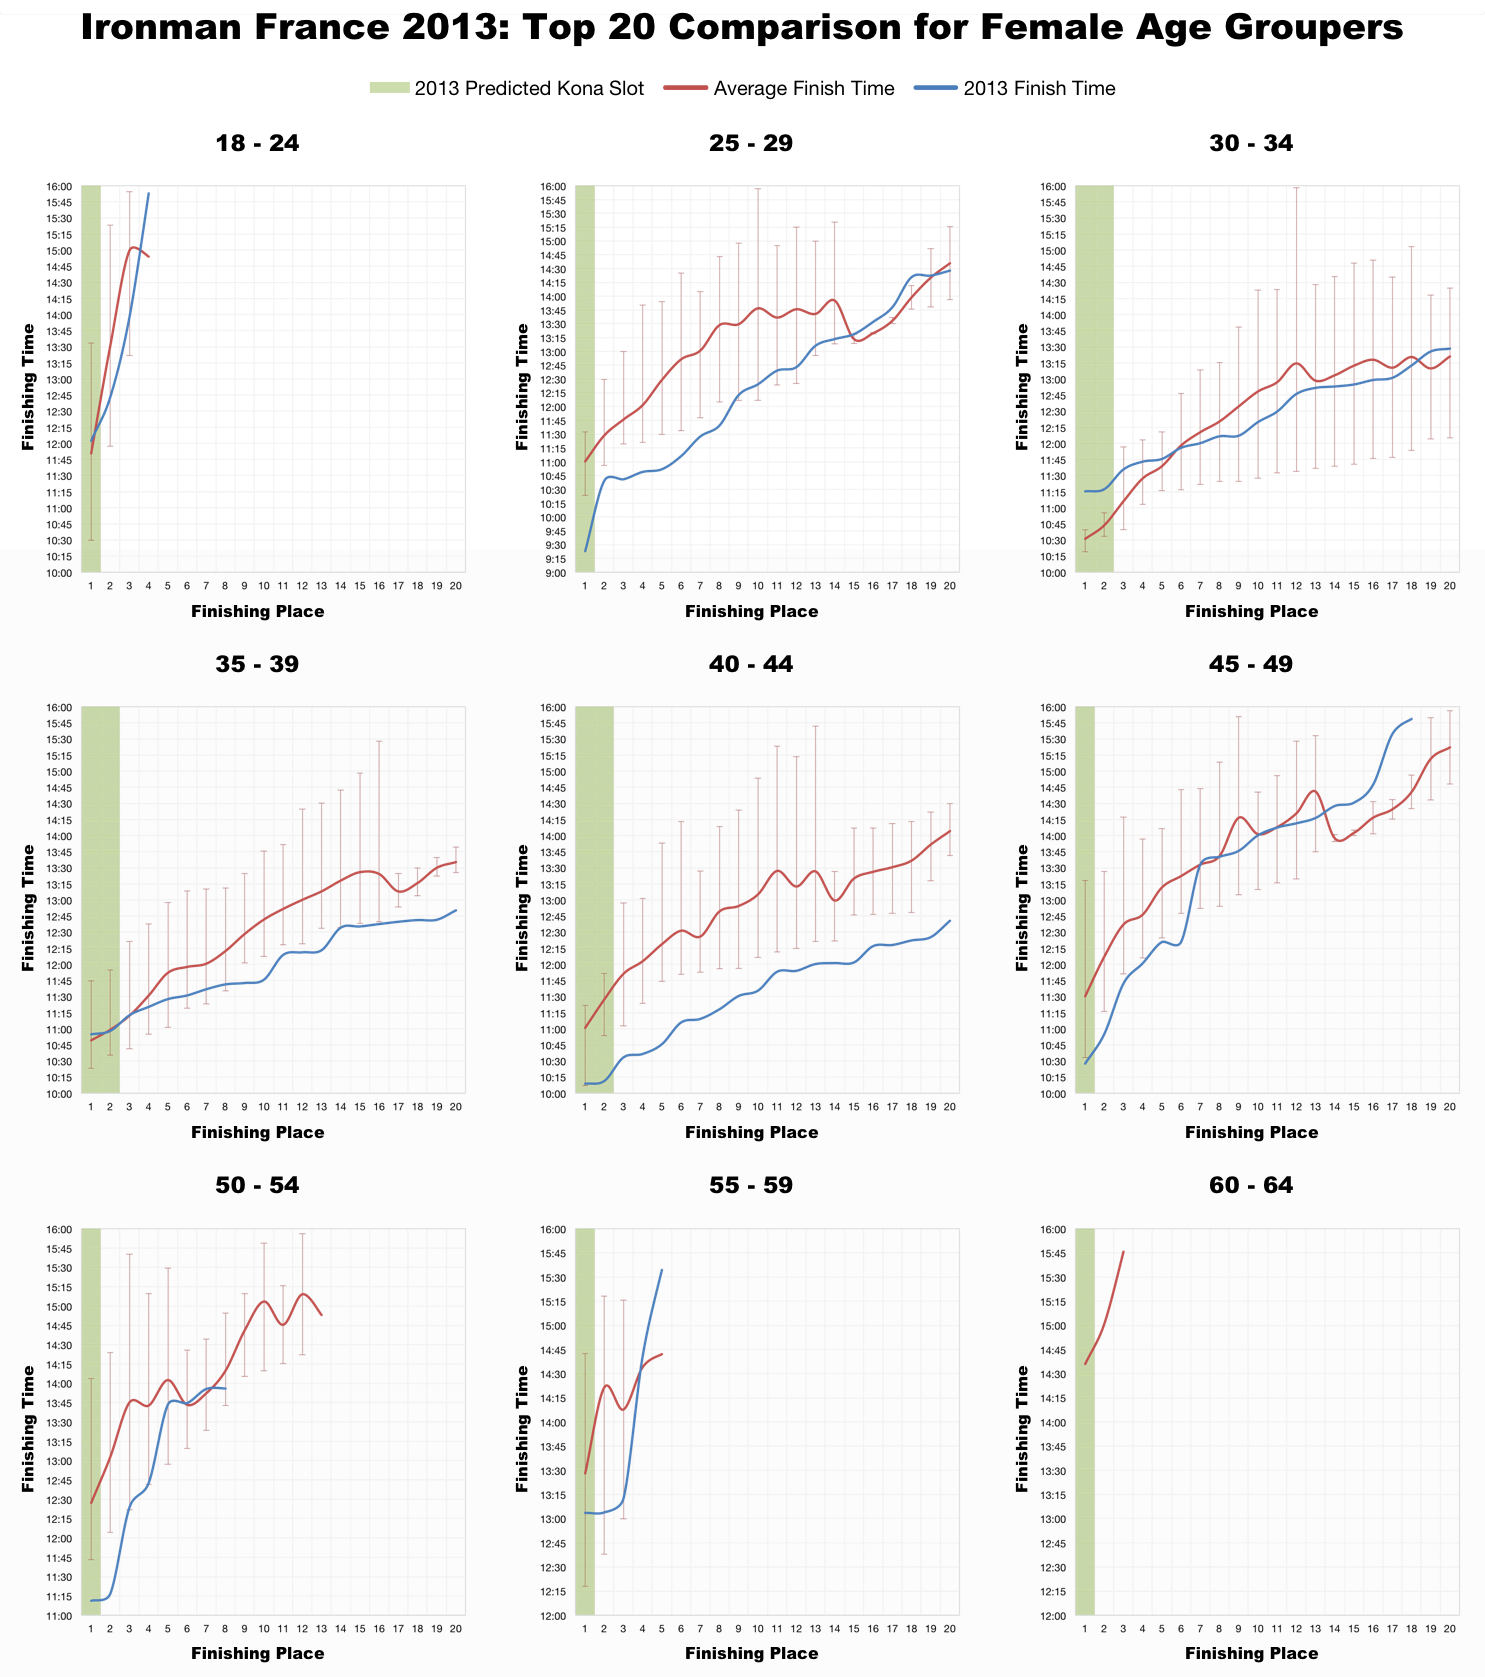
Again the analysis is simple – times were fast. When comparing race results it’s hard to determine if time differences are a result of conditions or quality of the field. Usually we expect a mix of the two to play a role and on average, over a number of years of racing, these factors would largely balance each other out. The pattern this year is so consistent across the all age groups that I feel it’s safe to conclude conditions were good. I know there were some fast athletes present too, this was a strong field, but when nearly everyone is faster than average – or the previous fastest times – conditions must be playing a major role. Again my graphs offered little predictive value.
Wrapping things up: Ironman France was particularly rapid in 2013. Results were at the faster end of the scale with a few exceeding previous course bests in their age groups. I’ve uploaded a spreadsheet of the Ironman France 2013 results and splits to Google Drive as usual. Tomorrow I’ll look at the results from Ironman Coeur d’Alene and the first trial of the Swim Smart start.


