Lanzarote is known to be one of the toughest – perhaps the toughest – Ironman races on the calendar. You don’t enter it expecting an easy ride; it’s a good job really because this year you certainly didn’t get one. The results clearly show that high, gusting winds put a serious dent in race times, perhaps in the order of 30 minutes on what might be considered a typical day on the island. All my charts demonstrate this slowing, including a new addition to the set later in this post.
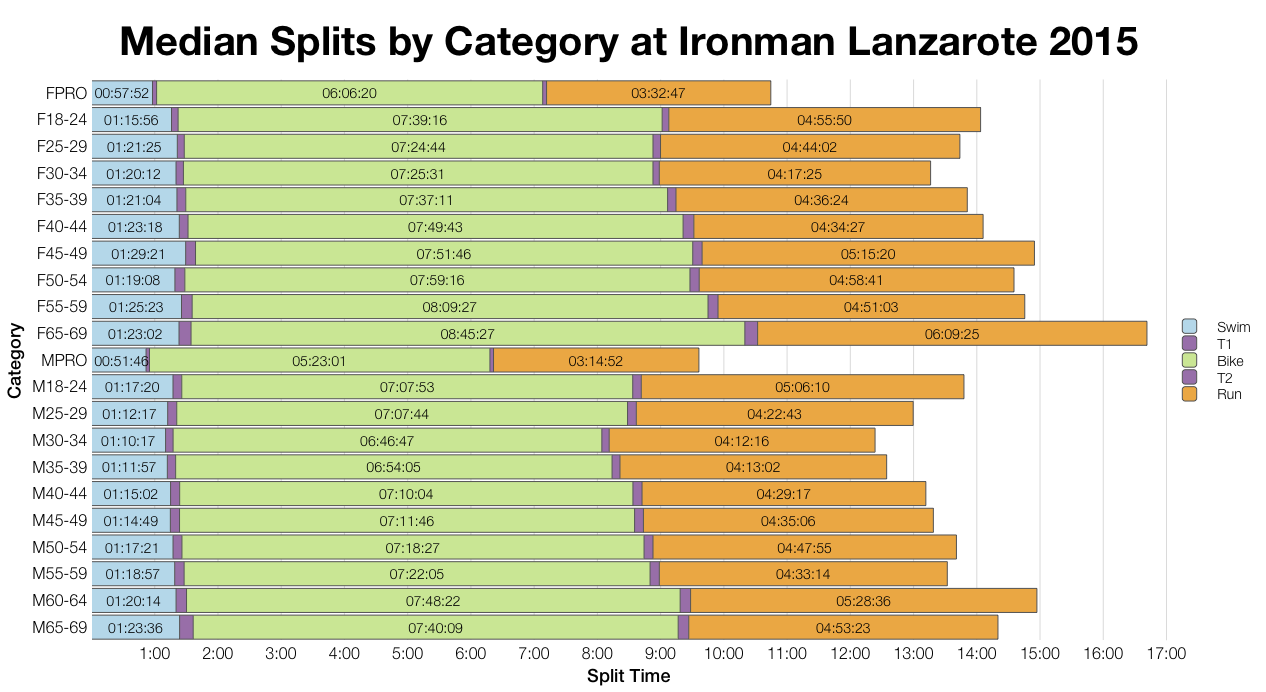
Let’s start from the top with the median splits across the age groups. When it comes to swim and bike the analysis is pretty simple: everyone was slower this year. However, on the run some age groups managed to improve their median times. Unexpected on a tough day, but a higher DNF rate on the bike may help to explain this (roughly 90 athletes DNFed on the bike, this may not seem much, but on a one loop course you have a long way home if you decide to stop). whatever the reason a number of age groups showed small, hardly significant, improvements on the typical run times.
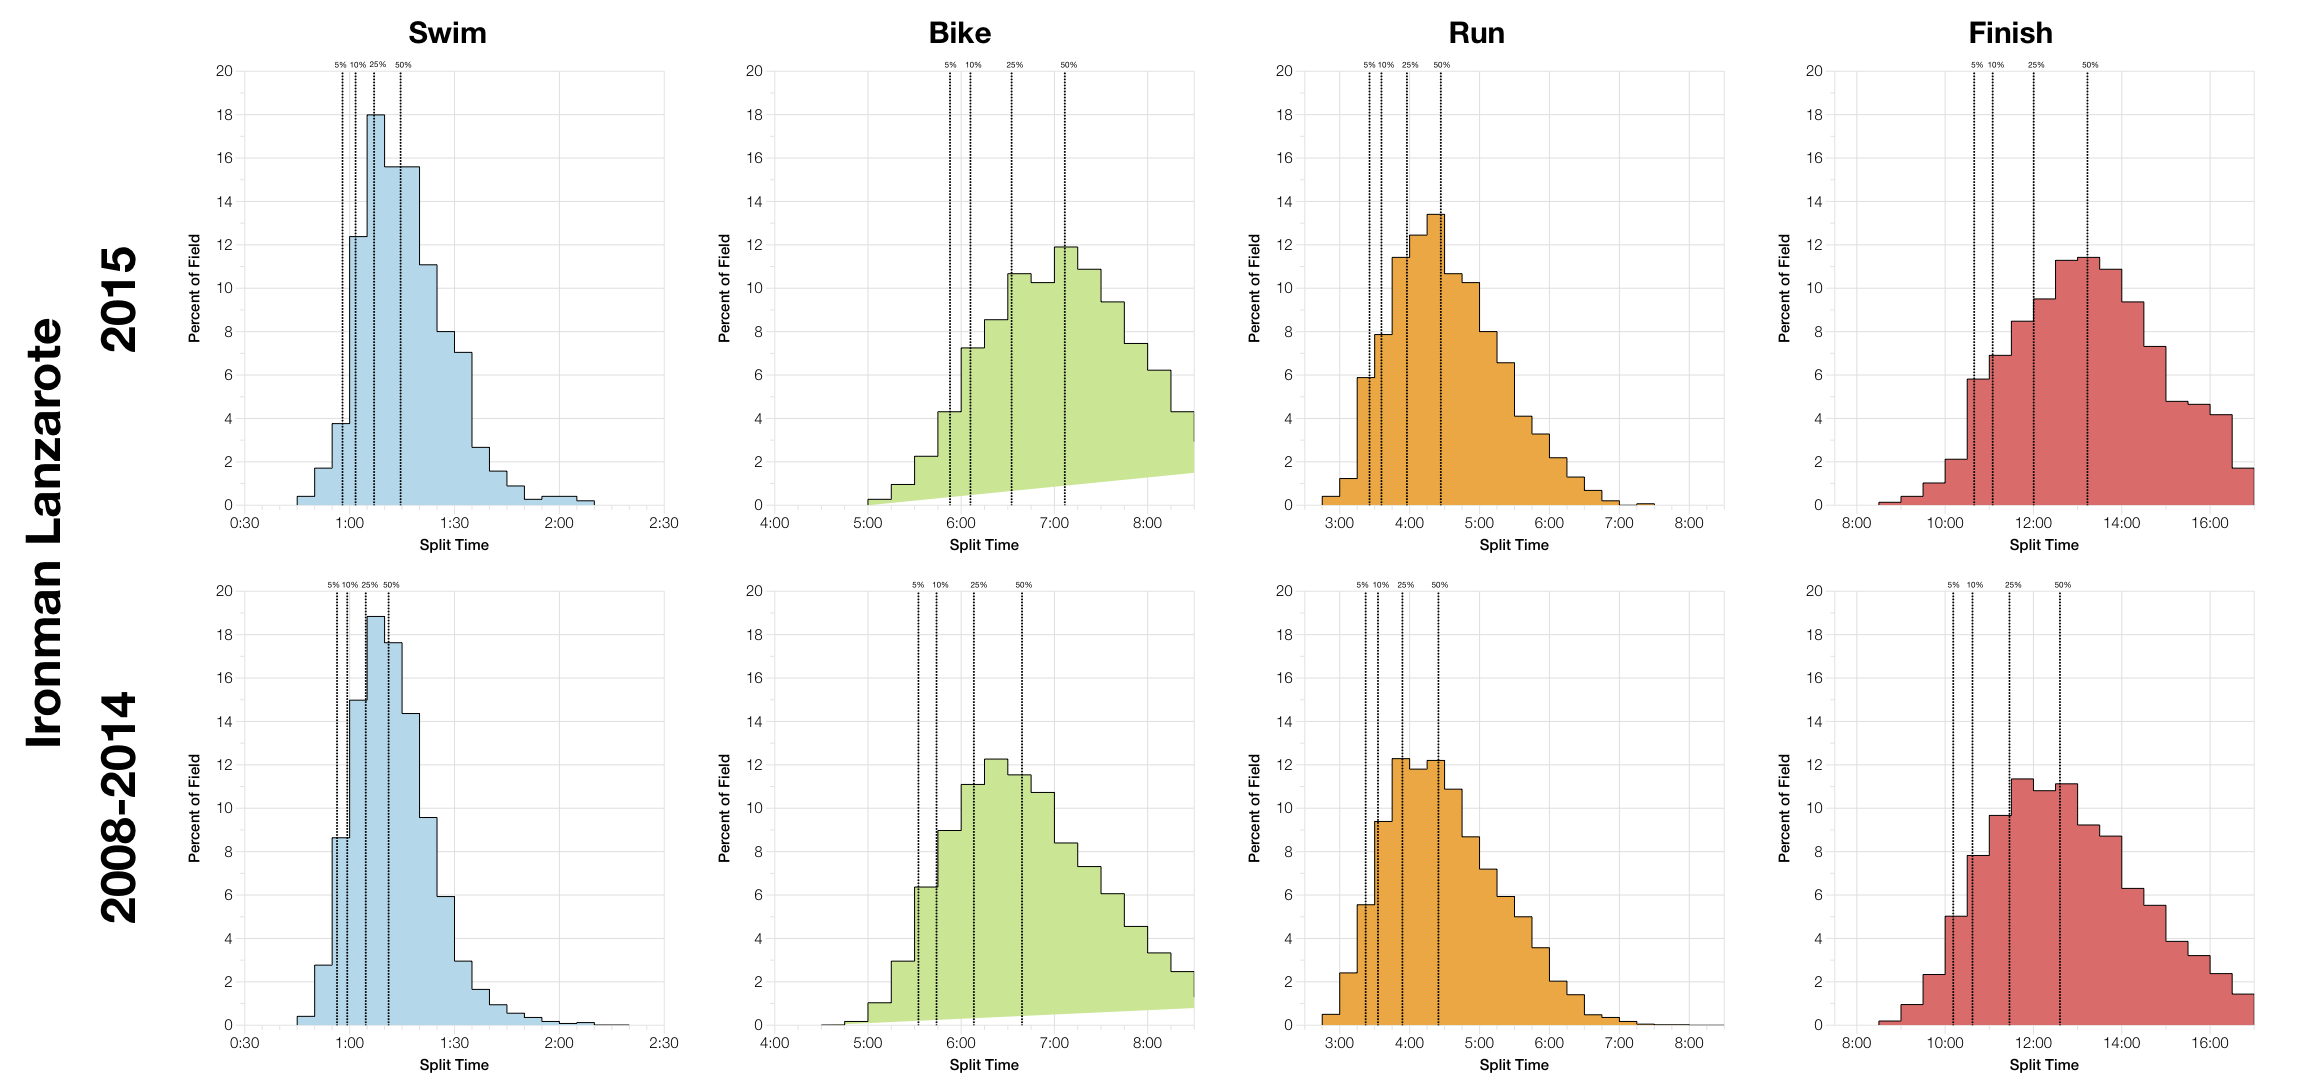
Race distributions for the entire field present a simpler picture. All three splits trend slower, but none more so than the bike. It’s rare to see the impact so consistent – roughly 20 minutes slower for the top 5% of the field and 30 minutes slower in the middle. Swim, and in this instance run, also trend slower, but by much smaller margins. The net effect is a big shift in the overall finish times, seeing something in the order of a 30 minute shift over the field.
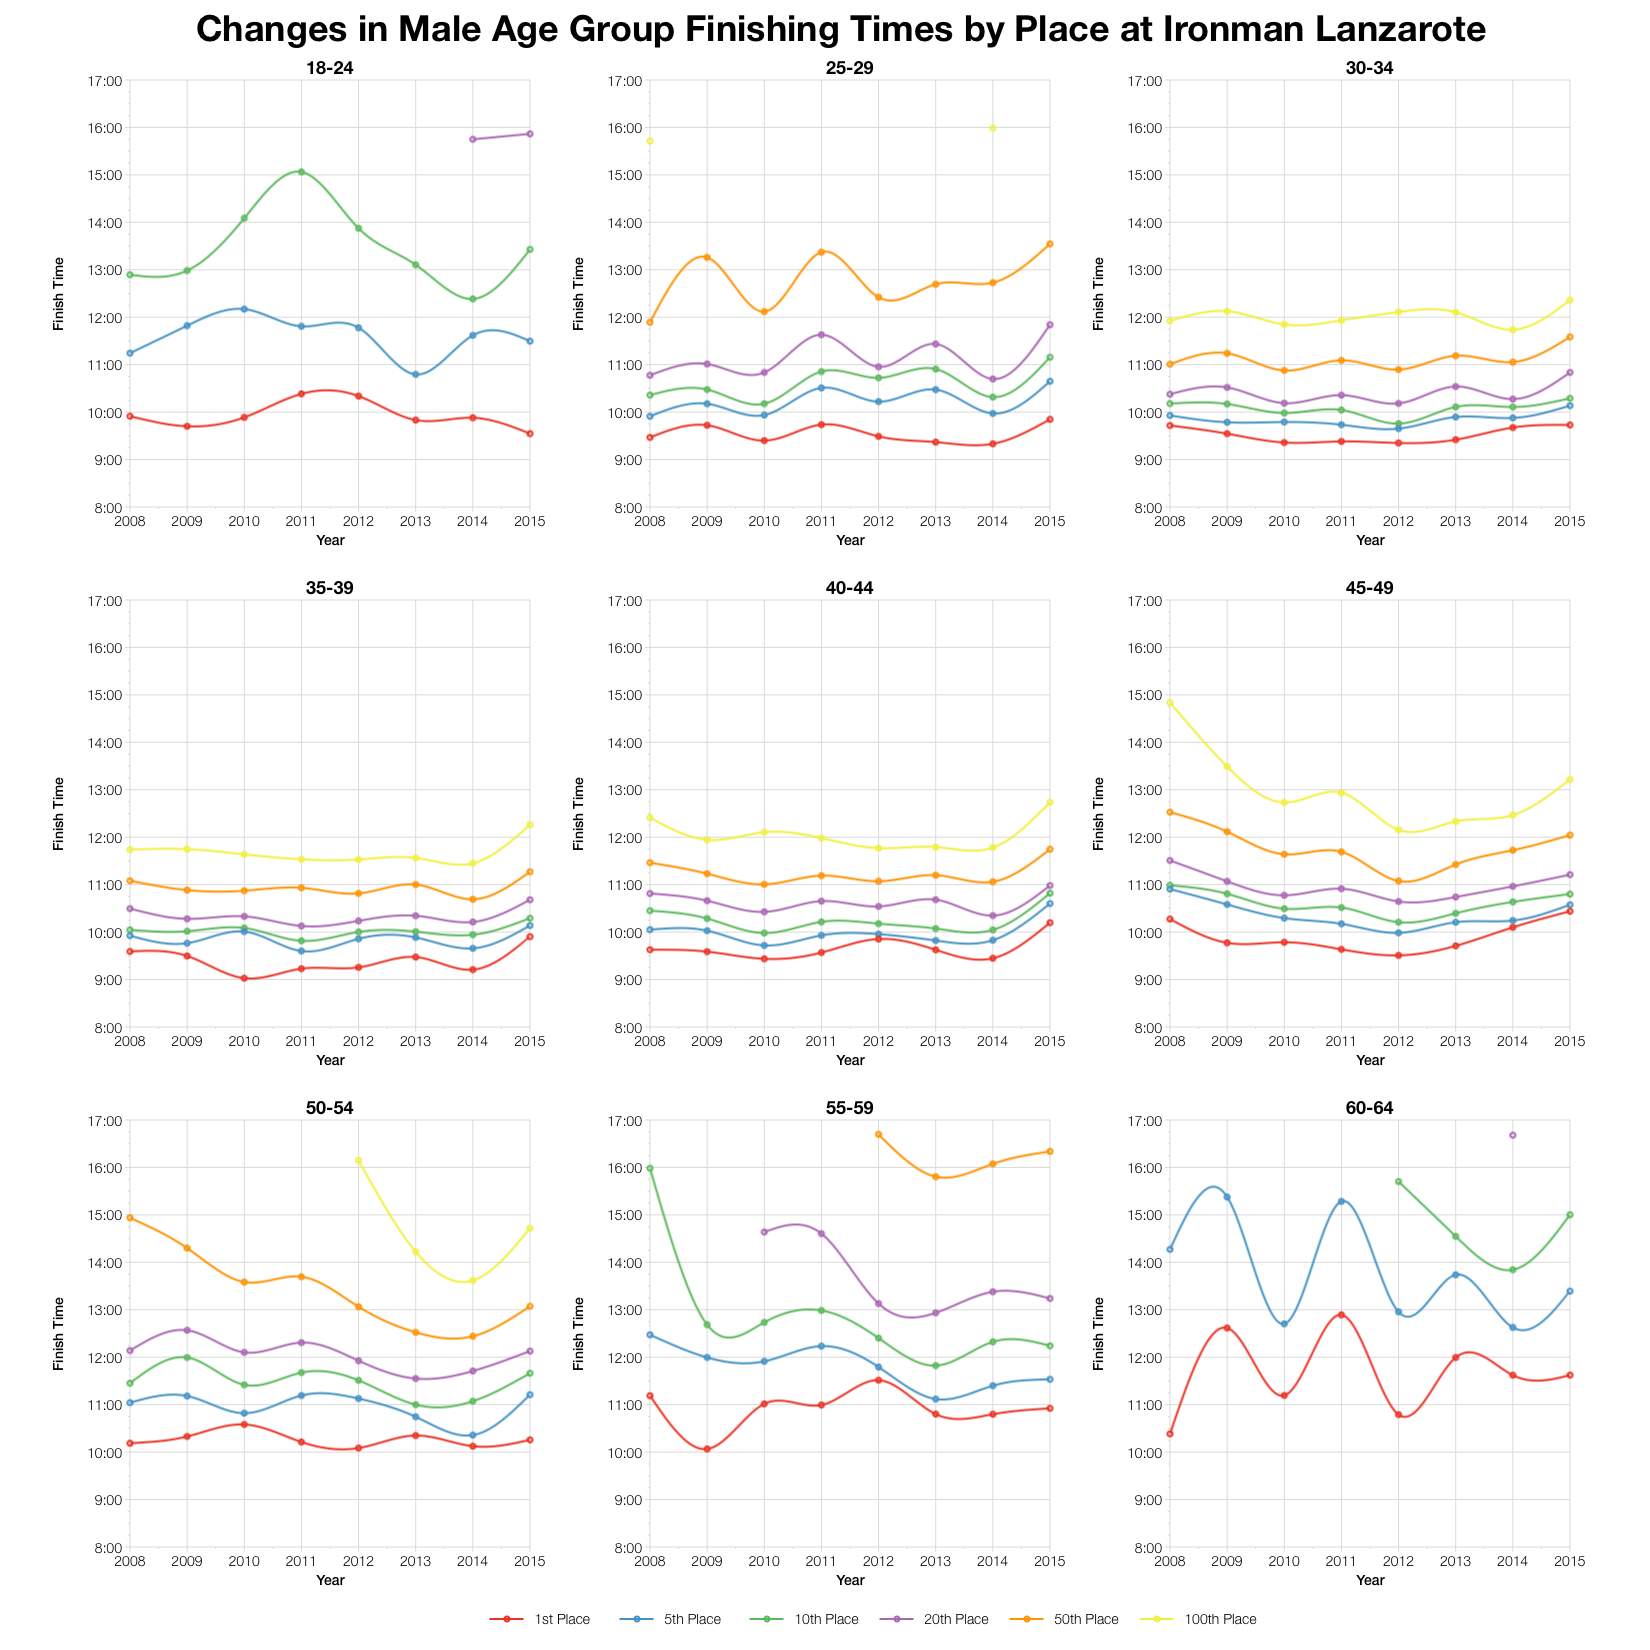
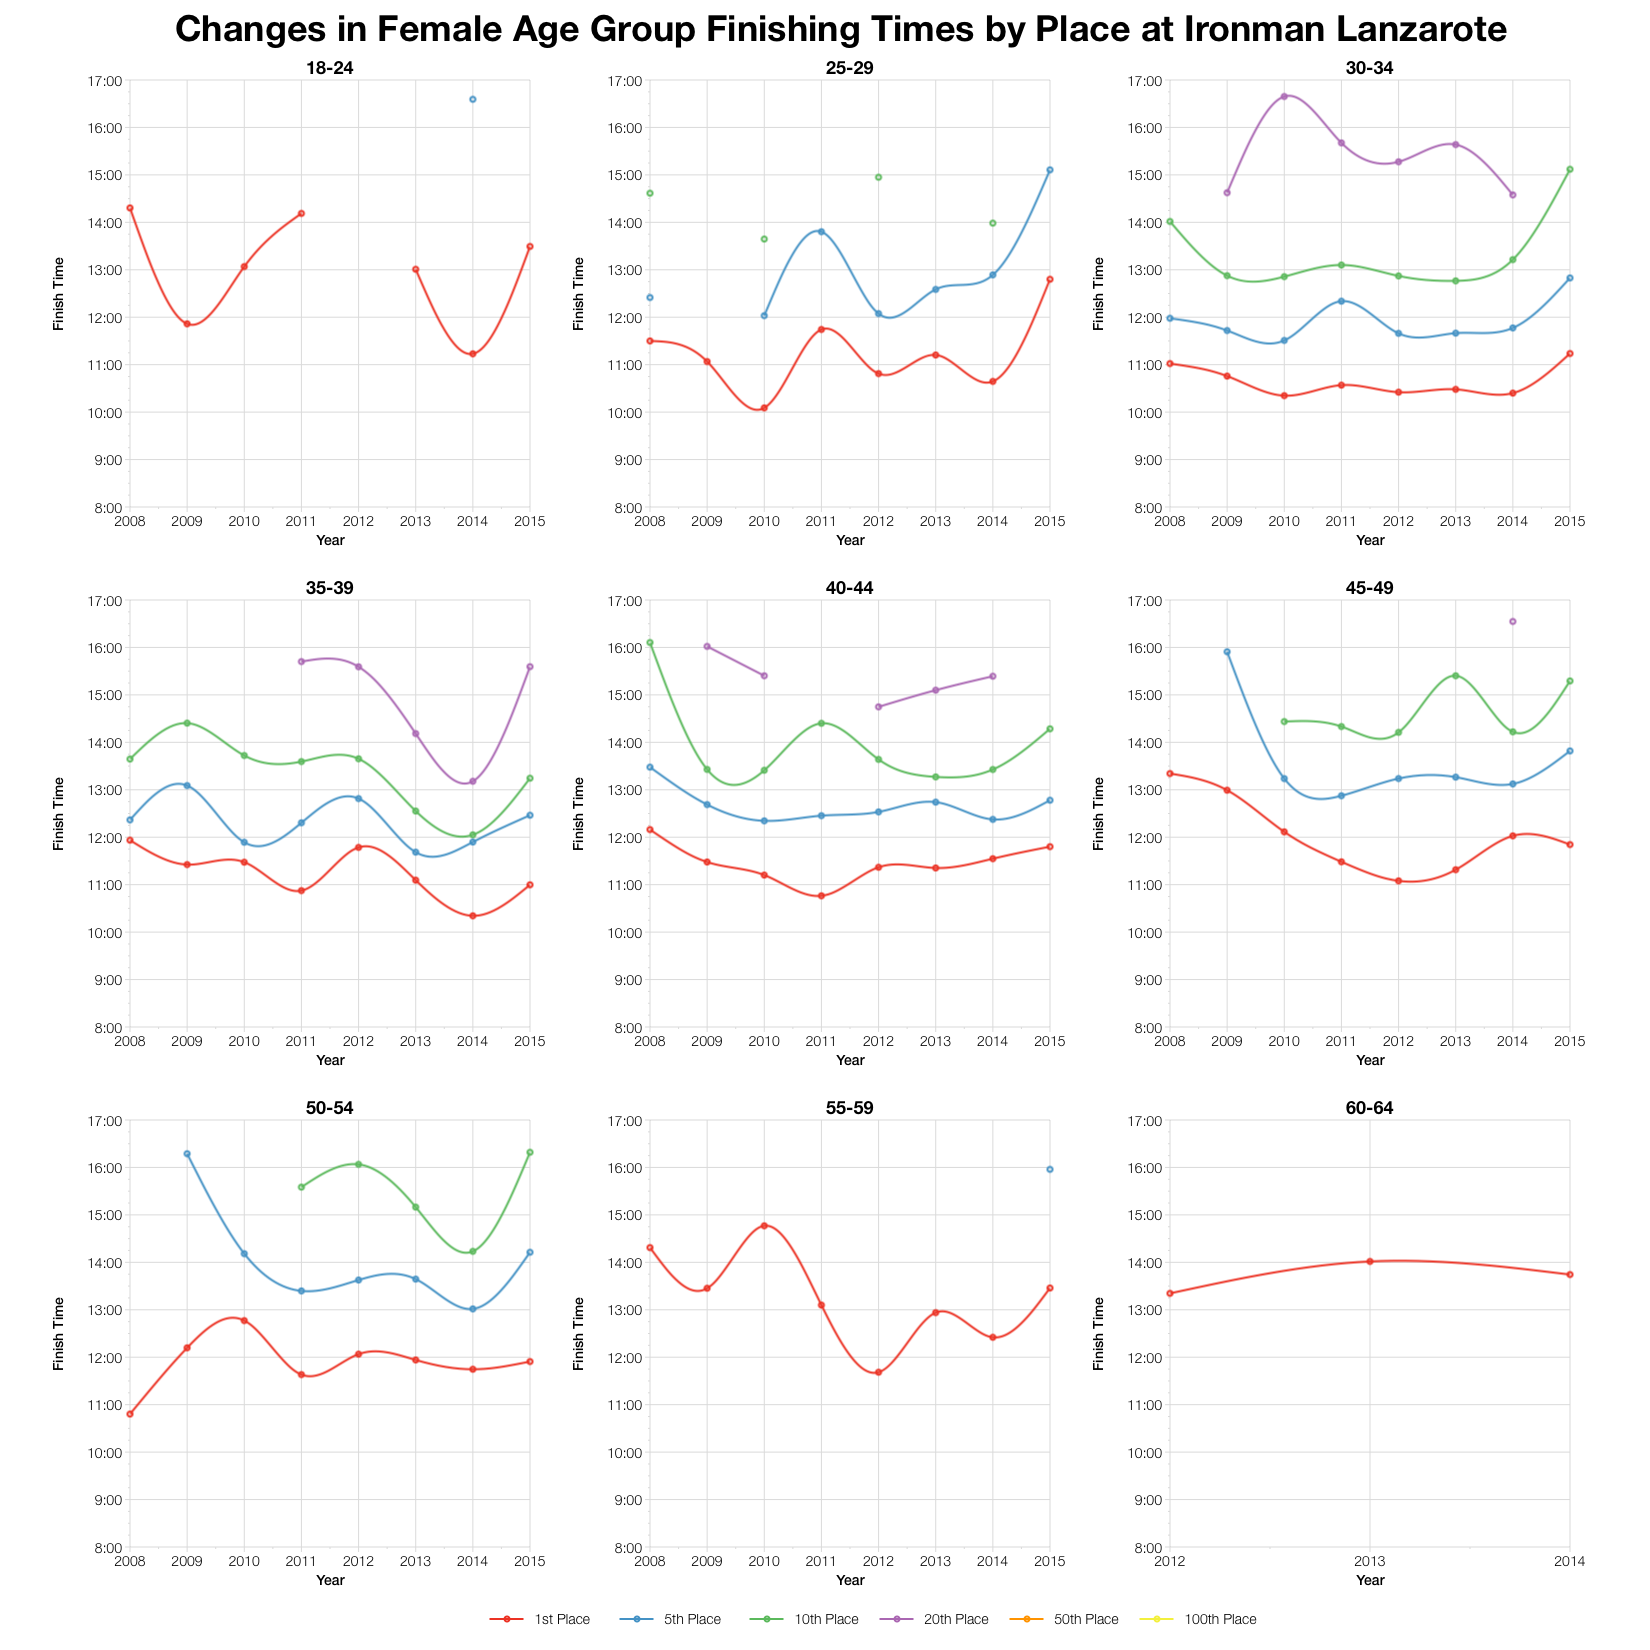
Now for something new. Most of my charts amalgamate results for comparison, but I’m occasionally asked how specific years compare. The two new charts above plot times for athletes in the first, fifth, tenth, twentieth, fiftieth and one hundredth positions of their age group for every year of results I have. This gives some idea how times have changed within those age groups over the last 7 years. I’ll note two things fromm these graphs. Firstly, in relation to this year’s results, what’s clear is the upturn in times that we see under the tough conditions. Secondly, as an aside, there aren’t really obvious trends in age group performance evident in Lanzarote over the last 7 years.
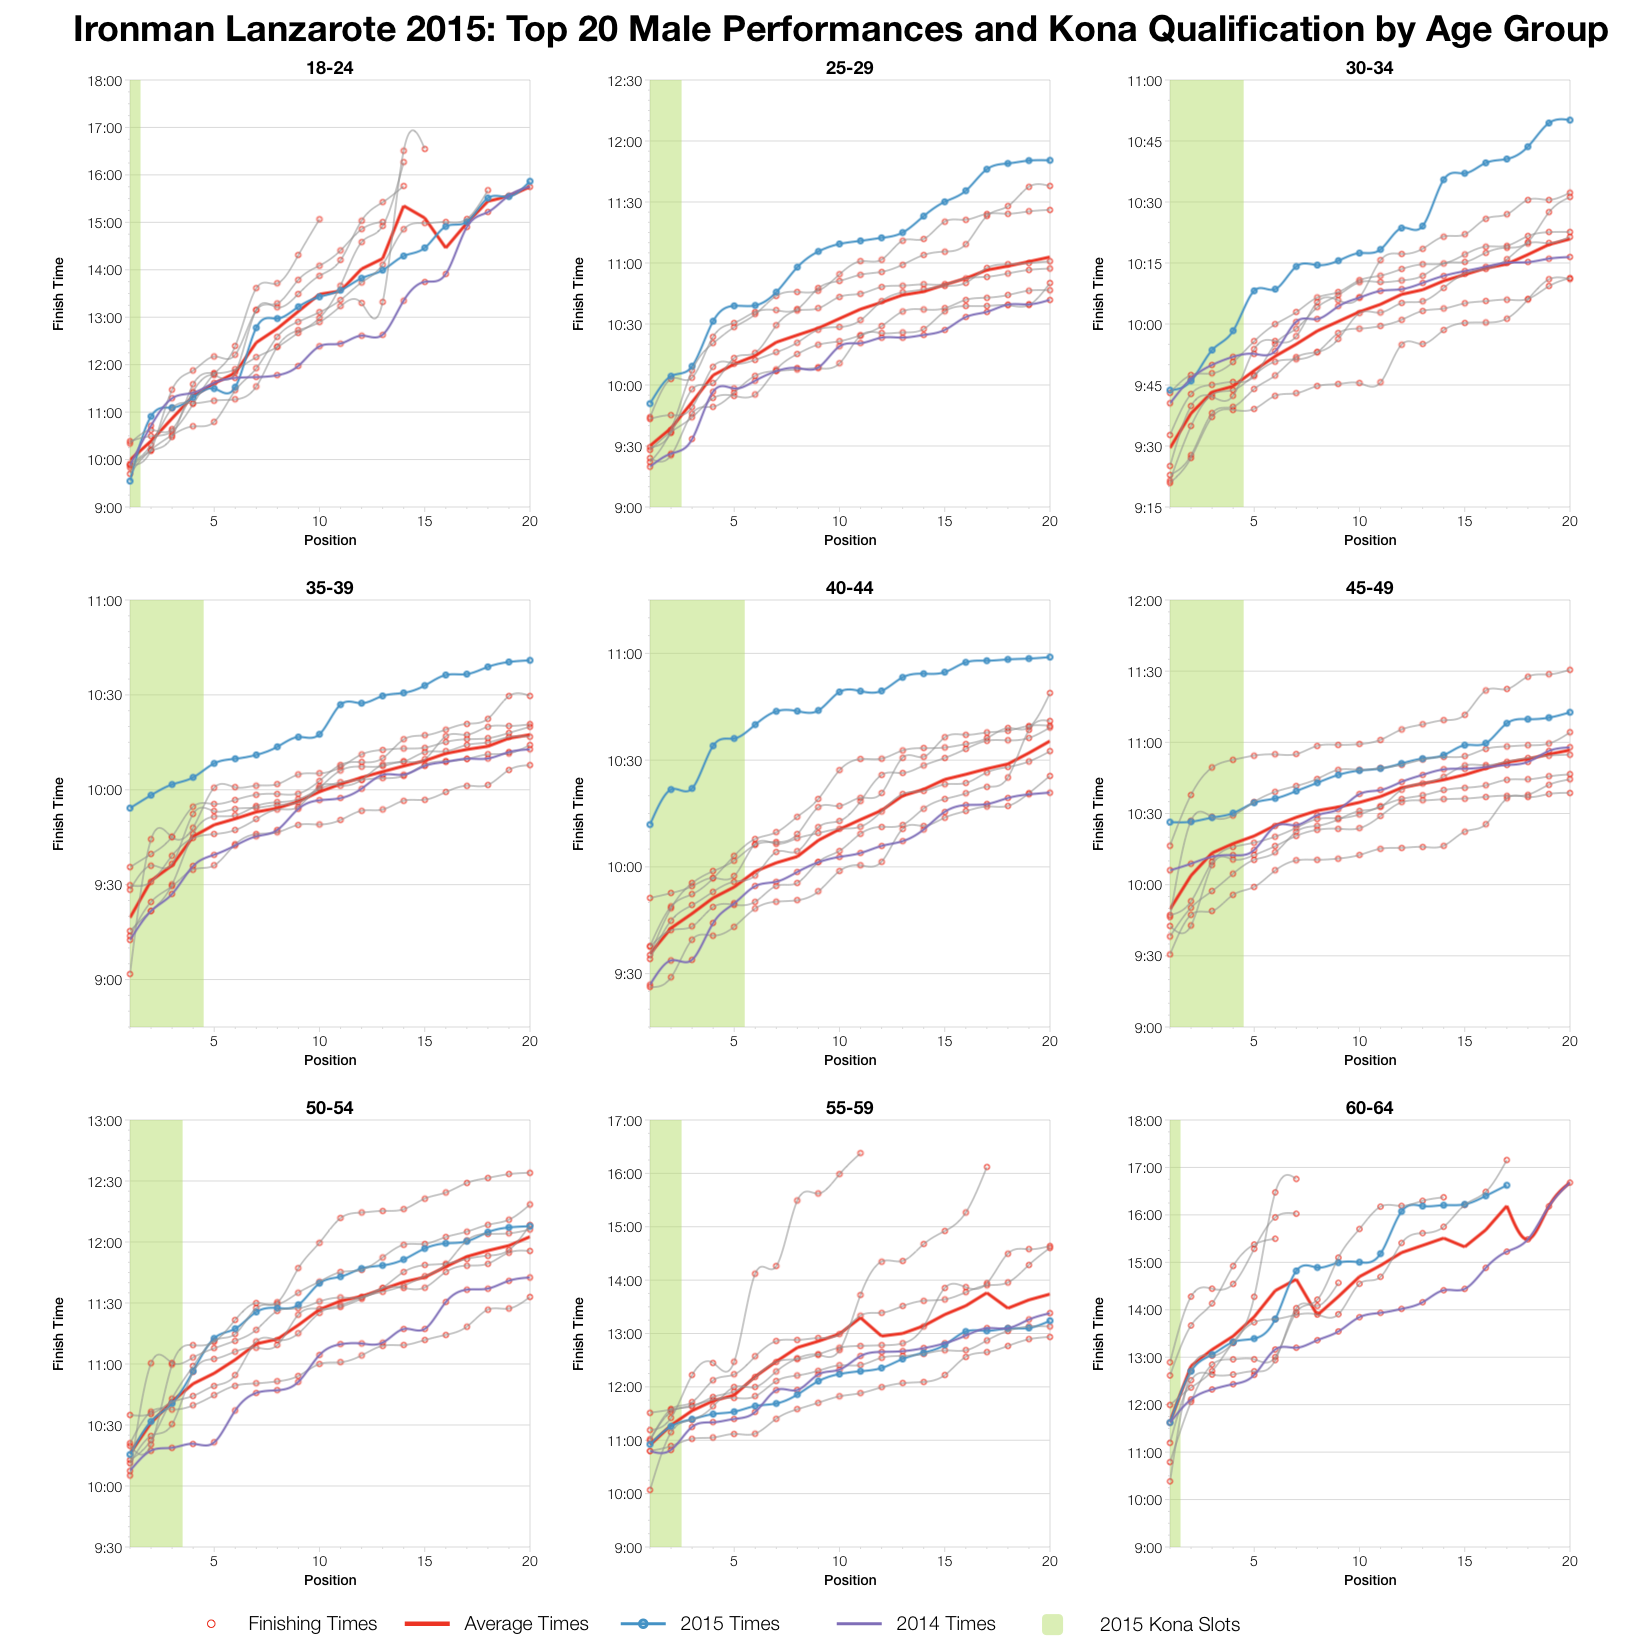
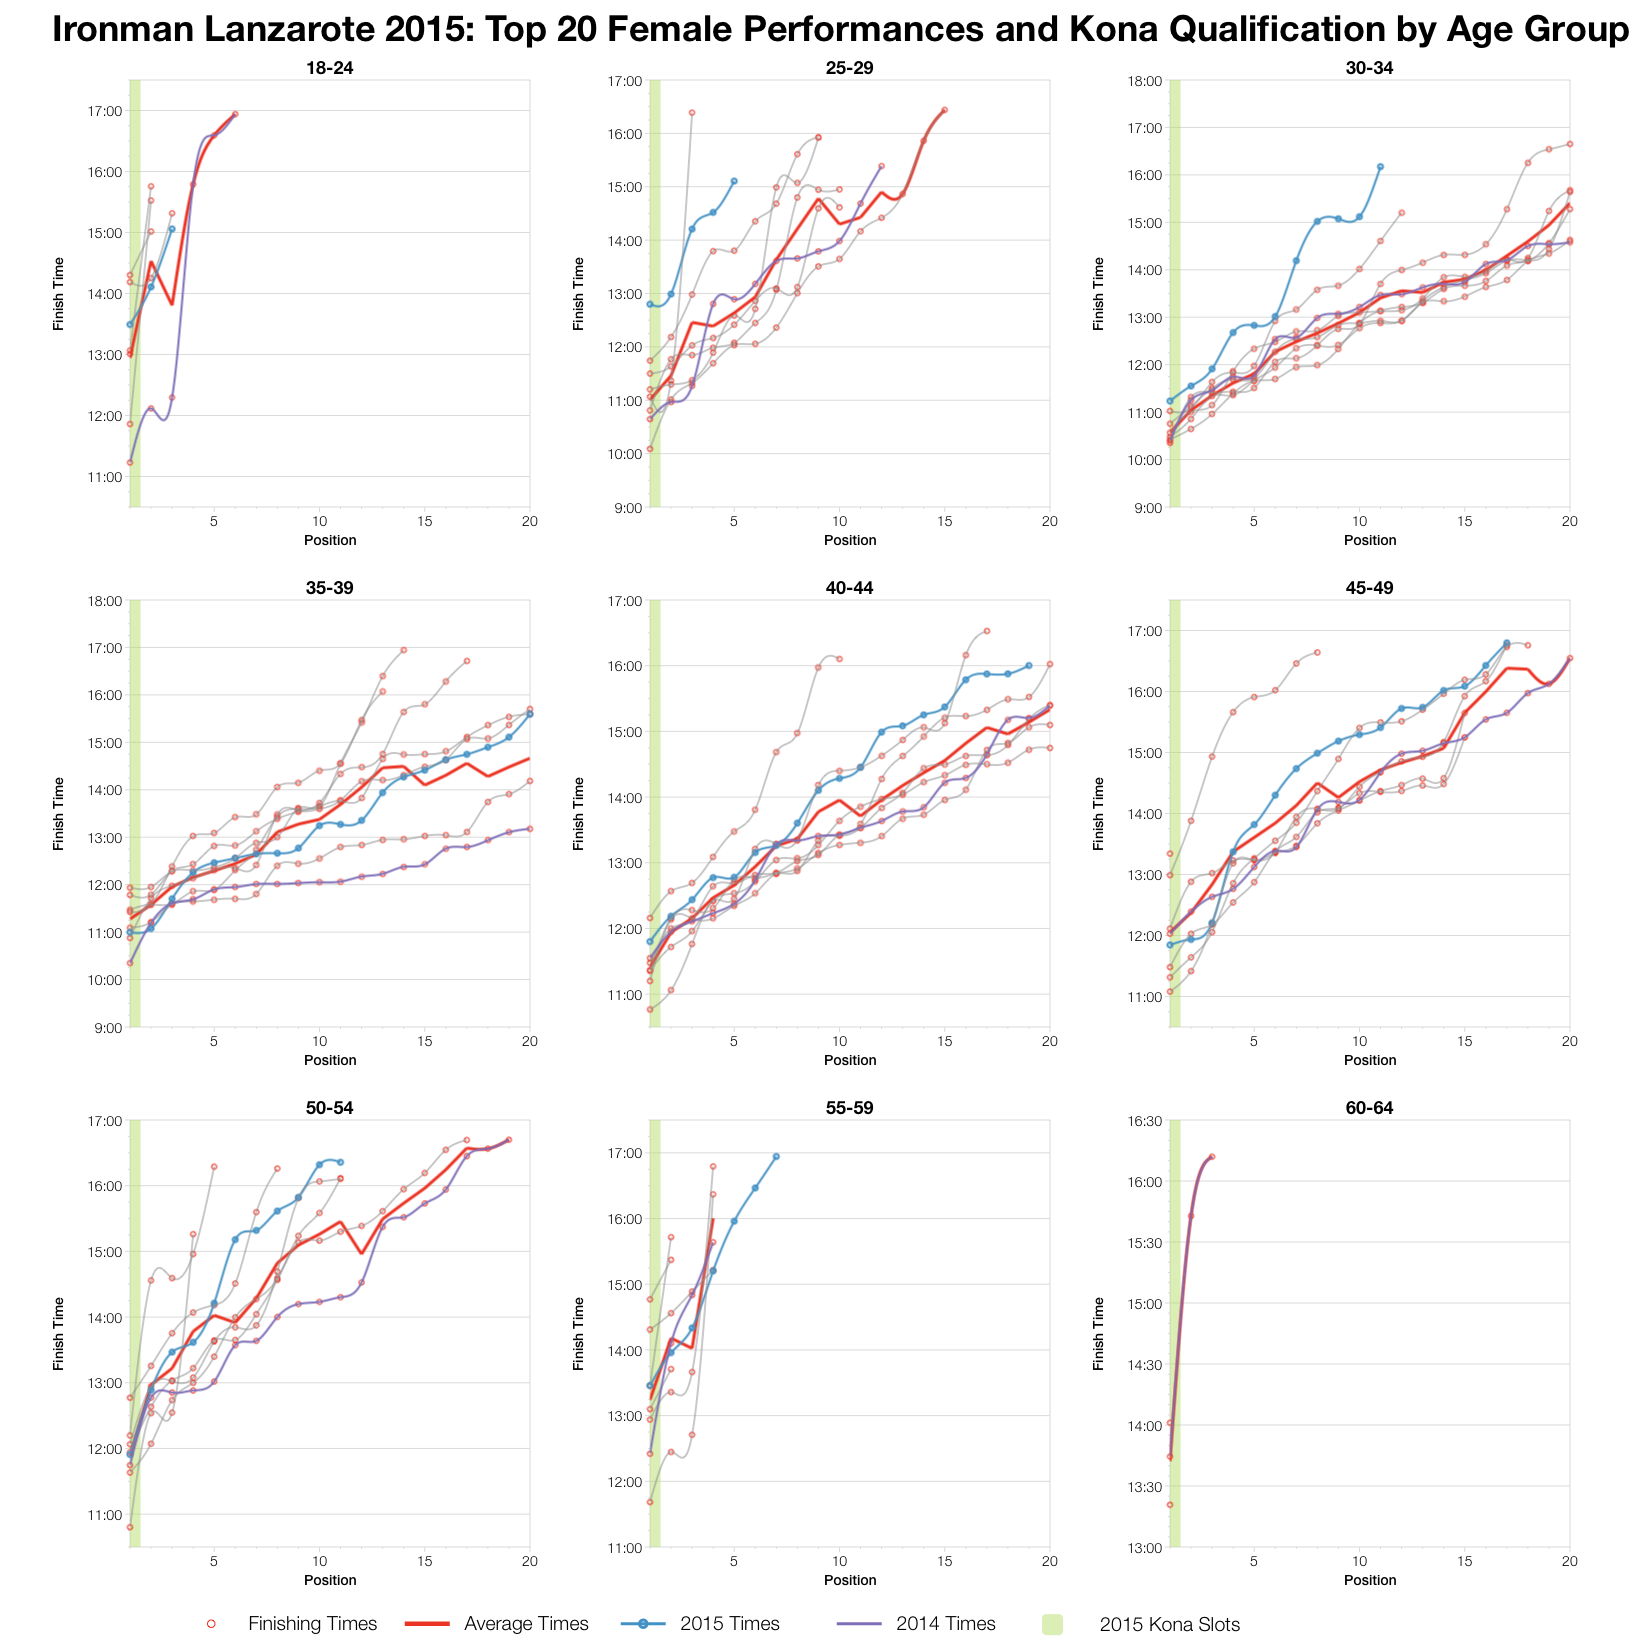
Finally, at the front of the pack we also see slower times. There’s no prize for guessing that. A few age groups do buck the trend and even beat the average; there was, for example, one very fast winner of the male 18-24 category. For the most part though, we see a slower than usual race, in some cases by a big margin. If we went by the male age groups between 25 and 50 then we’d have to conclude this was perhaps the slowest year in the last 7. I can’t say for certain, but it doesn’t seem an unreasonable suggestion.
As usual I’ve put together a spreadsheet version of the full results and splits from Ironman Lanzarote 2015 on my Google Drive.


