It’s going to be hard to compare the results from this year’s Ironman Texas with previous races. There was already a last minute, shortened bike course to deal with, but race day was also interrupted by storms putting pause to the majority of athletes’ races. This is also affecting Kona slots – times for qualification will be based on an earlier timing mat prior to the storm.
As usual I’ve taken times from the Ironman tracker. From what I can see the delay on the run is still included in the run splits. I don’t know the exact timing details that will be used for Kona slots though, so my Kona slot estimates will work from finishing splits as normal. It looks like a good number of qualifiers may have finished before the storm hit anyway.
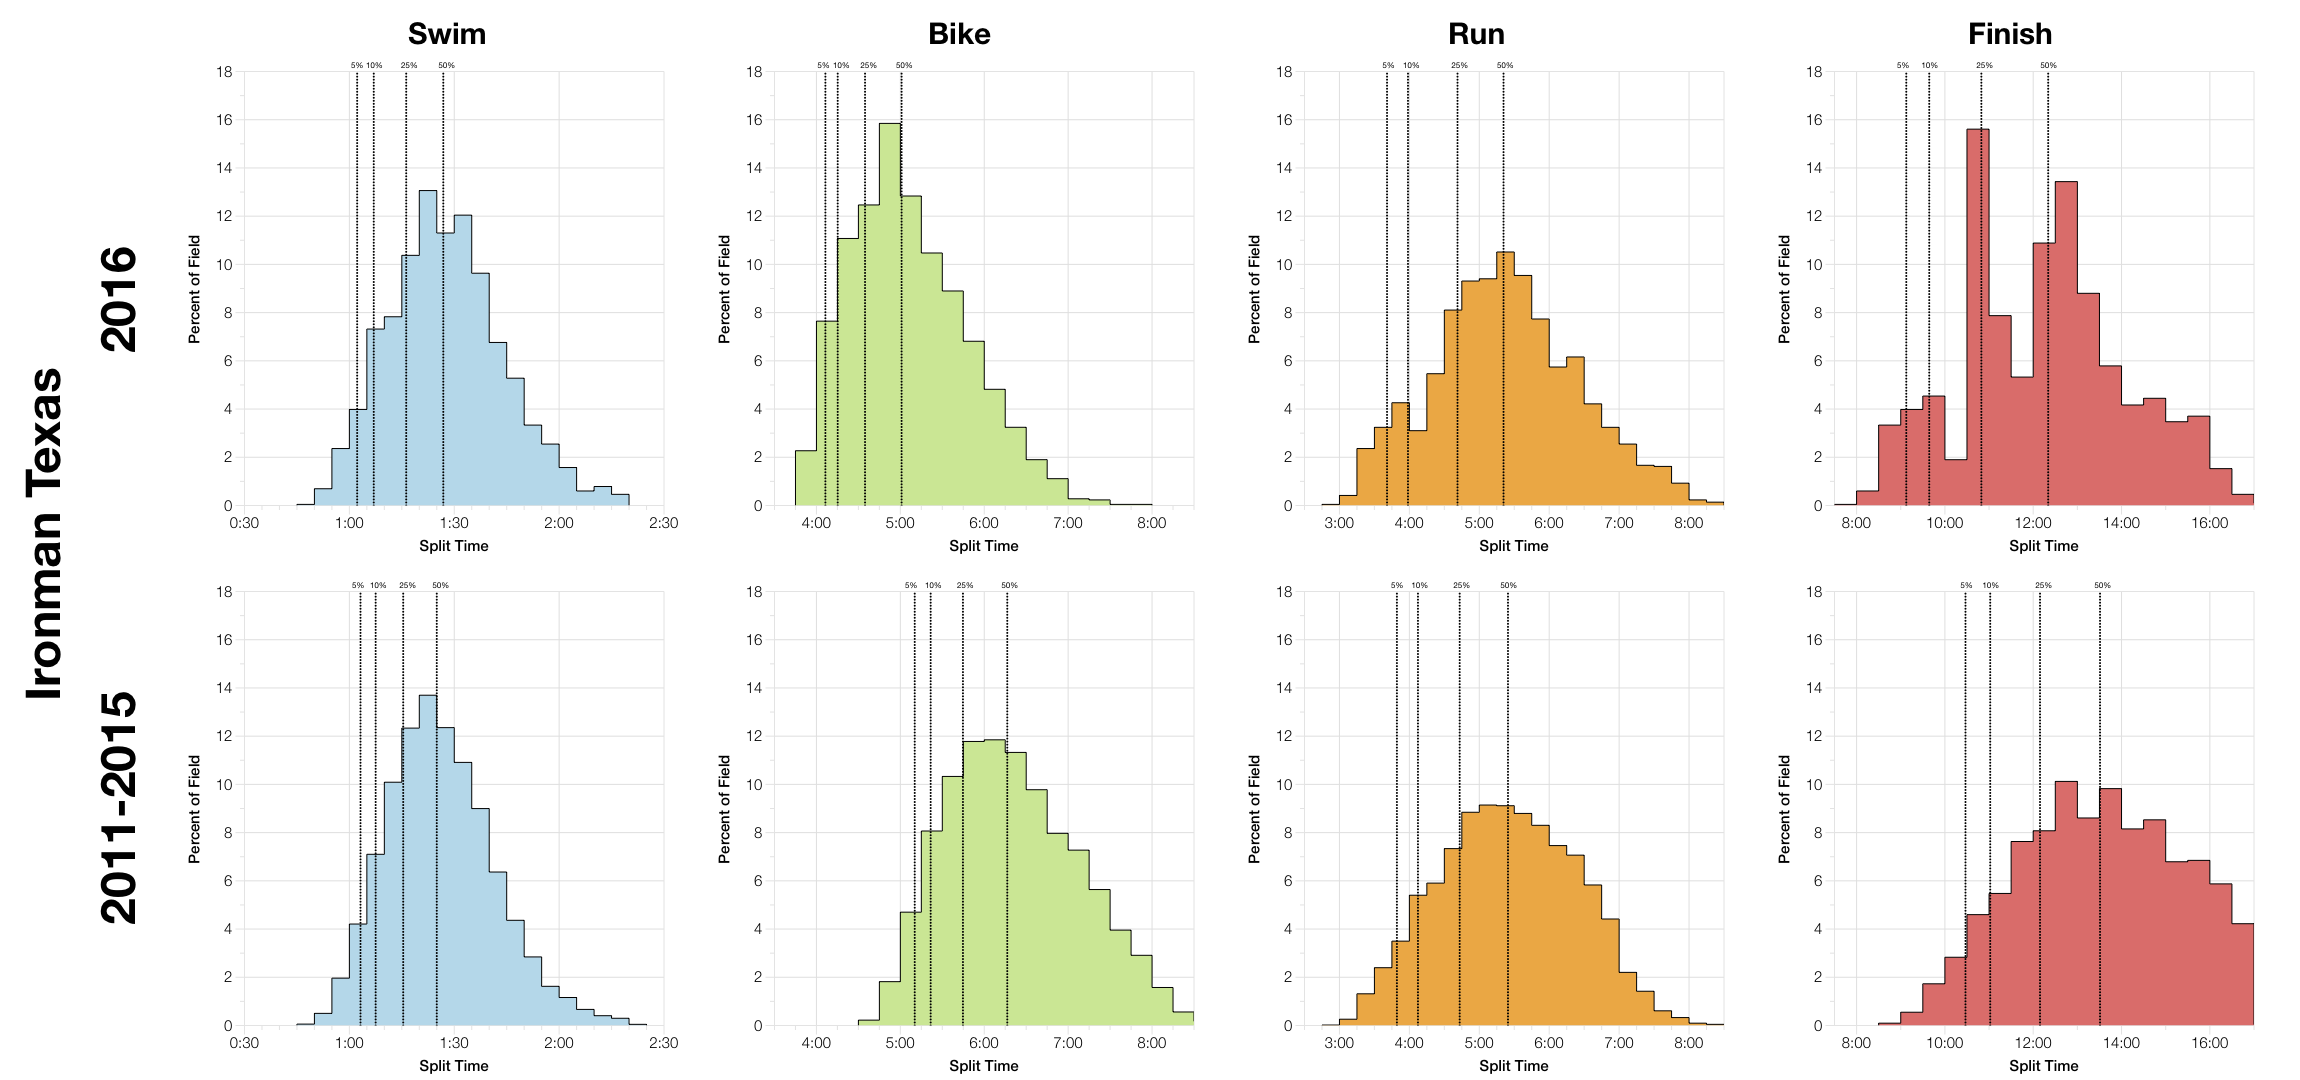
There are two key differences this year. The shortened bike naturally means significantly faster times at this year’s race. I’d normally expect a faster run after a short bike, but this is countered by race delays during the run. As it happens this year’s run still trend slightly faster than the aggregate distribution. Perhaps the more interesting feature is a dip around the 4:00 hour mark. This is likely the impact of the storm – those coming in under this managed to run through largely uninterrupted, those coming later experienced delays.
Overall the race trends a lot faster than the aggregate data – the shortened bike had a huge impact. There are breaks in this distribution too, again likely to be a reflection of the interruptions to race day.
| Listed Athletes | Swim Finish | Swim DNS/DNF | Bike Finish | Bike DNF | Run Finish | Run DNF | Overall DNS/DNF | |
|---|---|---|---|---|---|---|---|---|
| 2011 | 2658 | 2157 | 18.8% | 2119 | 1.8% | 2004 | 5.4% | 24.6% |
| 2012 | 2755 | 2270 | 17.6% | 2177 | 4.1% | 2022 | 7.1% | 26.6% |
| 2013 | 2814 | 2408 | 14.4% | 2268 | 5.8% | 2052 | 9.5% | 27% |
| 2014 | 2438 | 2393 | 1.8% | 2322 | 3% | 2203 | 5.1% | 9.5% |
| 2015 | 2588 | 2532 | 2.2% | 2450 | 3.2% | 2239 | 8.6% | 13.5% |
| 2016 | 3031 | 2334 | 23% | 2288 | 2% | 2213 | 3.3% | 27.1% |
The DNF/DNS rate for this race is remarkably unaffected by the storms too. In fact run DNFs appear to be the lowest seen. The overall DNF rate is also comparable with previous years. I’ll note here that it’s clear the tracking data has varied a little over the years with 2014 and 2015 trackers excluding DNS athletes (hence the significantly lower figures for swim and overall). The swim DNF/DNS figures are higher than previous results – I expect DNS rates were higher following the confusion over the race course and the storm warnings.

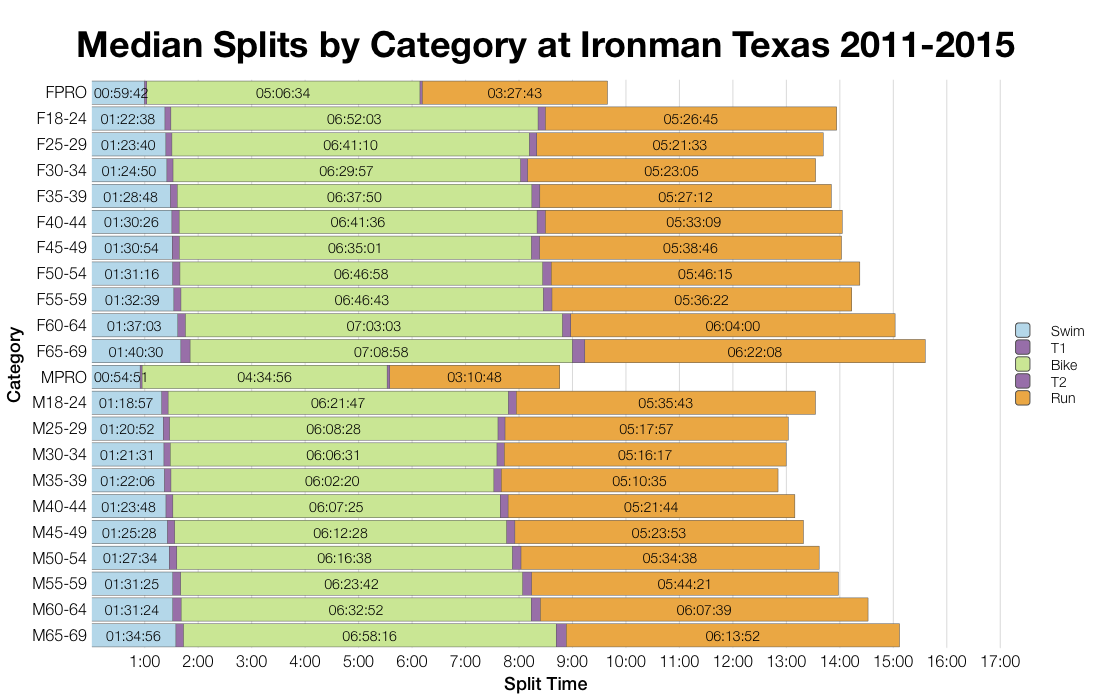
Breaking down into age groups and comparing medians shows us the same patterns as the distributions. Swim times largely the same, but bike and run times faster. The bike by a considerable margin of course.
| Count | Percentage | |
|---|---|---|
| United States | 2314 | 76.3 |
| Mexico | 129 | 4.3 |
| Canada | 99 | 3.3 |
| United Kingdom | 61 | 2 |
| Argentinia | 41 | 1.4 |
| Venezuela | 30 | 1 |
| Brazil | 27 | 0.9 |
| Colombia | 25 | 0.8 |
| Germany | 23 | 0.8 |
| Ecuador | 19 | 0.6 |
Unsurprisingly the majority of athletes at Texas came from the US. The distribution is more diverse than Ironman Australia, but will not match the European races. It’s obvious that travel largely determines these distributions, even for Championship races.
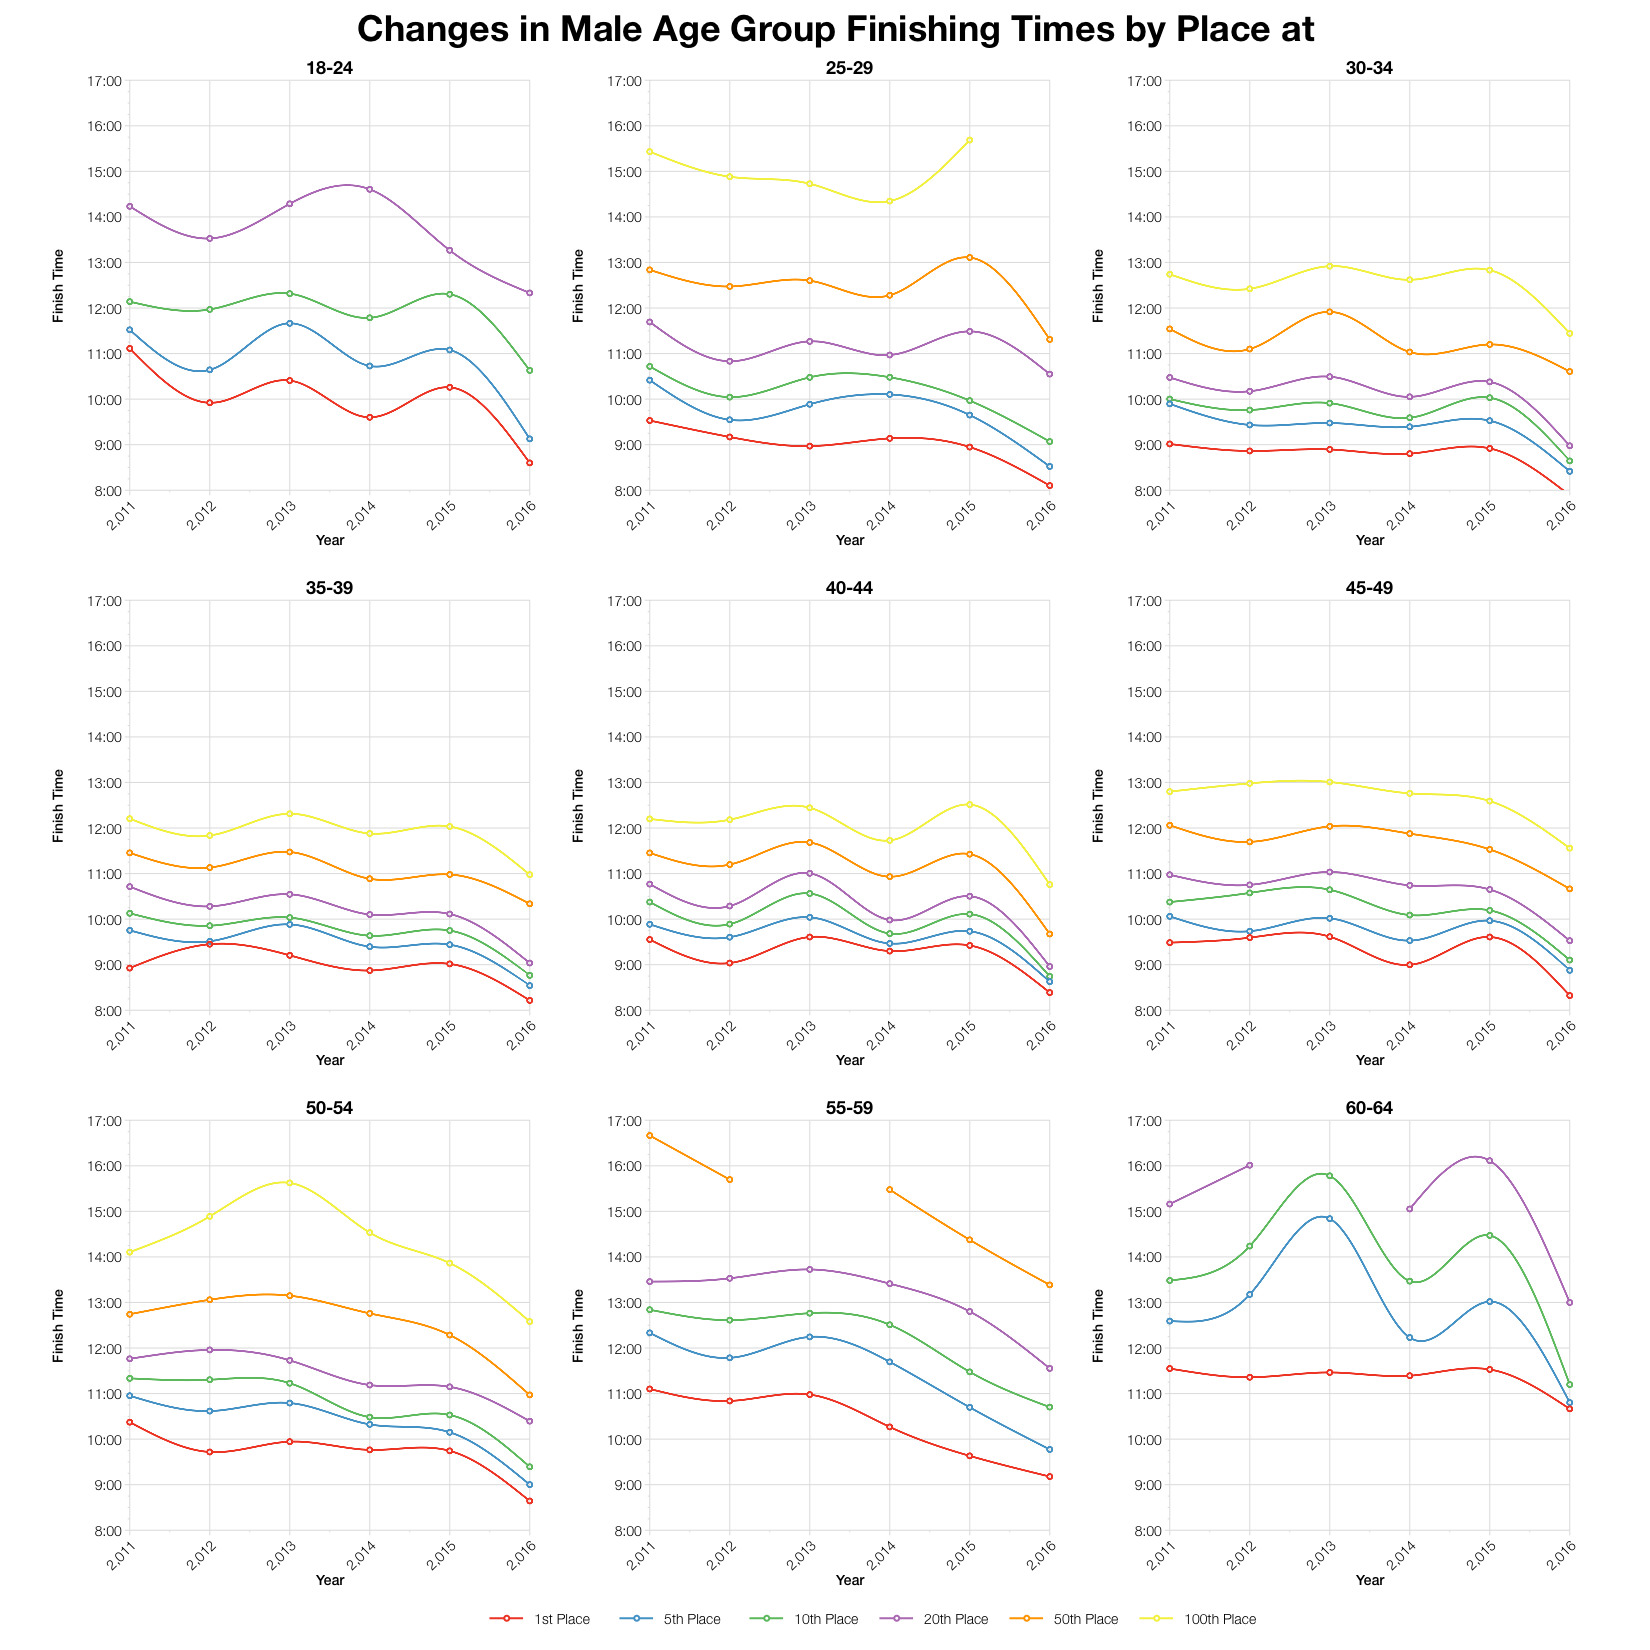
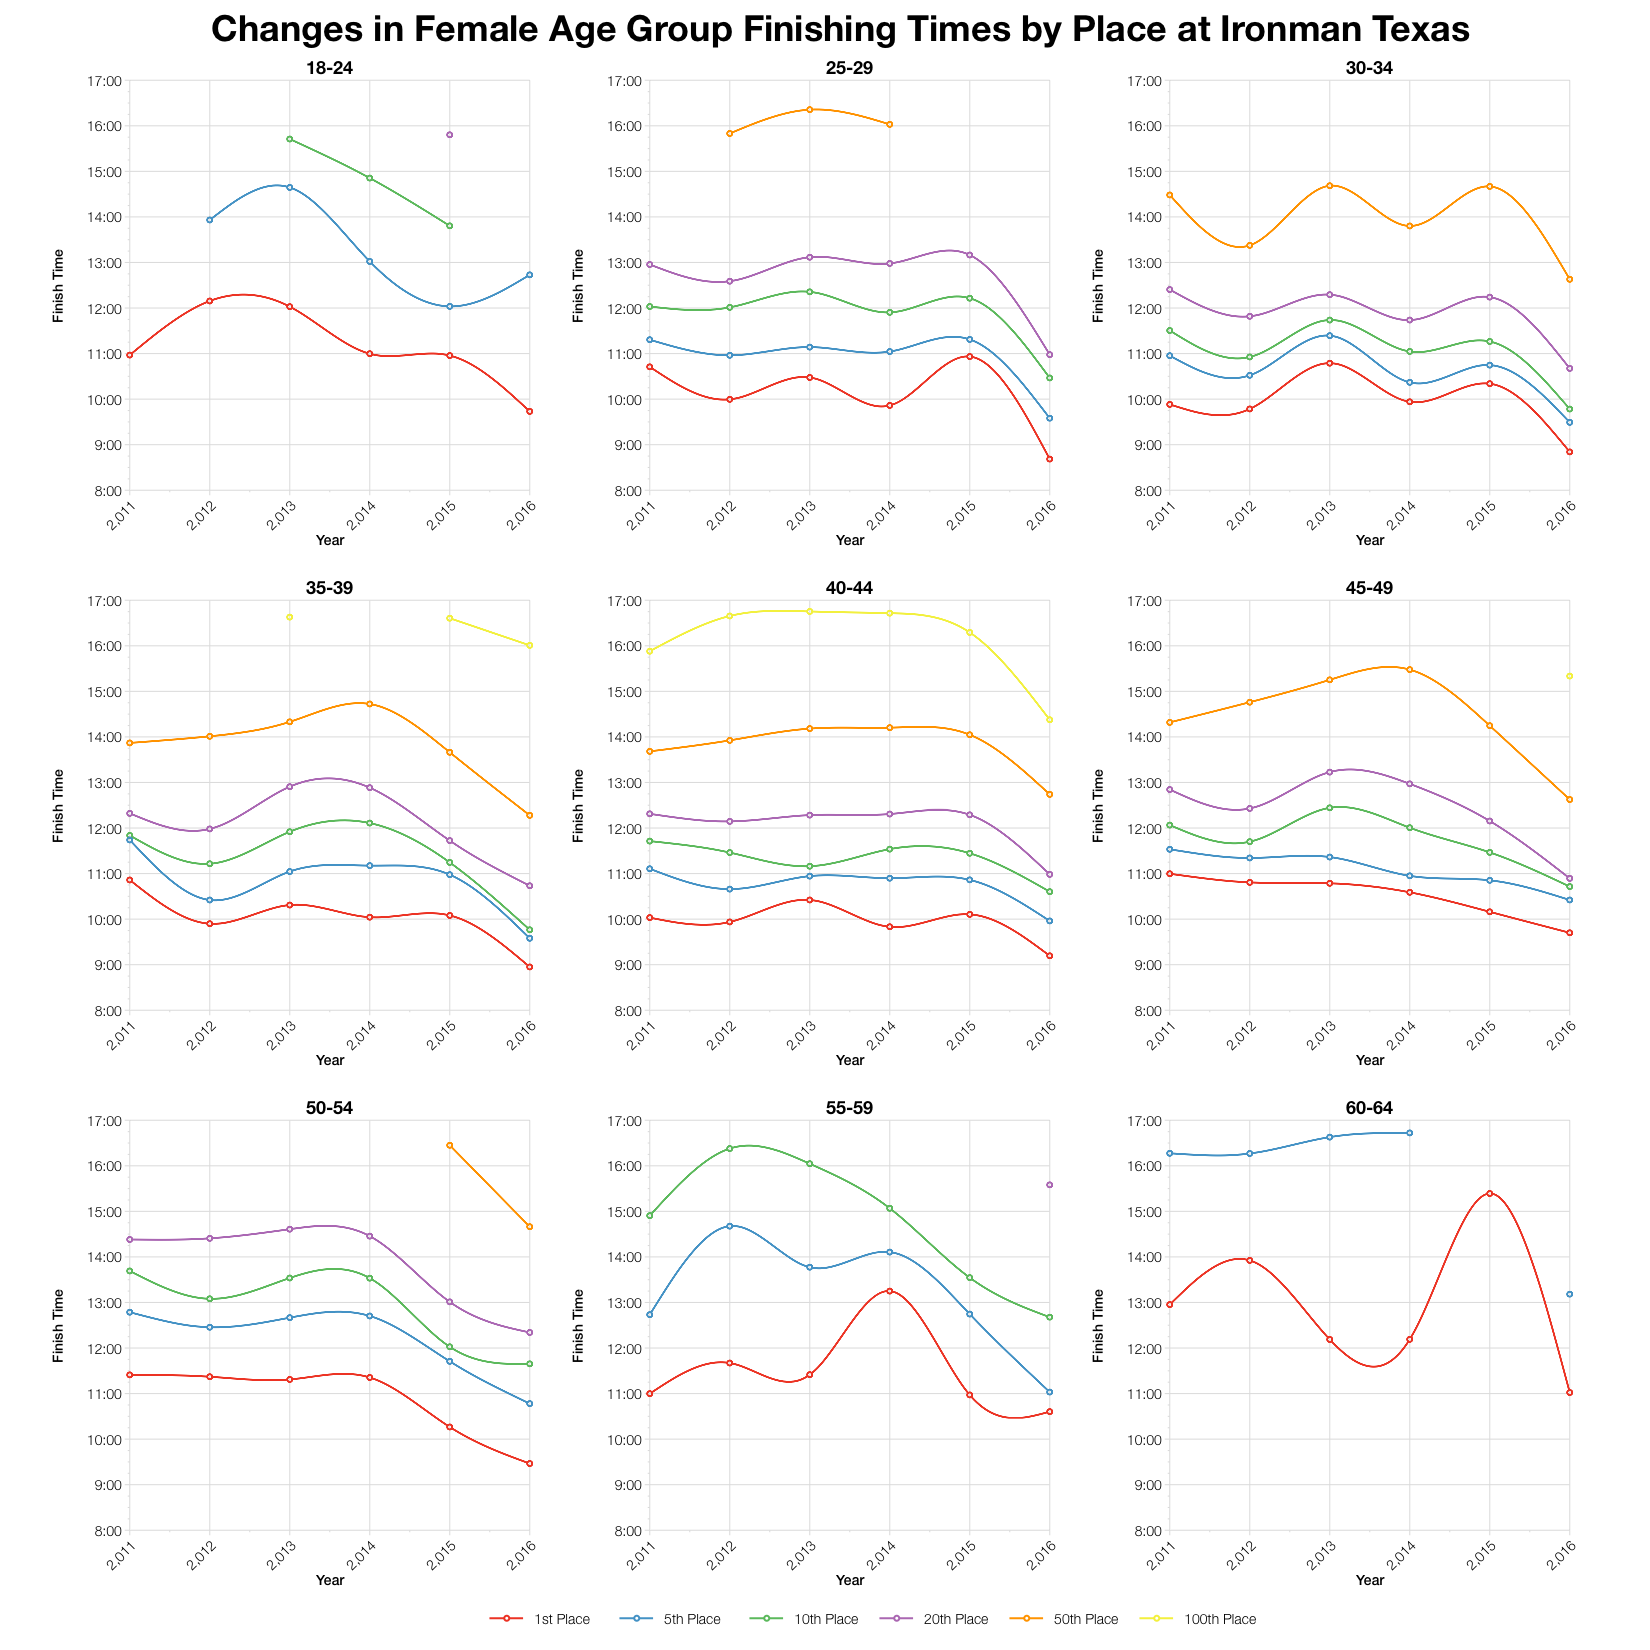
Results for the previous 5 years of racing have been pretty consistent over age groups and placings. This year trends faster in almost every case. A shortened bike course has a huge impact.
| Slots | Winner | Average Kona Qualifier | Final Qualifier | |
|---|---|---|---|---|
| M18-24 | 2 | 8:35:59 | 8:40:50 | 8:45:41 |
| M25-29 | 3 | 8:06:09 | 8:07:37 | 8:09:45 |
| M30-34 | 5 | 7:53:17 | 8:13:32 | 8:24:55 |
| M35-39 | 8 | 8:12:58 | 8:31:57 | 8:45:35 |
| M40-44 | 10 | 8:23:16 | 8:37:32 | 8:44:34 |
| M45-49 | 8 | 8:19:20 | 8:48:11 | 9:00:40 |
| M50-54 | 6 | 8:38:33 | 8:56:19 | 9:13:12 |
| M55-59 | 3 | 9:10:42 | 9:22:40 | 9:35:43 |
| M60-64 | 2 | 10:39:52 | 10:40:36 | 10:41:20 |
| M65-69 | 1 | 10:04:45 | 10:04:45 | 10:04:45 |
| M70-74 | 1 | 12:26:23 | 12:26:23 | 12:26:23 |
| M75-79 | 1 | 16:00:07 | 16:00:07 | 16:00:07 |
| F18-24 | 1 | 9:43:51 | 9:43:51 | 9:43:51 |
| F25-29 | 2 | 8:41:02 | 8:44:35 | 8:48:08 |
| F30-34 | 3 | 8:50:29 | 8:55:48 | 9:02:08 |
| F35-39 | 3 | 8:57:00 | 9:08:40 | 9:15:30 |
| F40-44 | 4 | 9:11:42 | 9:29:48 | 9:45:43 |
| F45-49 | 3 | 9:42:01 | 9:44:29 | 9:47:29 |
| F50-54 | 3 | 9:27:50 | 9:53:39 | 10:29:54 |
| F55-59 | 2 | 10:36:12 | 10:37:07 | 10:38:03 |
| F60-64 | 1 | 11:01:24 | 11:01:24 | 11:01:24 |
| F65-69 | 1 | 12:35:07 | 12:35:07 | 12:35:07 |
Based on my estimation of slot allocation and the finishing times at yesterday’s race the table above gives a rough guide to qualification times. Clearly, they’re a lot faster than normal for this race with sub-9:00 being required in the major male age groups. You can compare on my 2016 Kona Qualification Page. The shortened bike is probably worth close to an hour over normal race times.
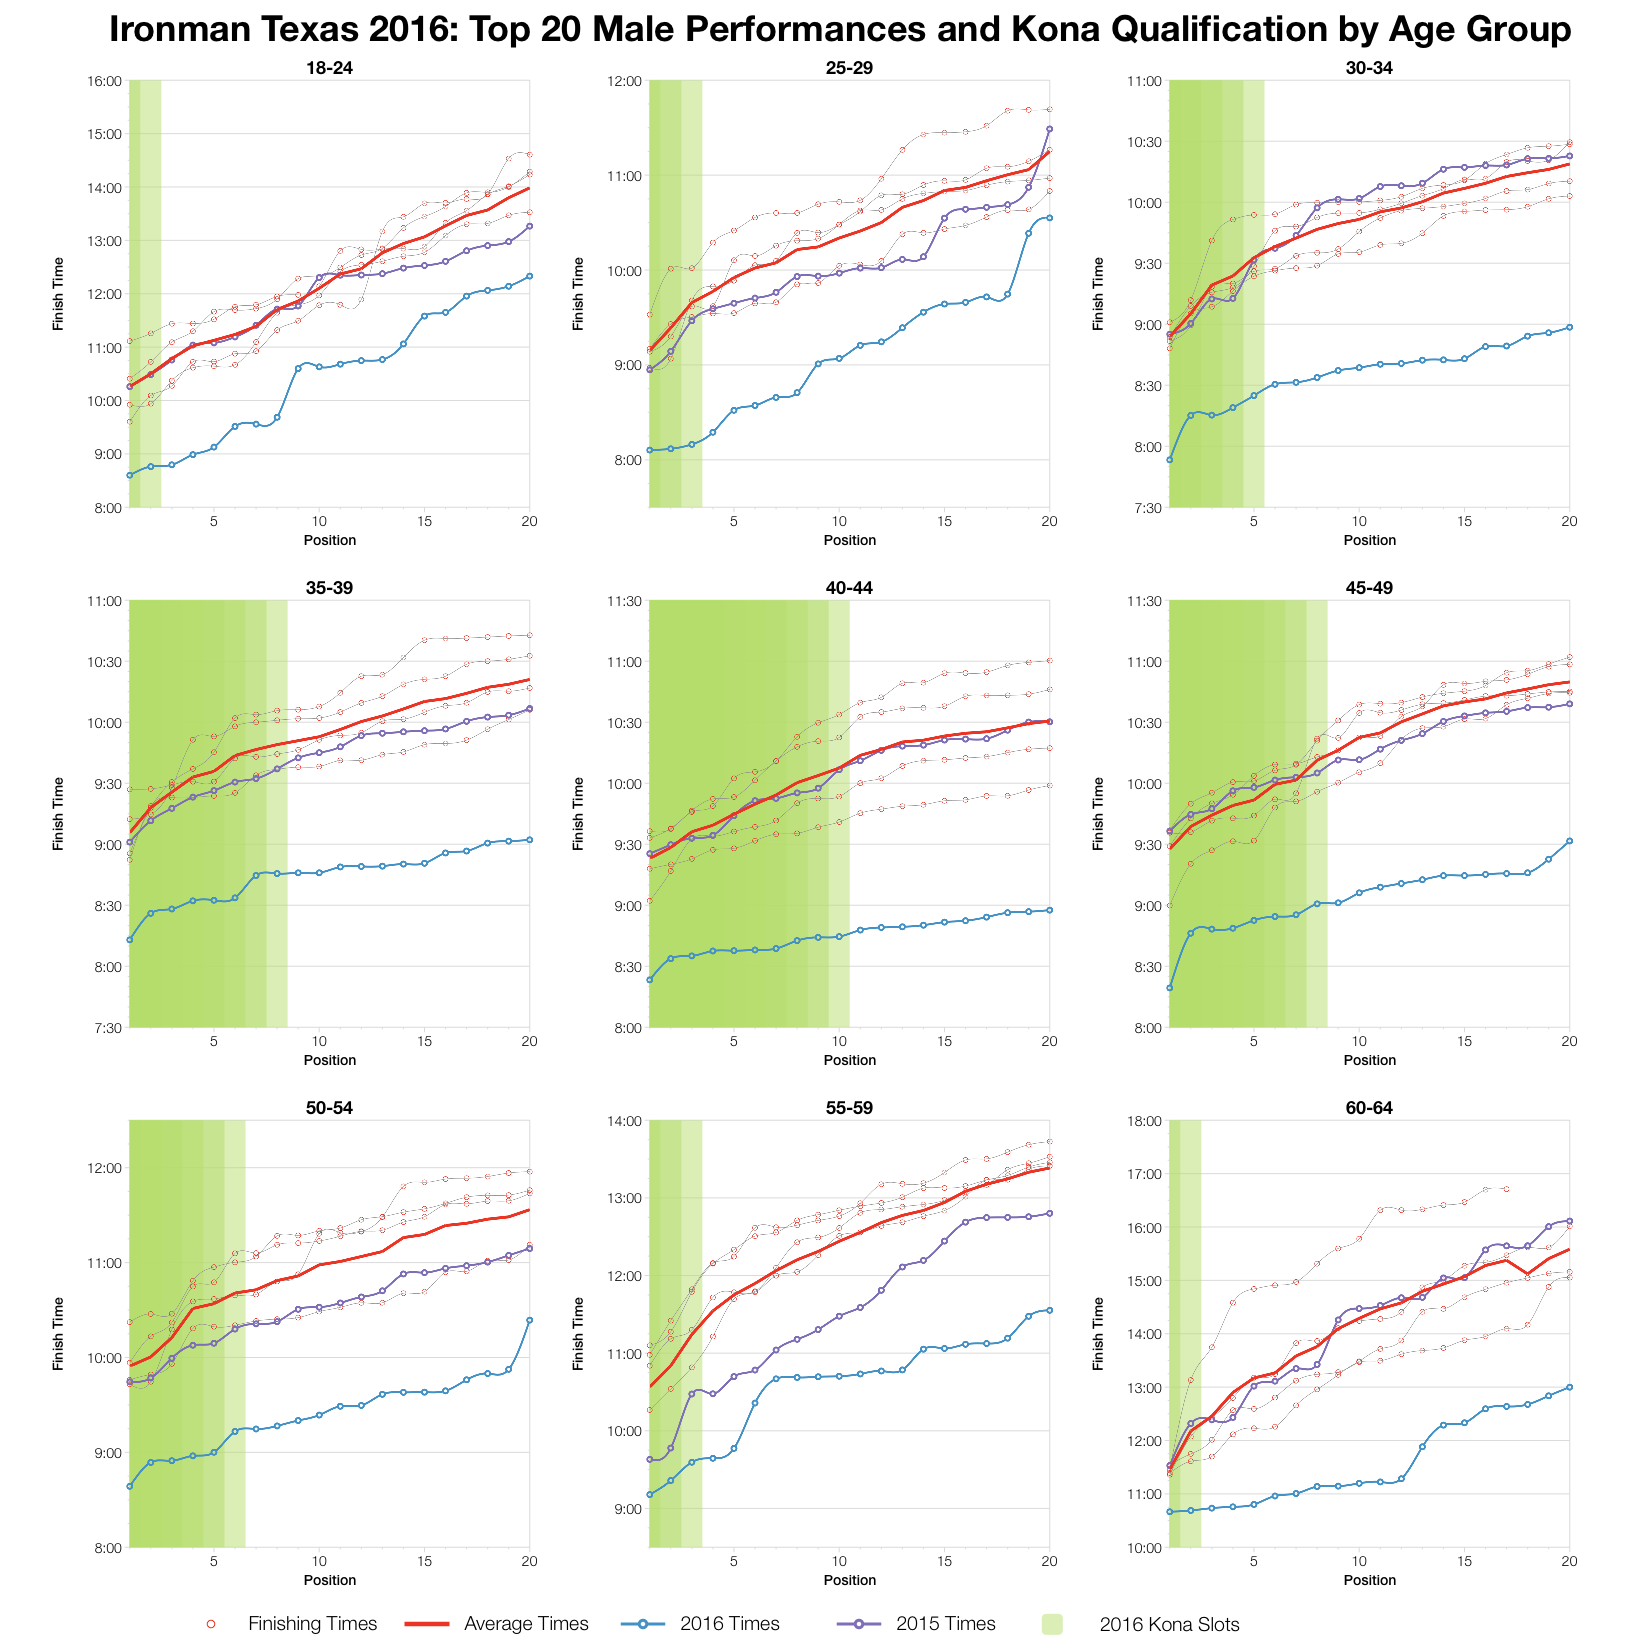
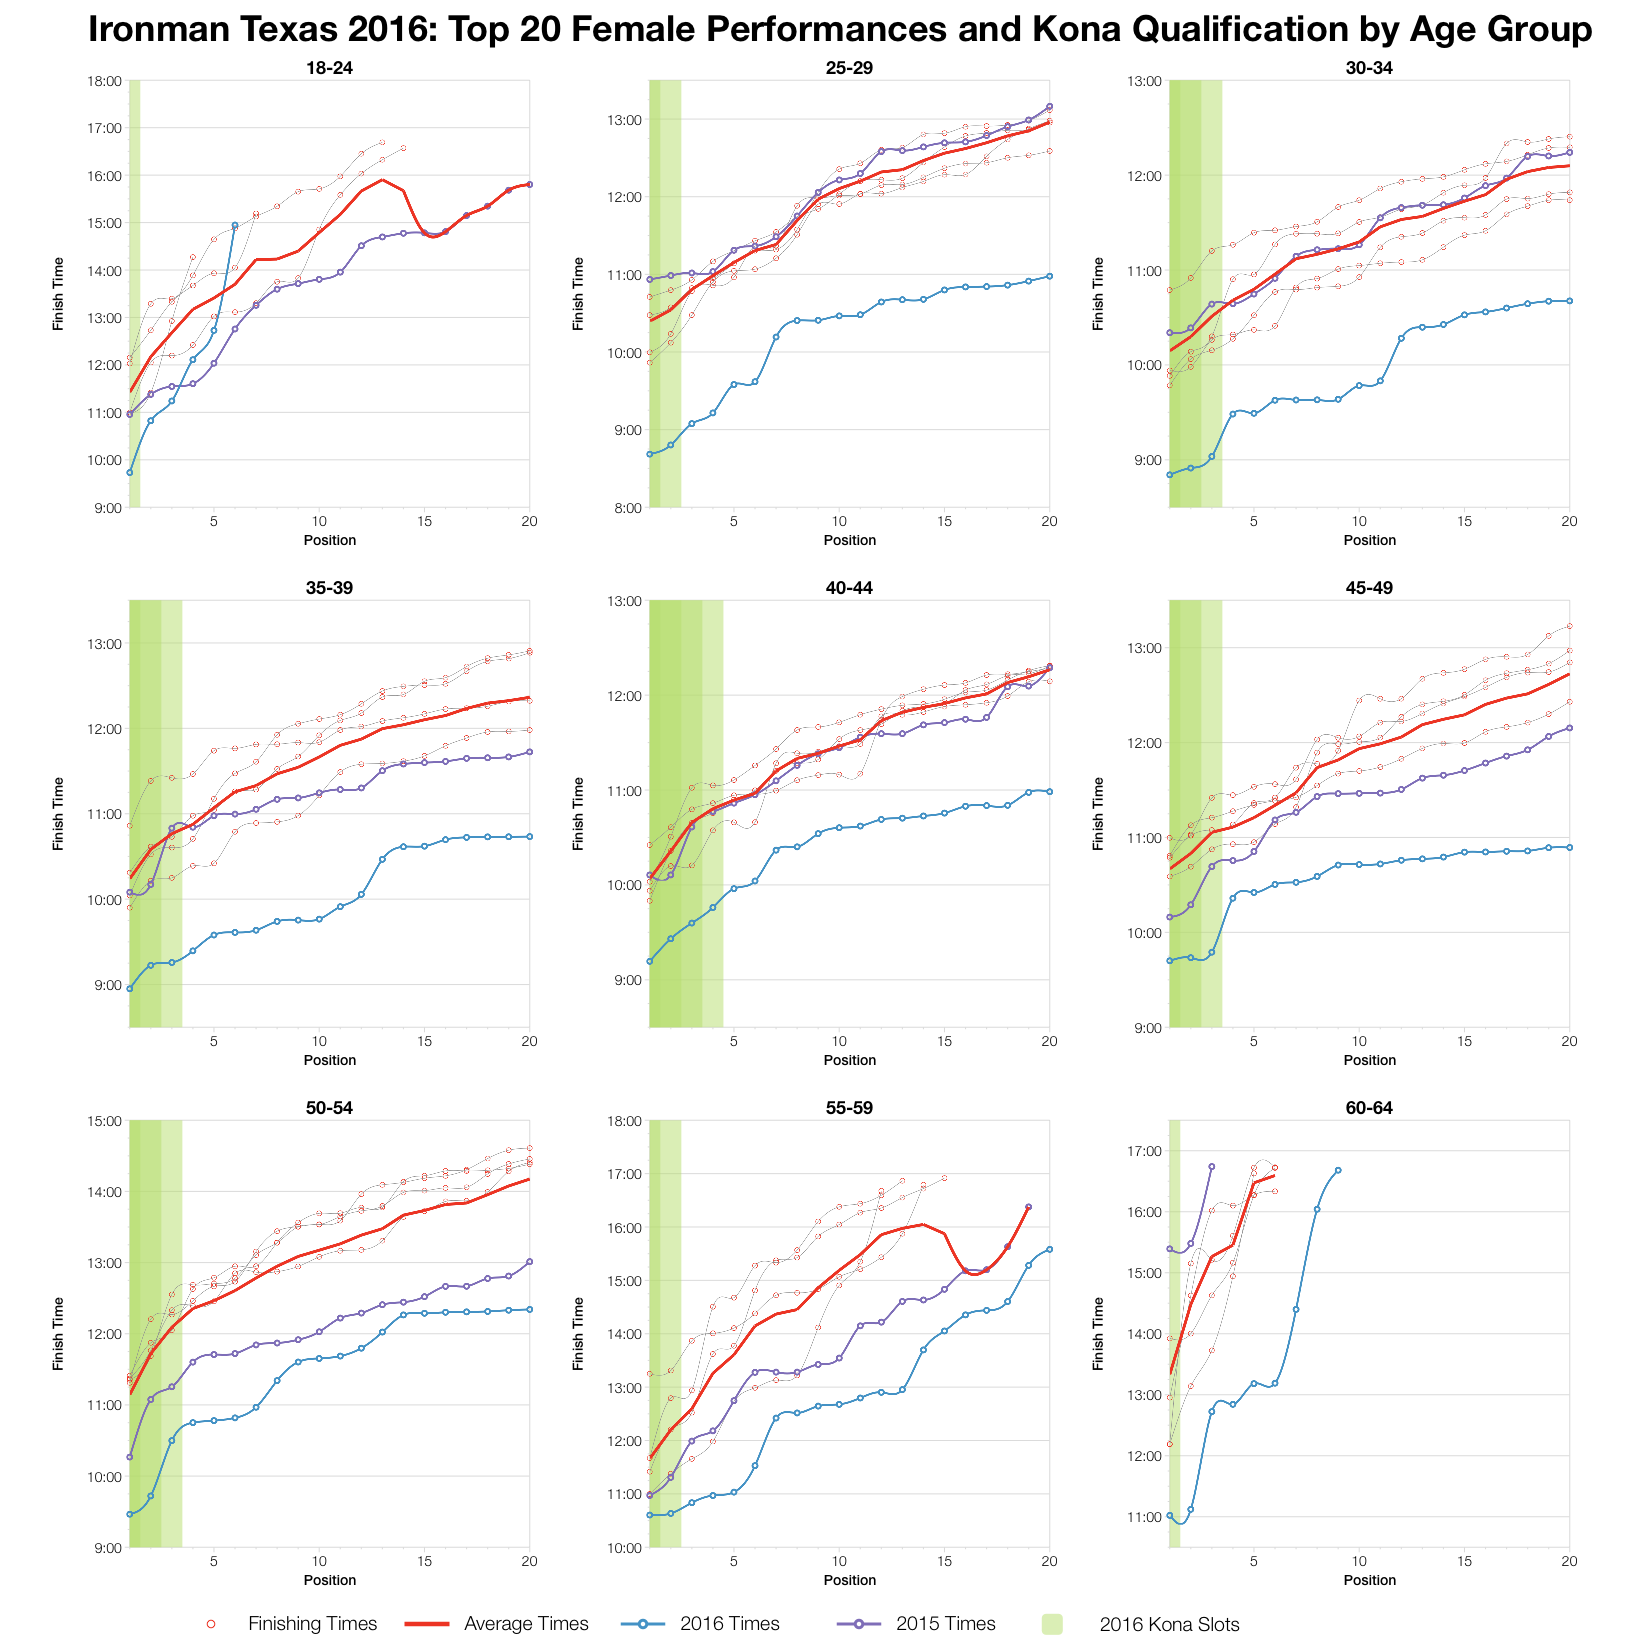
As we’d expect, this year’s times are far faster than in previous years. Interestingly, in some age groups you can see a jump in times, a sharp drop off between two places. Again, I think this is where the storm delays took affect and we see a times drop off due to the delays. I suspect the use of an earlier timing mat won’t have huge impact on who gets a Kona slots, but it’d be interesting to compare. If anyone is able to provide a list of qualifiers from the race, I’d like to see it.
You can access a spreadsheet of the full results and splits from Ironman Texas 2016 on my Google Drive.


