There was nothing unusual about the 40 Kona slots available at Ironman Los Cabos on Sunday. However, the fact those slots only drew a field of 345 athletes is remarkable. Ironman Los Cabos 2016 is the smallest Ironman branded race I’ve ever analysed. The course is known for being tough, but beyond that I can’t say why so few athletes attended this year’s race.
I’ll analyse the results as normal, but it’s worth remembering that as the number of athletes fall we’re more likely to see unusual skews in the results.
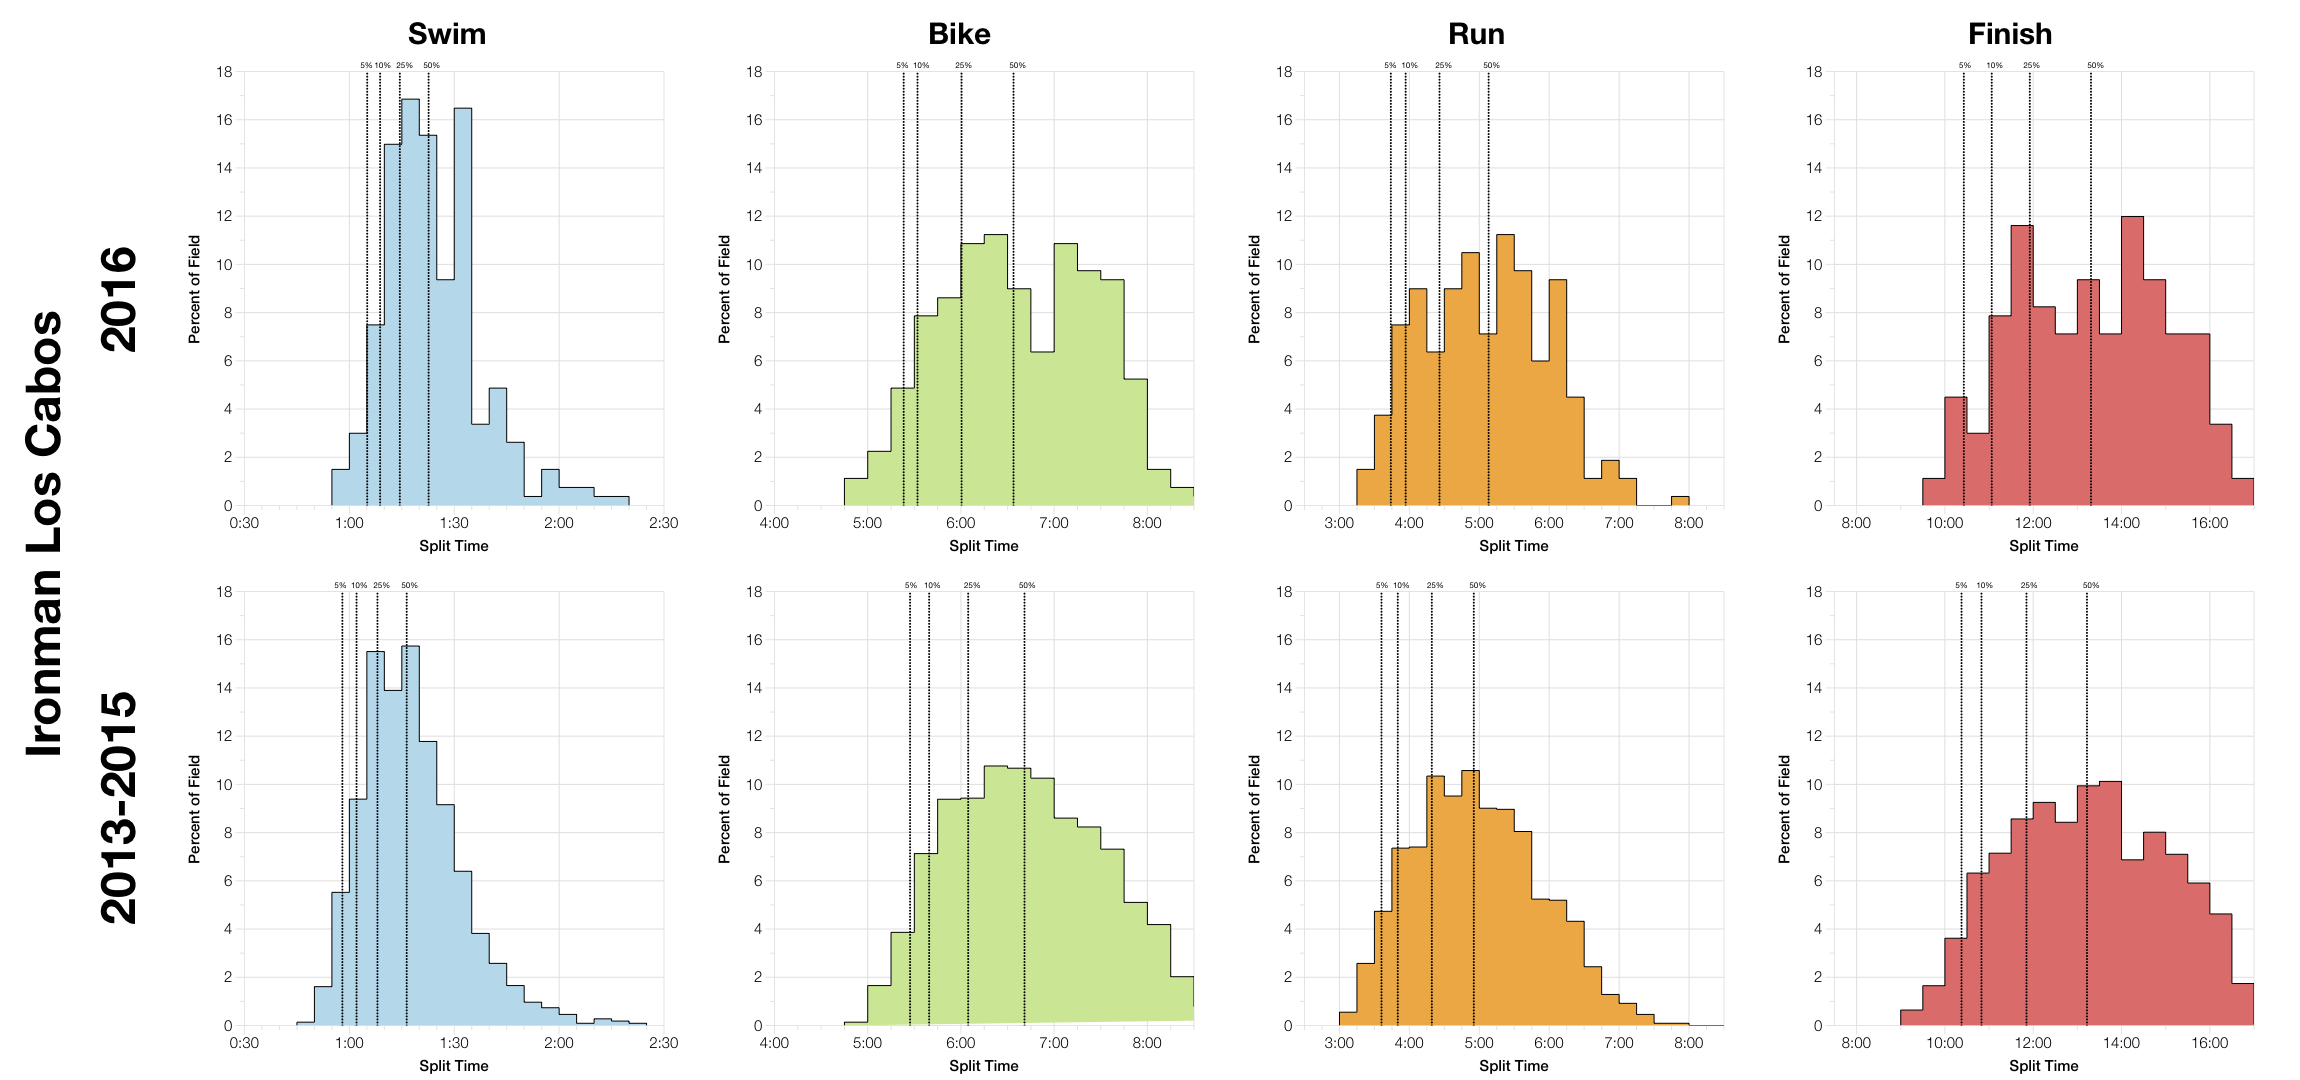
This year’s distributions trended much slower in the swim, a little faster on the bike and a little slower on the run. Conditions were certainly tough, but I don’t think they were exceptional for the race. The overall distributions broadly lines up with previous years at this event if a touch slower.
Of course, as I’ve noted, with a small field individual performances carry more weight in the distributions. Looking at this year’s overall results there are a couple of major peaks, one around 12:00 and one around 14:30, probably indicating the separation between the mid-to-front athletes and the back of pack. There’s also a small peak at 10:30 for those at the very front of the race.
| Listed Athletes | Swim Finish | Swim DNS/DNF | Bike Finish | Bike DNF | Run Finish | Run DNF | Overall DNS/DNF | |
|---|---|---|---|---|---|---|---|---|
| 2013 | 1346 | 1020 | 24.2% | 945 | 7.4% | 877 | 7.2% | 34.8% |
| 2014 | 871 | 855 | 1.8% | 823 | 3.7% | 748 | 9.1% | 13.3% |
| 2015 | 908 | 747 | 17.7% | 677 | 9.4% | 619 | 8.6% | 31.8% |
| 2016 | 345 | 317 | 8.1% | 291 | 8.2% | 267 | 8.2% | 22.6% |
The lack of clarity over inclusion of DNS numbers always makes it trickier to draw conclusion on DNF rates. I believe they largely match previous editions of this race which makes them high by Ironman standards. Certainly bike and run DNF is comparable with previous races. The swim numbers likely to contain the DNS element of the race too, but lean towards the higher end for Ironman.
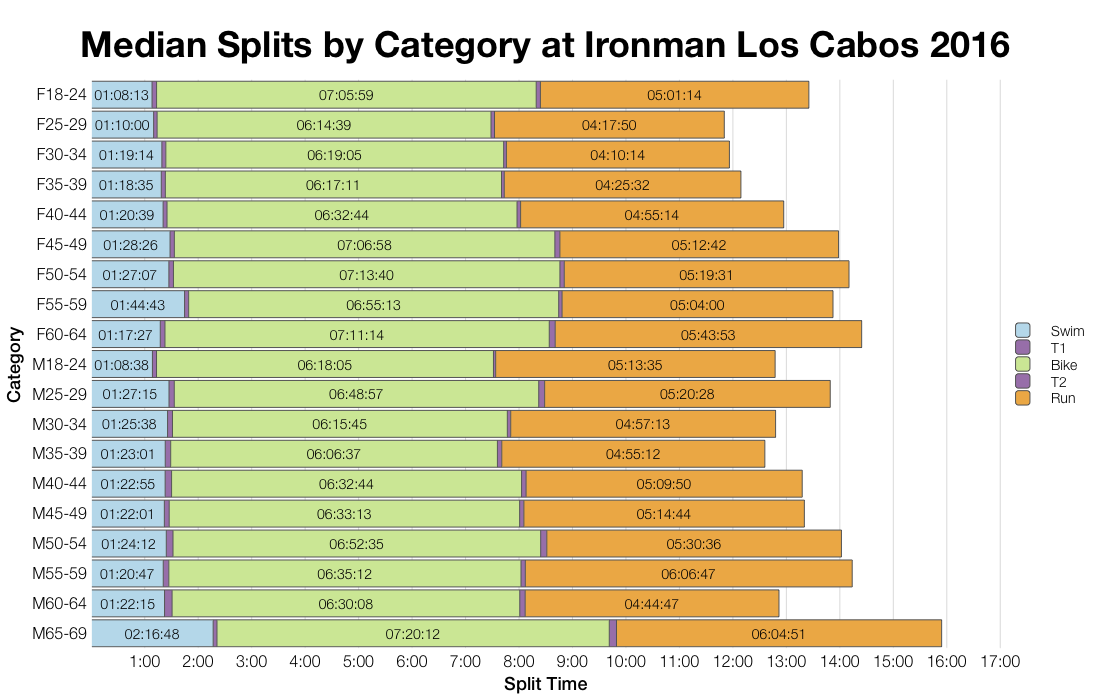
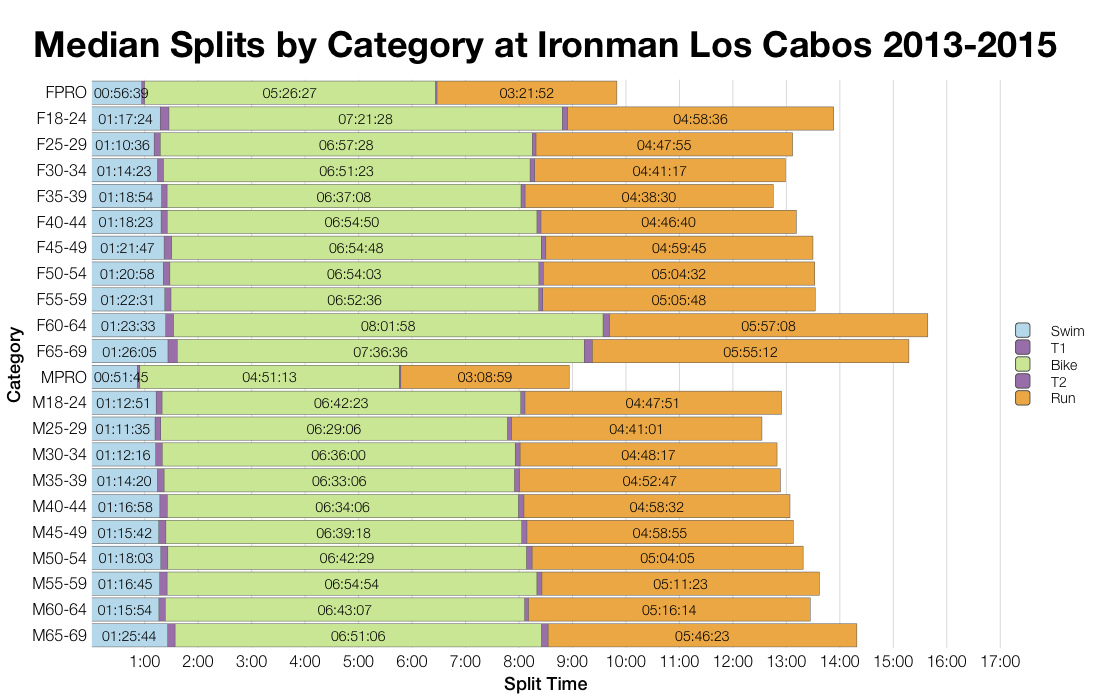
Swim medians are consistently slower for all age groups, but the patterns for bike and run are more varied. Generally the run was slower this year and the bike sometimes faster, but it’s not consistent. In many, but not all, age groups this year was a slower race.
| Country | Percentage of Slots | Percentage of Field |
|---|---|---|
| United States | 42.5 | 31.0 |
| Mexico | 22.5 | 32.8 |
| France | 7.5 | 4.6 |
| Canada | 5.0 | 7.5 |
| Germany | 5.0 | 2.3 |
| Australia | 2.5 | 0.9 |
| Spain | 2.5 | 1.2 |
| United Kingdom | 2.5 | 2.0 |
| Brazil | 2.5 | 0.6 |
| Italy | 2.5 | 2.3 |
| Costa Rica | 2.5 | 1.2 |
| South Africa | 2.5 | 0.3 |
Based on the likely allocation of Kona slots, automatic qualifiers (before any roll down) come from a broad spread of countries with the majority going to the two most numerous nationalities.
| Count | Percentage | |
|---|---|---|
| Mexico | 113 | 32.8 |
| United States | 107 | 31 |
| Canada | 26 | 7.5 |
| France | 16 | 4.6 |
| Colombia | 10 | 2.9 |
| Germany | 8 | 2.3 |
| Italy | 8 | 2.3 |
| United Kingdom | 7 | 2 |
| Argentinia | 4 | 1.2 |
| Japan | 4 | 1.2 |
There’s a fairly diverse spread of athletes at Los Cabos with Mexico and the US making up the majority.
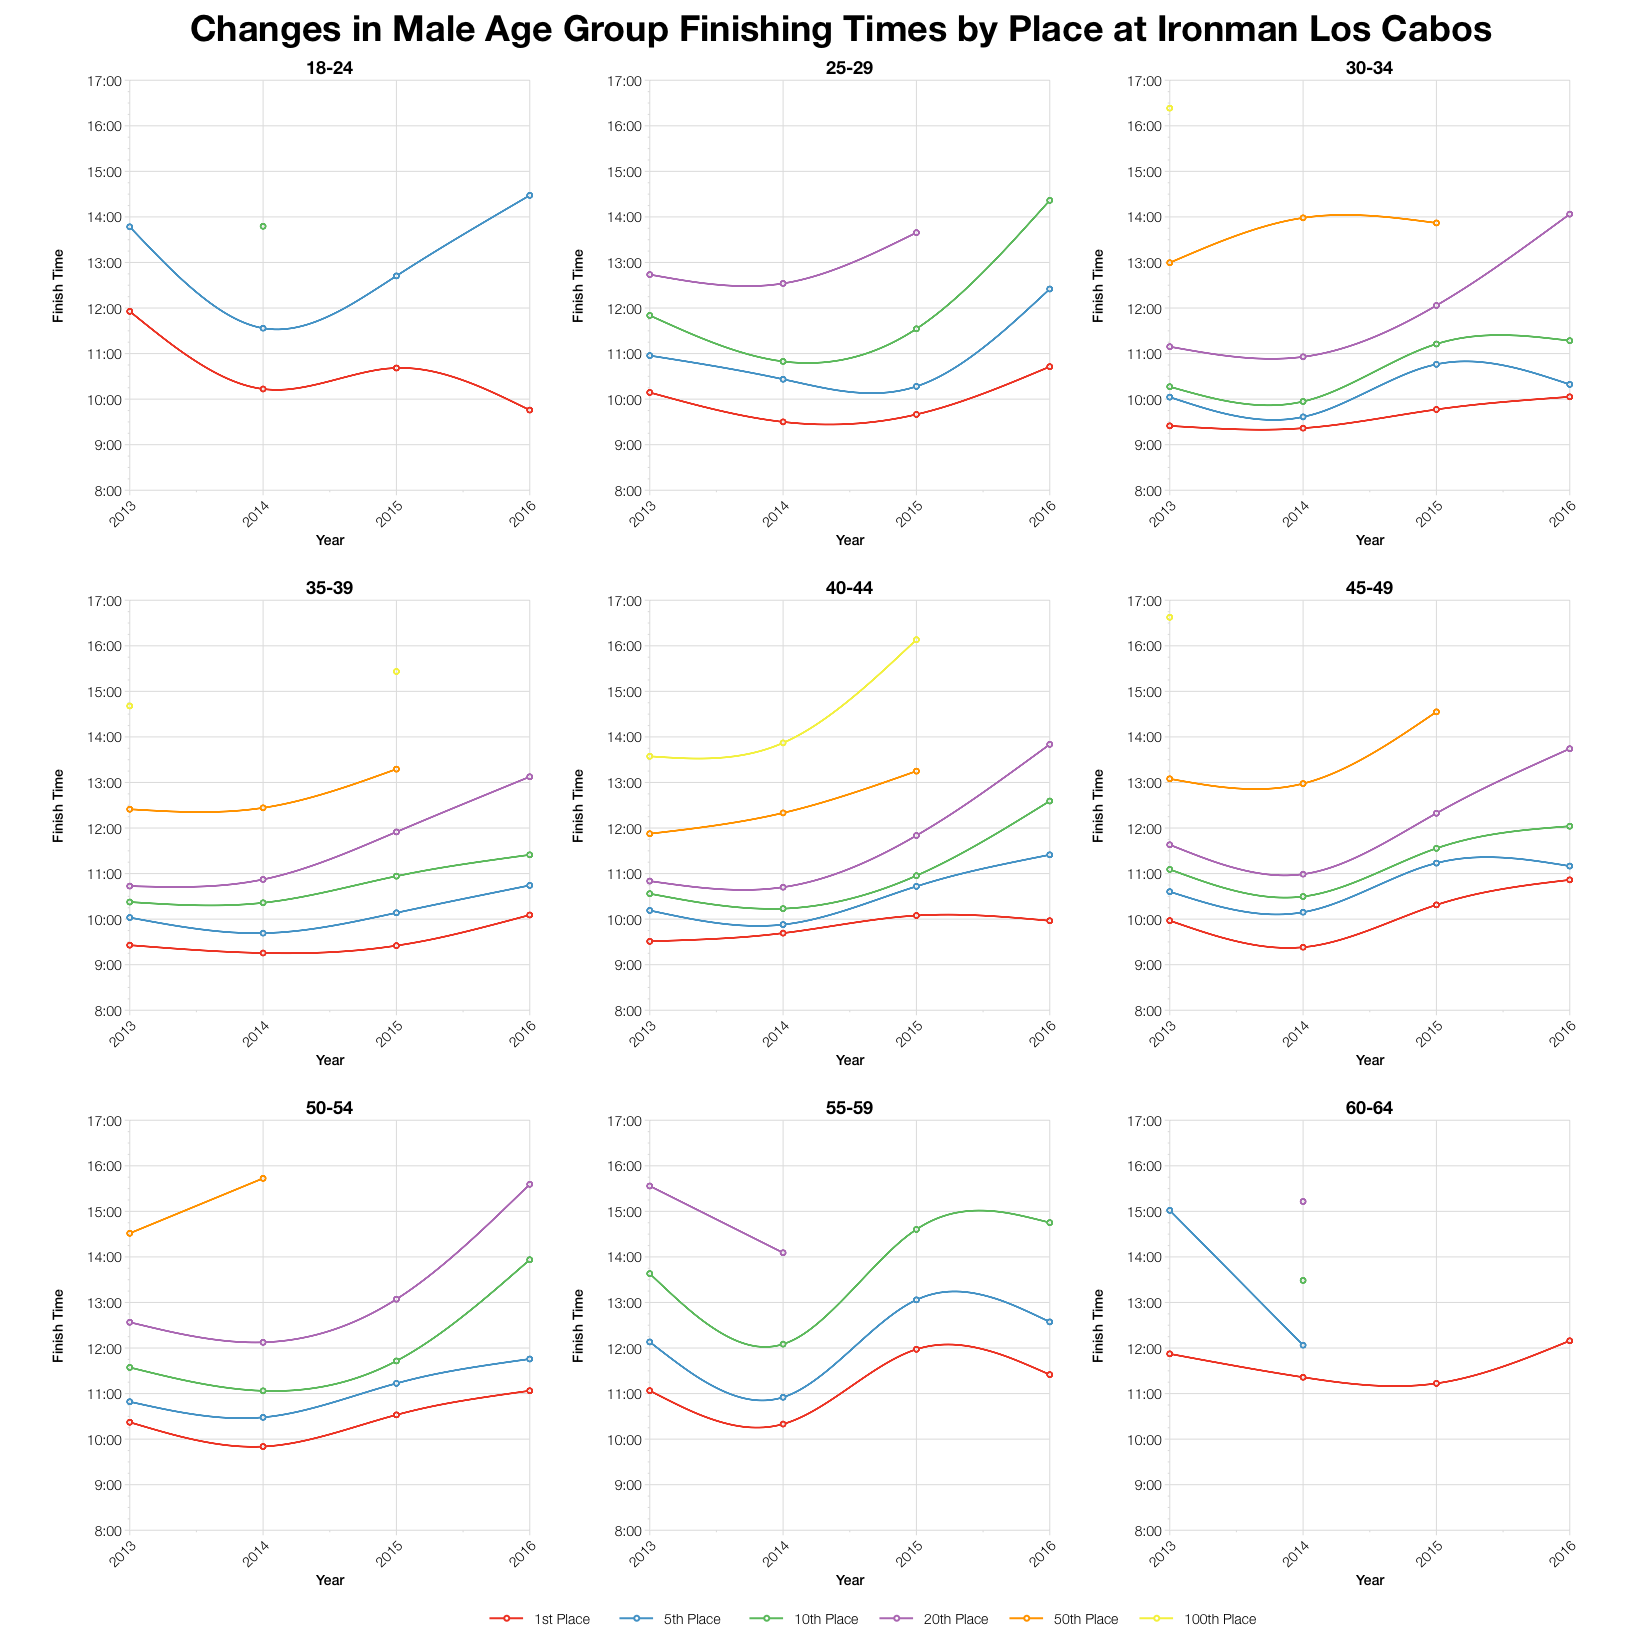
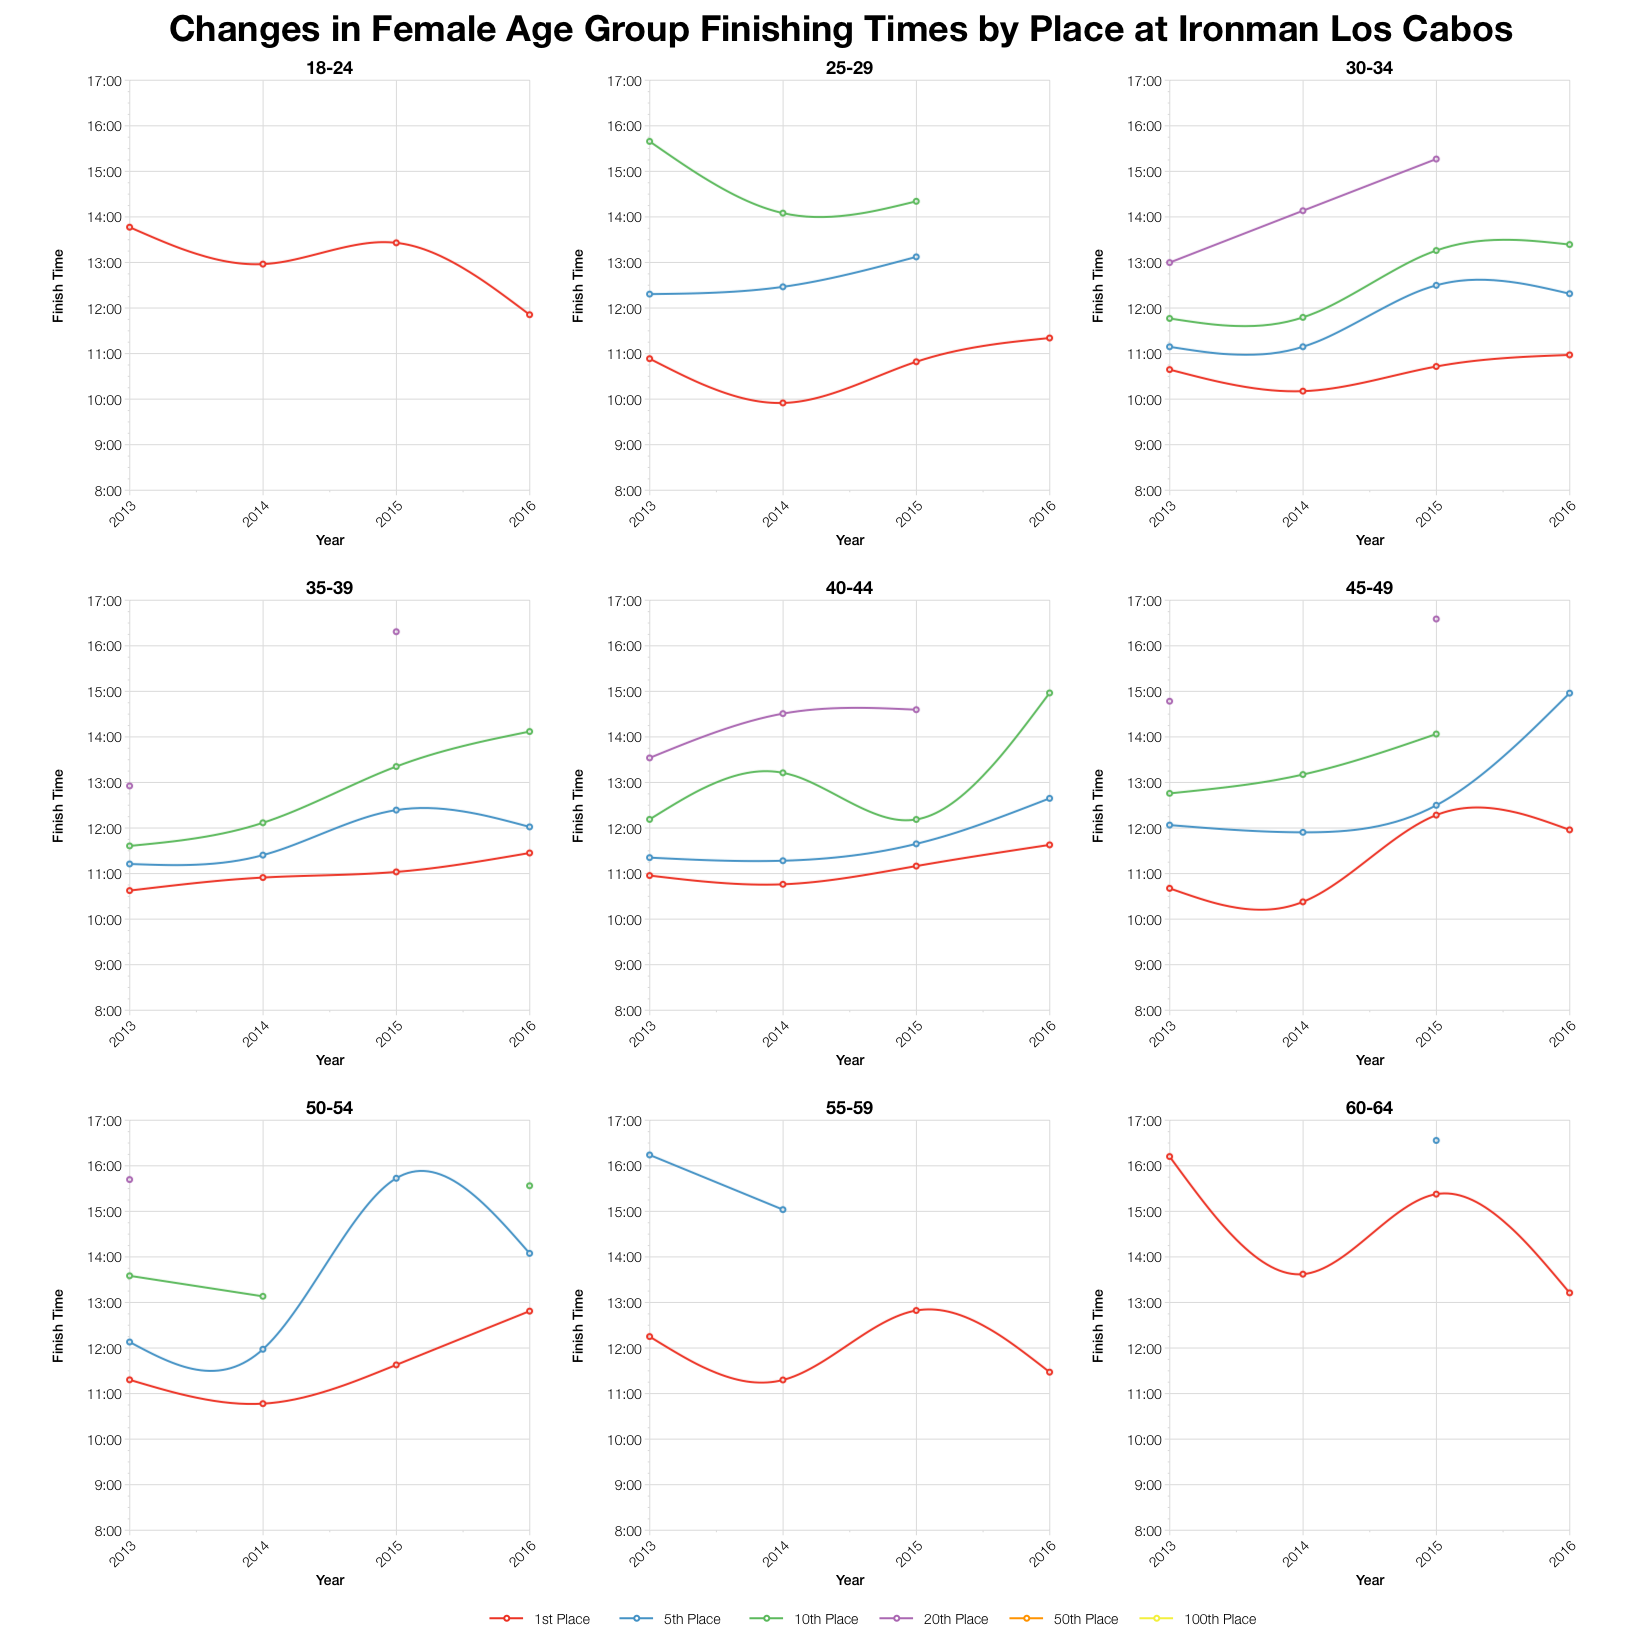
Tracking the finishing times for different age groups and positions over the last 4 years generally places this year’s race as one of the slower ones. How much depends on where you are in your age group. At the very front the difference is small and sometimes athletes were faster; further back we typically see a bigger drop off in times for this year’s event.
| Slots | Winner | Average Kona Qualifier | Final Qualifier | |
|---|---|---|---|---|
| M18-24 | 1 | 9:45:35 | 9:45:35 | 9:45:35 |
| M25-29 | 2 | 10:42:45 | 10:56:43 | 11:10:42 |
| M30-34 | 3 | 10:03:03 | 10:04:29 | 10:06:22 |
| M35-39 | 4 | 10:05:28 | 10:21:47 | 10:31:33 |
| M40-44 | 4 | 9:57:53 | 10:04:59 | 10:17:33 |
| M45-49 | 4 | 10:51:43 | 10:59:47 | 11:07:36 |
| M50-54 | 3 | 11:03:43 | 11:07:55 | 11:14:42 |
| M55-59 | 2 | 11:24:57 | 11:28:11 | 11:31:26 |
| M60-64 | 1 | 12:09:32 | 12:09:32 | 12:09:32 |
| M65-69 | 1 | 15:54:14 | 15:54:14 | 15:54:14 |
| M70-74 | 1 | 15:53:06 | 15:53:06 | 15:53:06 |
| F18-24 | 1 | 11:51:23 | 11:51:23 | 11:51:23 |
| F25-29 | 1 | 11:20:44 | 11:20:44 | 11:20:44 |
| F30-34 | 2 | 10:58:27 | 11:09:52 | 11:21:17 |
| F35-39 | 2 | 11:27:21 | 11:39:26 | 11:51:32 |
| F40-44 | 2 | 11:38:01 | 11:46:49 | 11:55:38 |
| F45-49 | 2 | 11:57:47 | 12:05:00 | 12:12:14 |
| F50-54 | 2 | 12:48:49 | 12:48:53 | 12:48:57 |
| F55-59 | 1 | 11:28:26 | 11:28:26 | 11:28:26 |
| F60-64 | 1 | 13:12:52 | 13:12:52 | 13:12:52 |
Based on my predicted Kona slot allocation (actual slot allocation will depend on exact start numbers) I can determine the automatic qualifying times assuming no roll down happened. Los Cabos is a slow Ironman, it’s one of the few to come out slower than Kona in my recent comparison (for men at least). You can check how it compares with other Ironman races on my Kona qualification page.
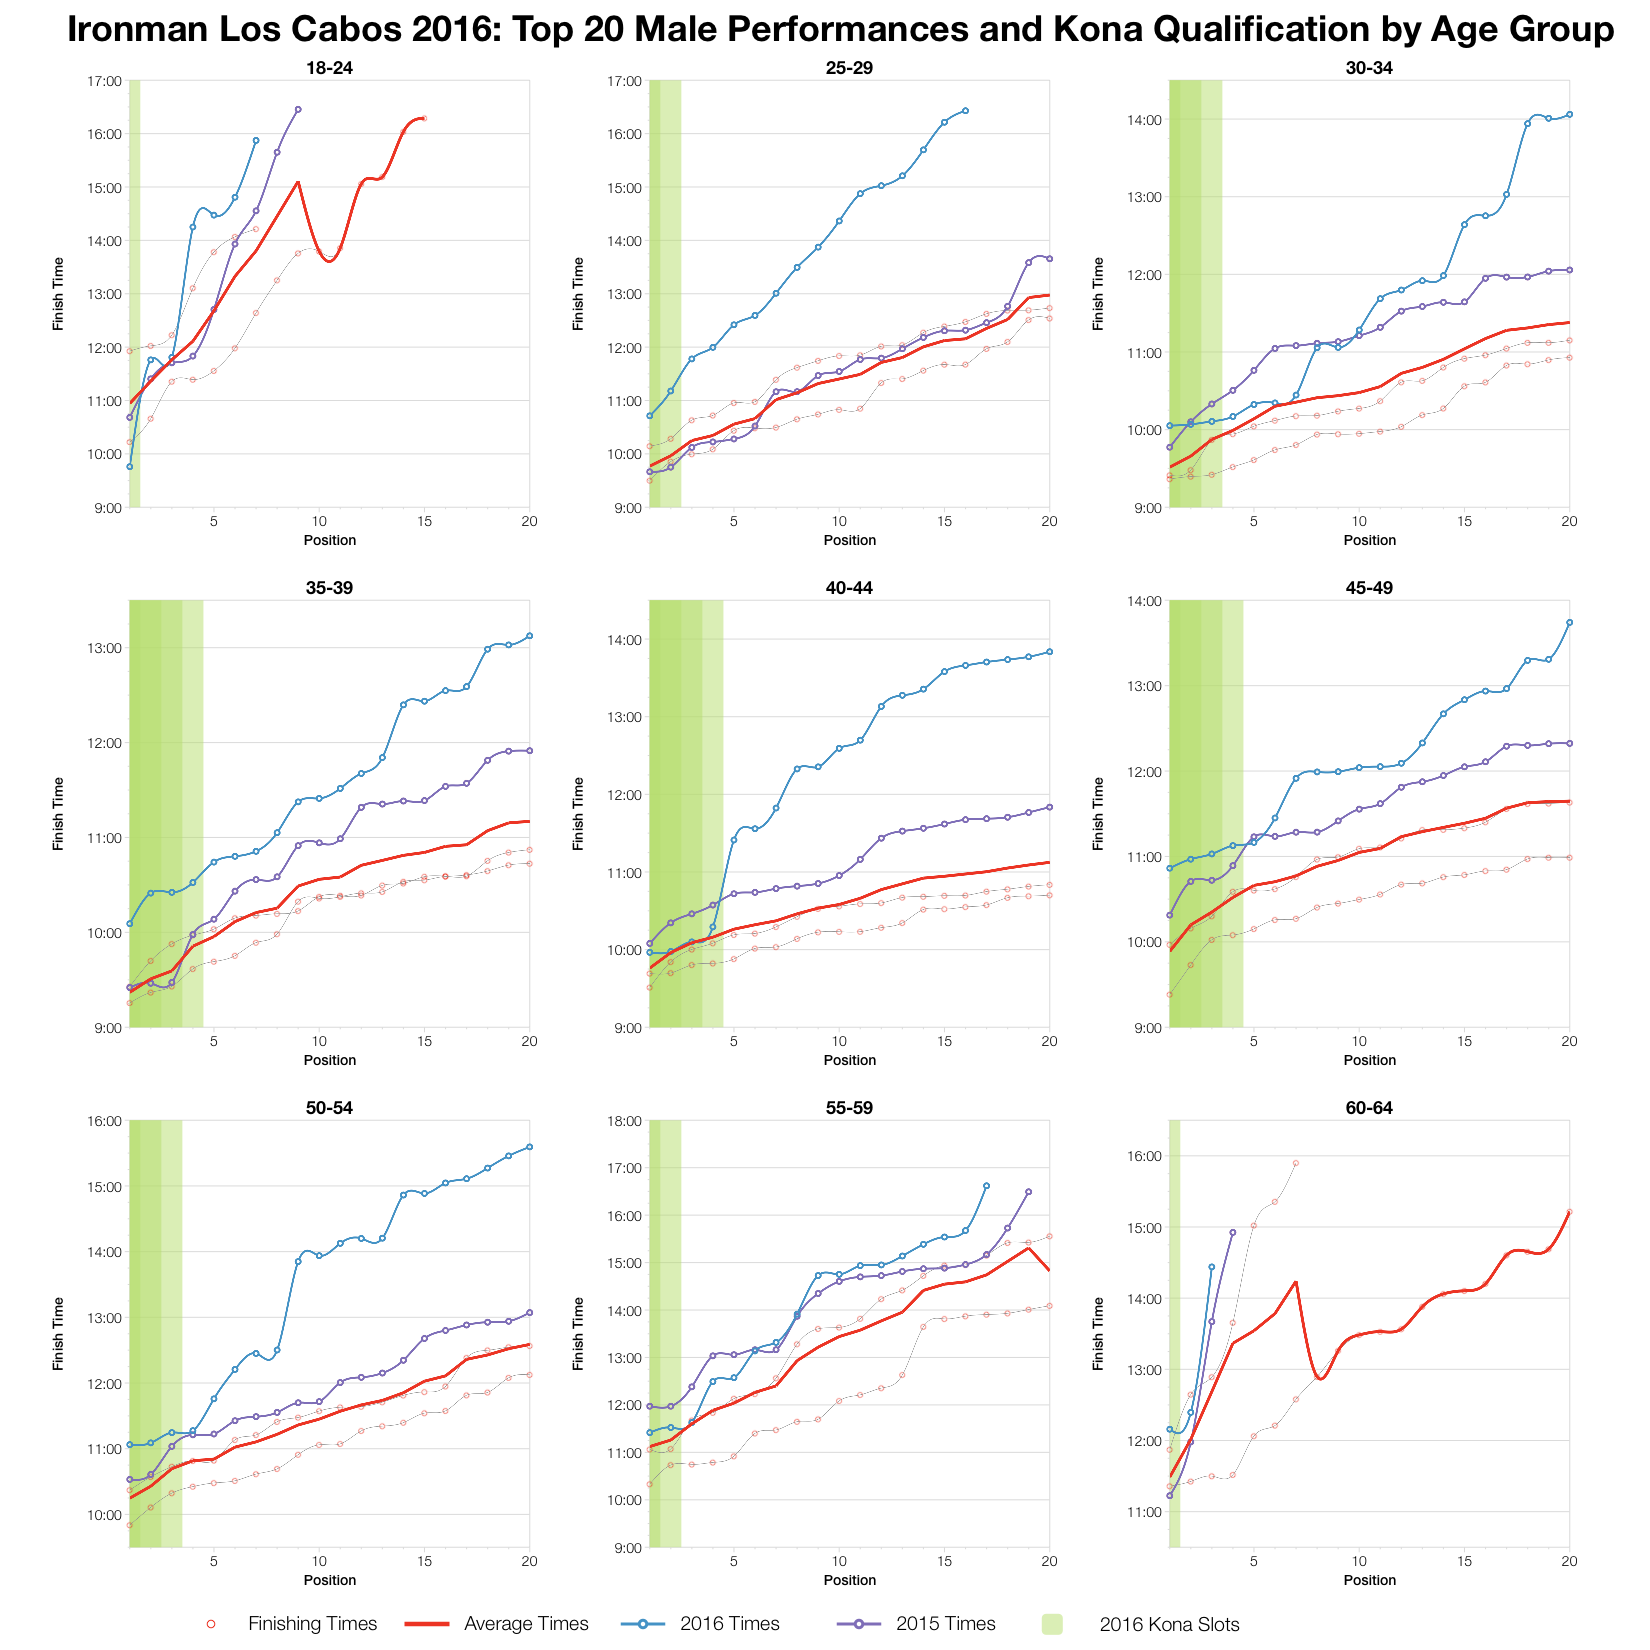
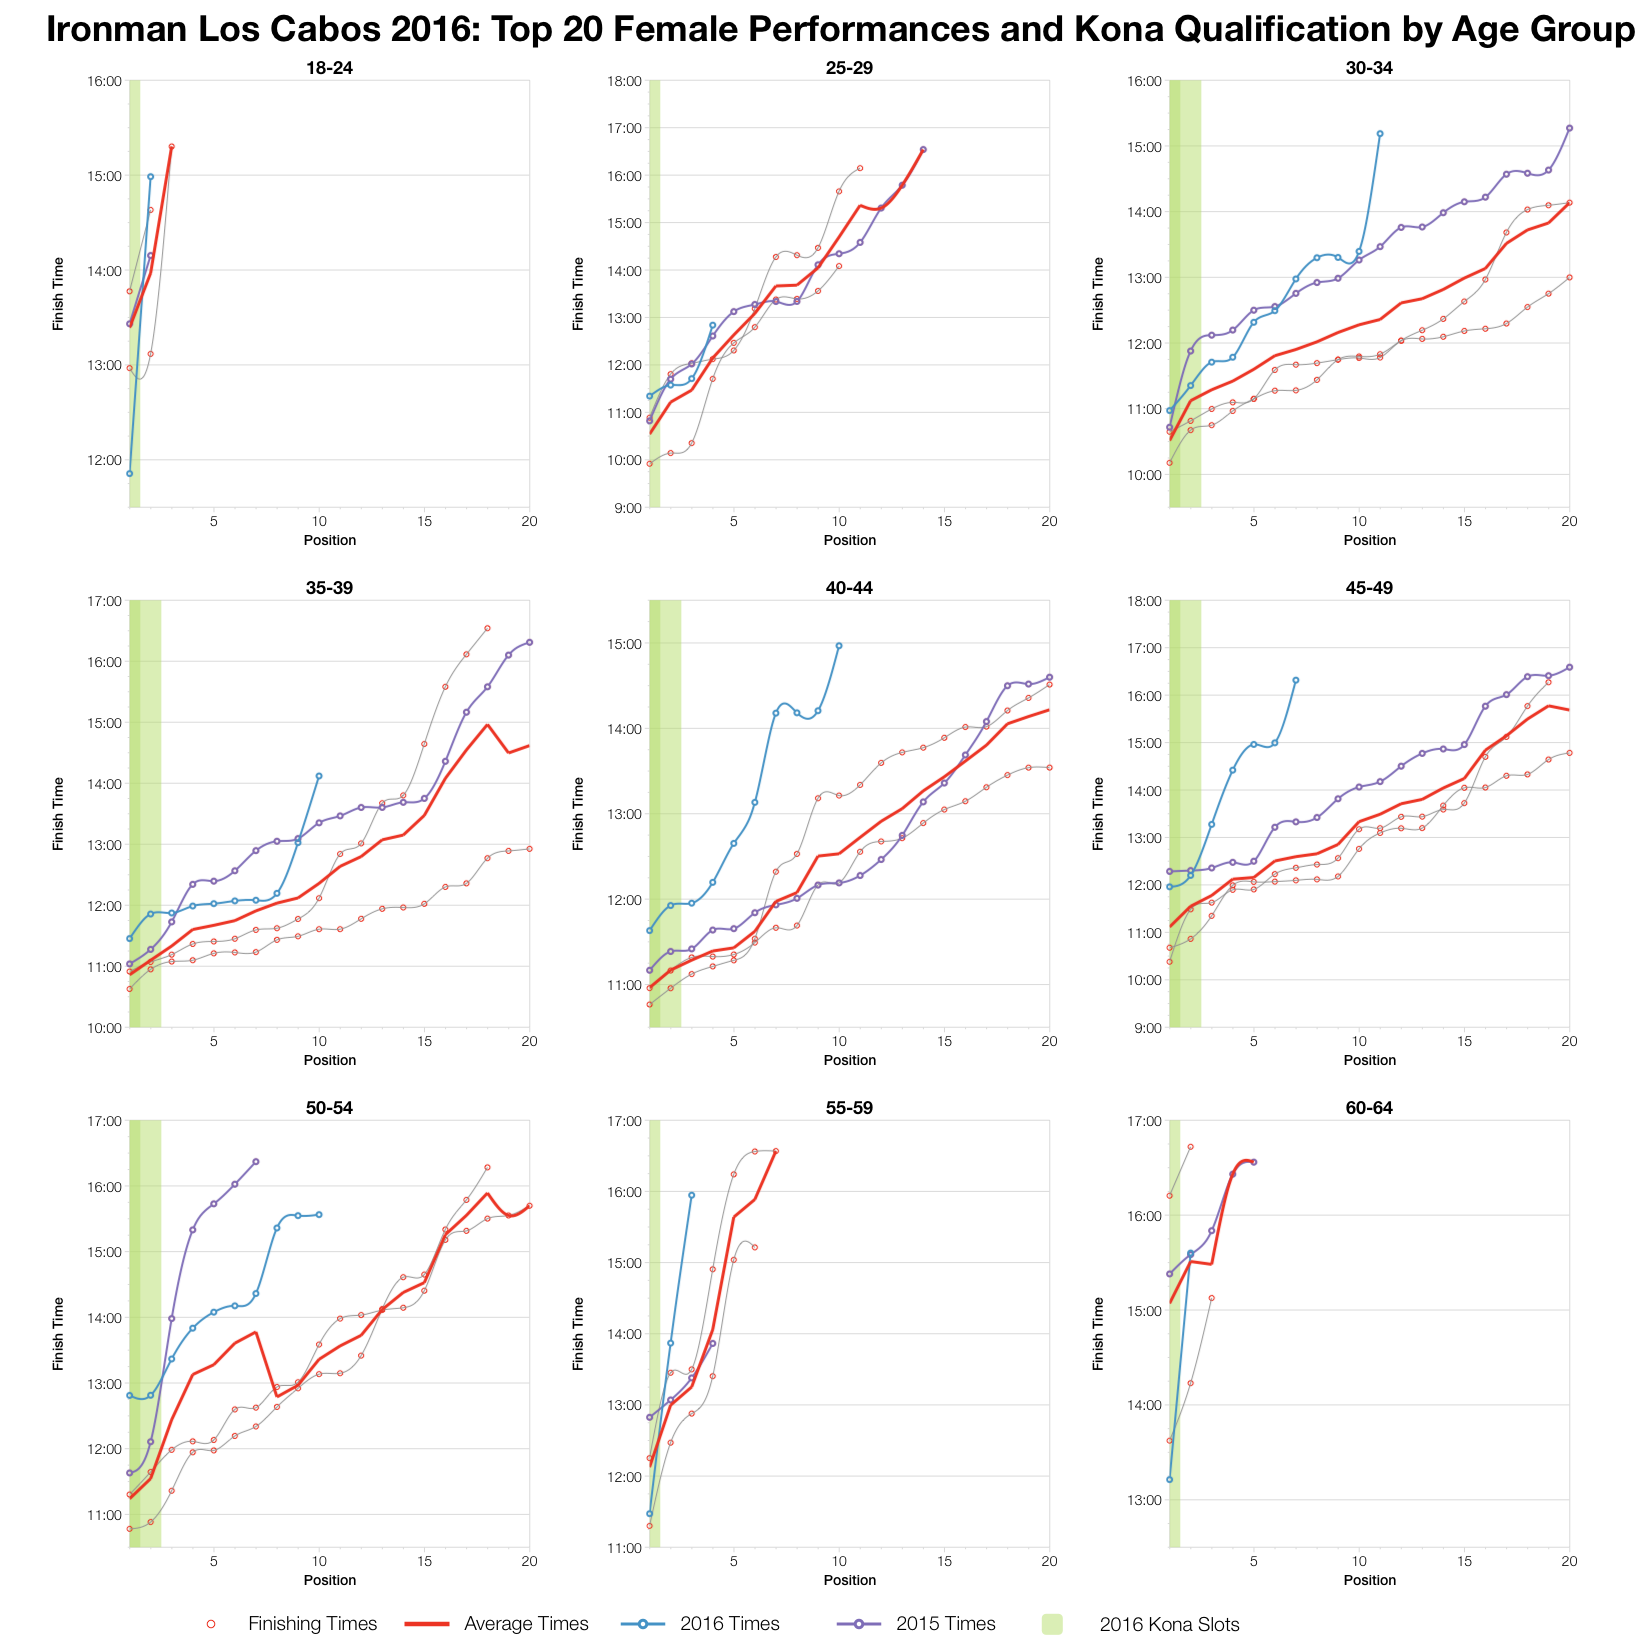
This year’s race was definitely slower than average for top twenty age group athletes. Some of that may be caused by the faster course used in 2014 improving the average. At the very front of the race times trended towards the course average, but further back they quickly drop away. With such a small field we expect the front of pack to be smaller too. At the very front, competition for Kona slots looks to be on par, but the depth of field wasn’t present as it has been with previous, larger fields.
You can access a spreadsheet of the full results and splits from Ironman Los Cabos 2016 on my Google Drive.


