For the pro athletes we know that Ironman Arizona was fast with a new Ironman-brand record set by Lionel Sanders. My analysis will look at how the race played out for age groupers and what that meant for Kona qualification. Arizona tends to be a competitive event with a large field competing for 40 slots for the Ironman World Championship. This year is no exception with some very fast age groupers claiming those slots.
A small note before the analysis begins: two races were held in 2008 as Arizona moved from an early, to a late qualifier. Results from both are used in this analysis, although not all of my tools were designed to properly handle this situation. However, the results for 2009 are excluded as it appears I have an incorrect results set for that year and what’s currently available on Ironman.com is lacking in details.
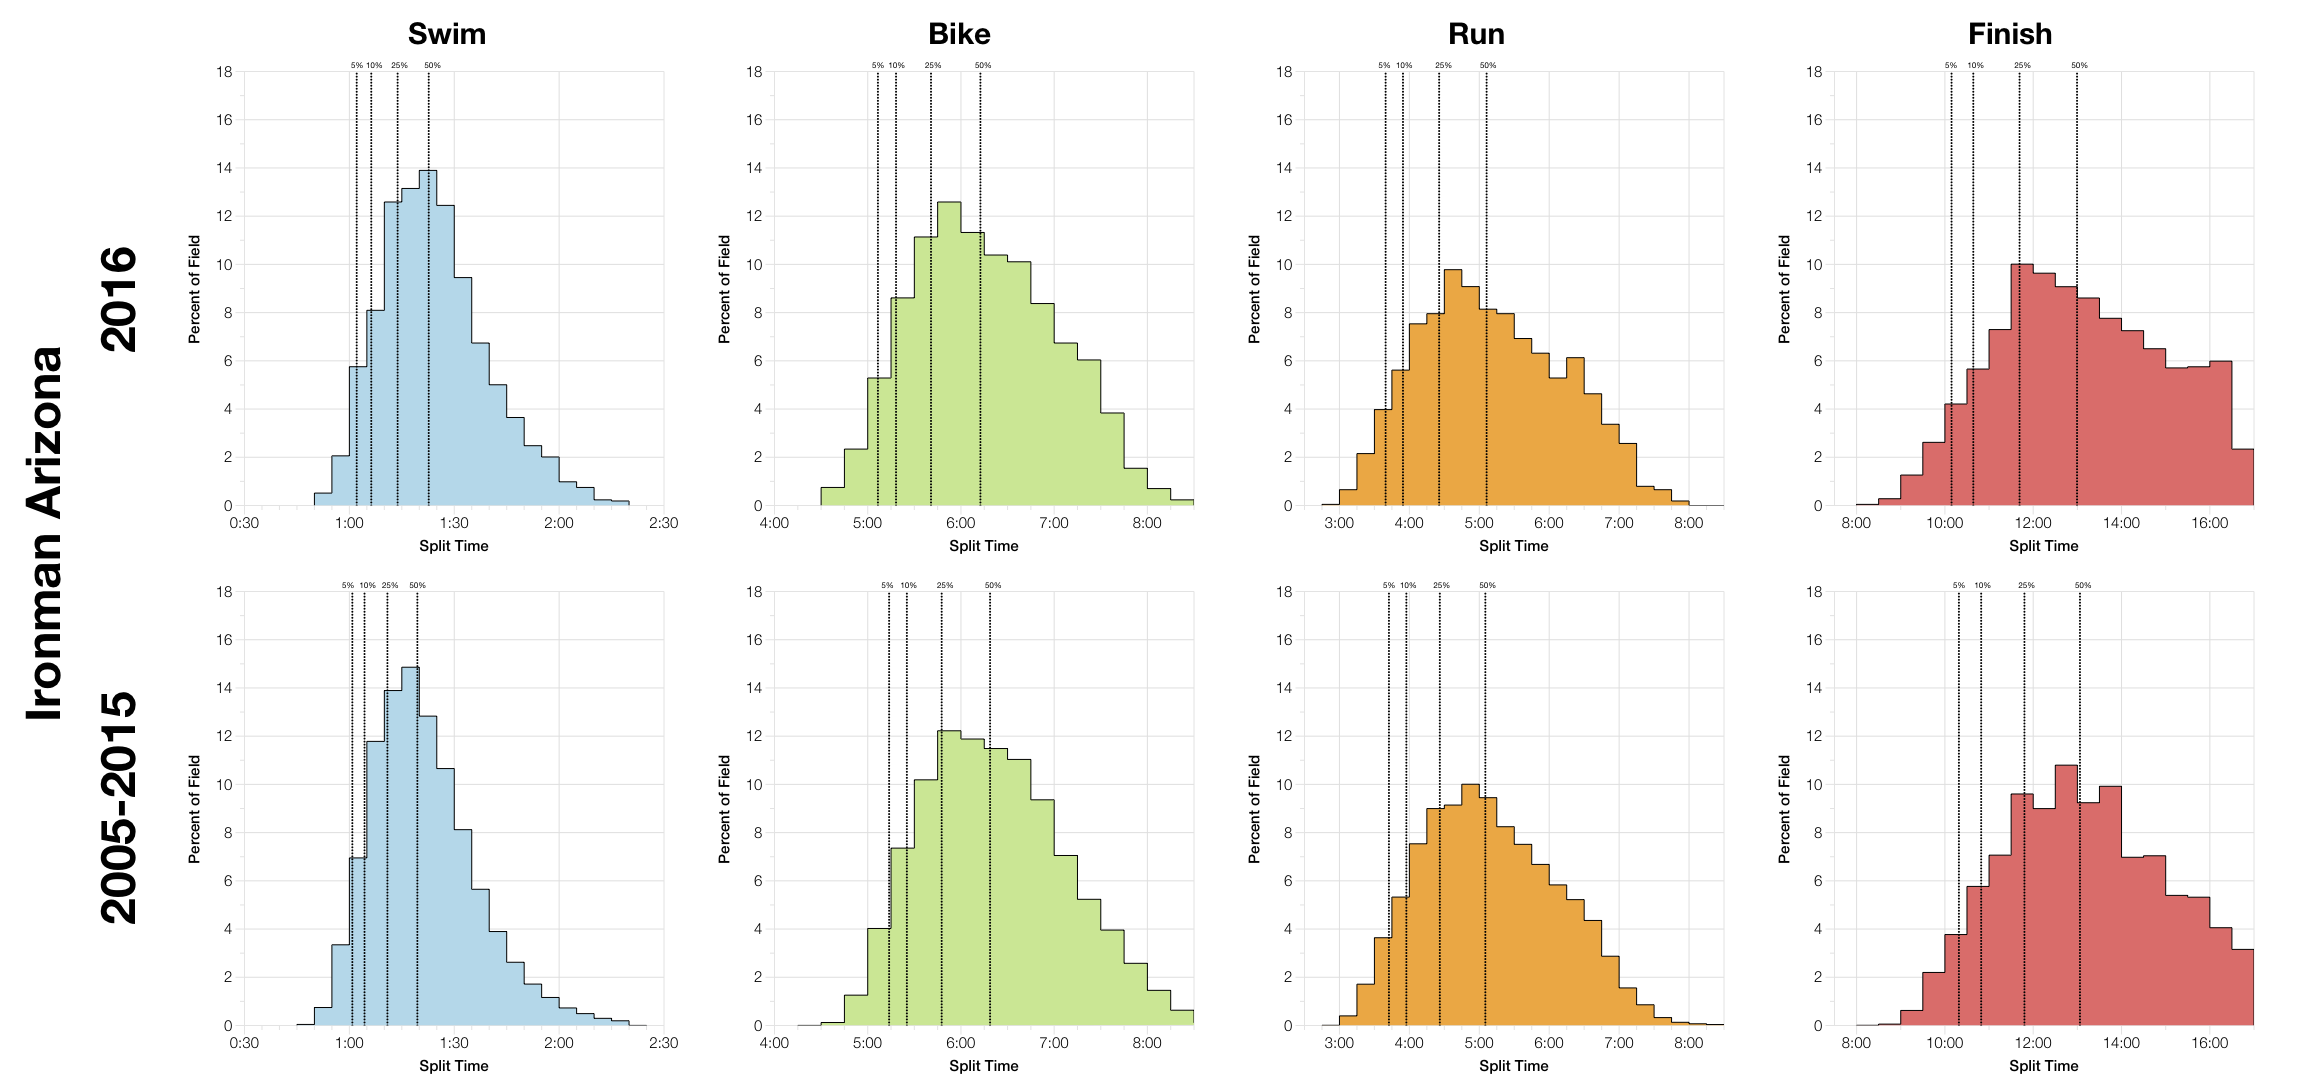
While it was a record breaking year in the pro field the age groups results only trend slightly faster than the aggregate of the previous decade. In the case of the swim distribution, times actually trend a little slower in 2016. It would appear this was a typical age group race. However, I suspect, some of the difference at the front of the pack is masked by the heavy weight of finishers at the back of the pack drawing down percentiles.
| Listed Athletes | Swim Finish | Swim DNS/DNF | Bike Finish | Bike DNF | Run Finish | Run DNF | Overall DNS/DNF | |
|---|---|---|---|---|---|---|---|---|
| 2005 | 2147 | 1794 | 16.4% | 1762 | 1.8% | 1682 | 4.5% | 21.7% |
| 2006 | 2254 | 1929 | 14.4% | 1882 | 2.4% | 1723 | 8.4% | 23.6% |
| 2007 | 2462 | 2046 | 16.9% | 1977 | 3.4% | 1861 | 5.9% | 24.4% |
| 2008 | 2414 | 2022 | 16.2% | 1866 | 7.7% | 1689 | 9.5% | 30% |
| 2008 | 2656 | 2191 | 17.5% | 2156 | 1.6% | 2077 | 3.7% | 21.8% |
| 2010 | 2894 | 2471 | 14.6% | 2482 | % | 2397 | 3.4% | 17.2% |
| 2011 | 2768 | 2360 | 14.7% | 2308 | 2.2% | 2217 | 3.9% | 19.9% |
| 2012 | 2940 | 2504 | 14.8% | 2445 | 2.4% | 2379 | 2.7% | 19.1% |
| 2013 | 2703 | 2637 | 2.4% | 2594 | 1.6% | 2520 | 2.9% | 6.7% |
| 2014 | 3203 | 2639 | 17.6% | 2518 | 4.6% | 2390 | 5.1% | 25.4% |
| 2015 | 2683 | 2426 | 9.6% | 2328 | 4% | 2211 | 5% | 17.6% |
| 2016 | 2445 | 2325 | 4.9% | 2272 | 2.3% | 2200 | 3.2% | 10% |
As always I need to note that some years the athlete tracker lists all signed up athletes and others just those who registered on site. As such it’s impossible to eliminate DNS numbers correctly and the percentages for swim and overall vary accordingly. Where you see over 10% DNS/DNF for the swim you can be certain that all DNS numbers are included, otherwise it’s predominantly DNF. Bike and run numbers are calculated directly from results and so consistent across the years. That technical note aside, the DNF numbers for this years race look to be moderate. Not the lowest seen, but certainly not the highest.
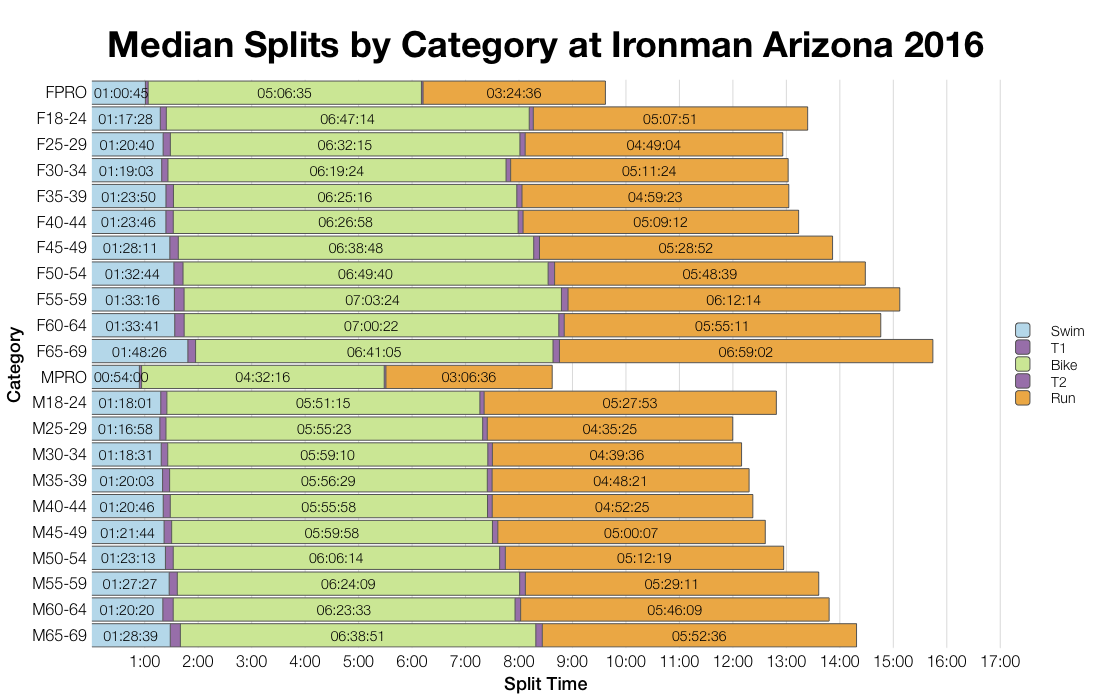
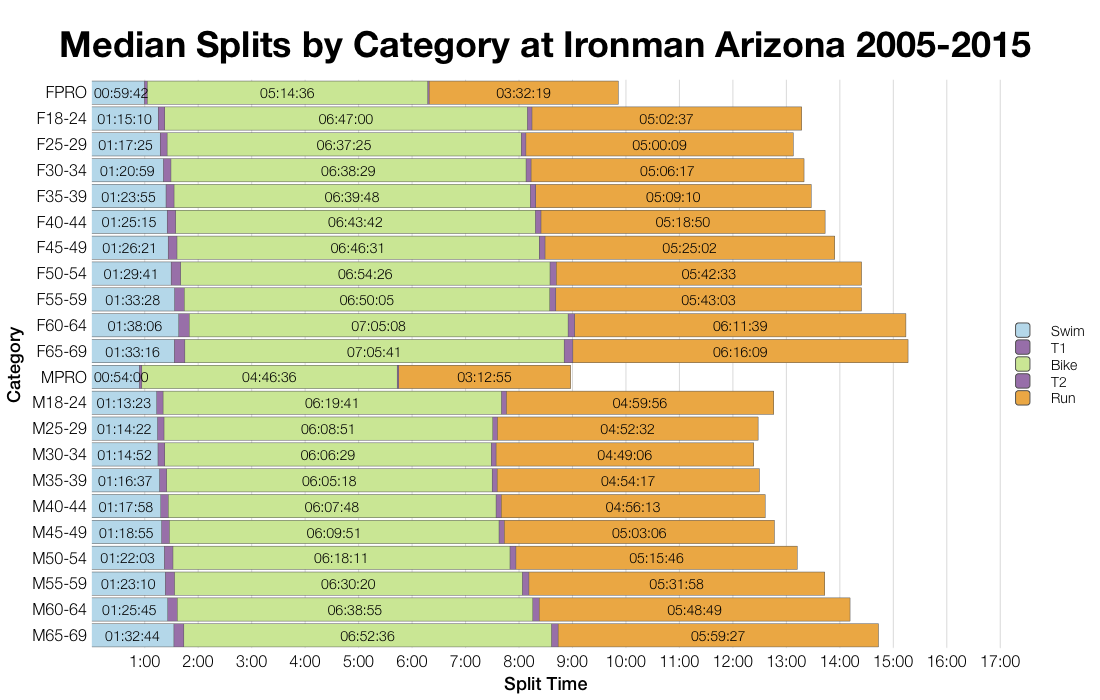
Comparing the median splits we can see the changes in the pro results this year, but the differences in age group results are much smaller. There’s nothing consistent across all age groups to suggest conditions favoured a particular element of the course. We can see faster medians in some of the larger age groups though, so these may have been faster this year.
| Country | Percentage of Slots | Percentage of Field |
|---|---|---|
| United States | 67.5 | 86.1 |
| Canada | 10.0 | 4.0 |
| United Kingdom | 5.0 | 1.1 |
| Ireland | 5.0 | 0.5 |
| Ecuador | 2.5 | 0.1 |
| South Africa | 2.5 | 0.2 |
As I’ve not seen the final slot allocation for Arizona, I’ve calculated it based on the number of athletes in the tracker and from there determined who would be likely to automatically qualify (by time without roll down). The majority of automatic qualifiers will unsurprisingly come from the US. As we’ll see in the table below, they make up the bulk of the field. A few other nationalities also picked up slots though.
| Count | Percentage | |
|---|---|---|
| United States | 2104 | 86.1 |
| Canada | 99 | 4 |
| Mexico | 31 | 1.3 |
| United Kingdom | 27 | 1.1 |
| Philippines | 22 | 0.9 |
| Australia | 14 | 0.6 |
| Ireland | 13 | 0.5 |
| Brazil | 12 | 0.5 |
| Japan | 11 | 0.4 |
| Germany | 9 | 0.4 |
There’s nothing unusual in nationalities of competitors – the vast majority come from the US as we’d expect.
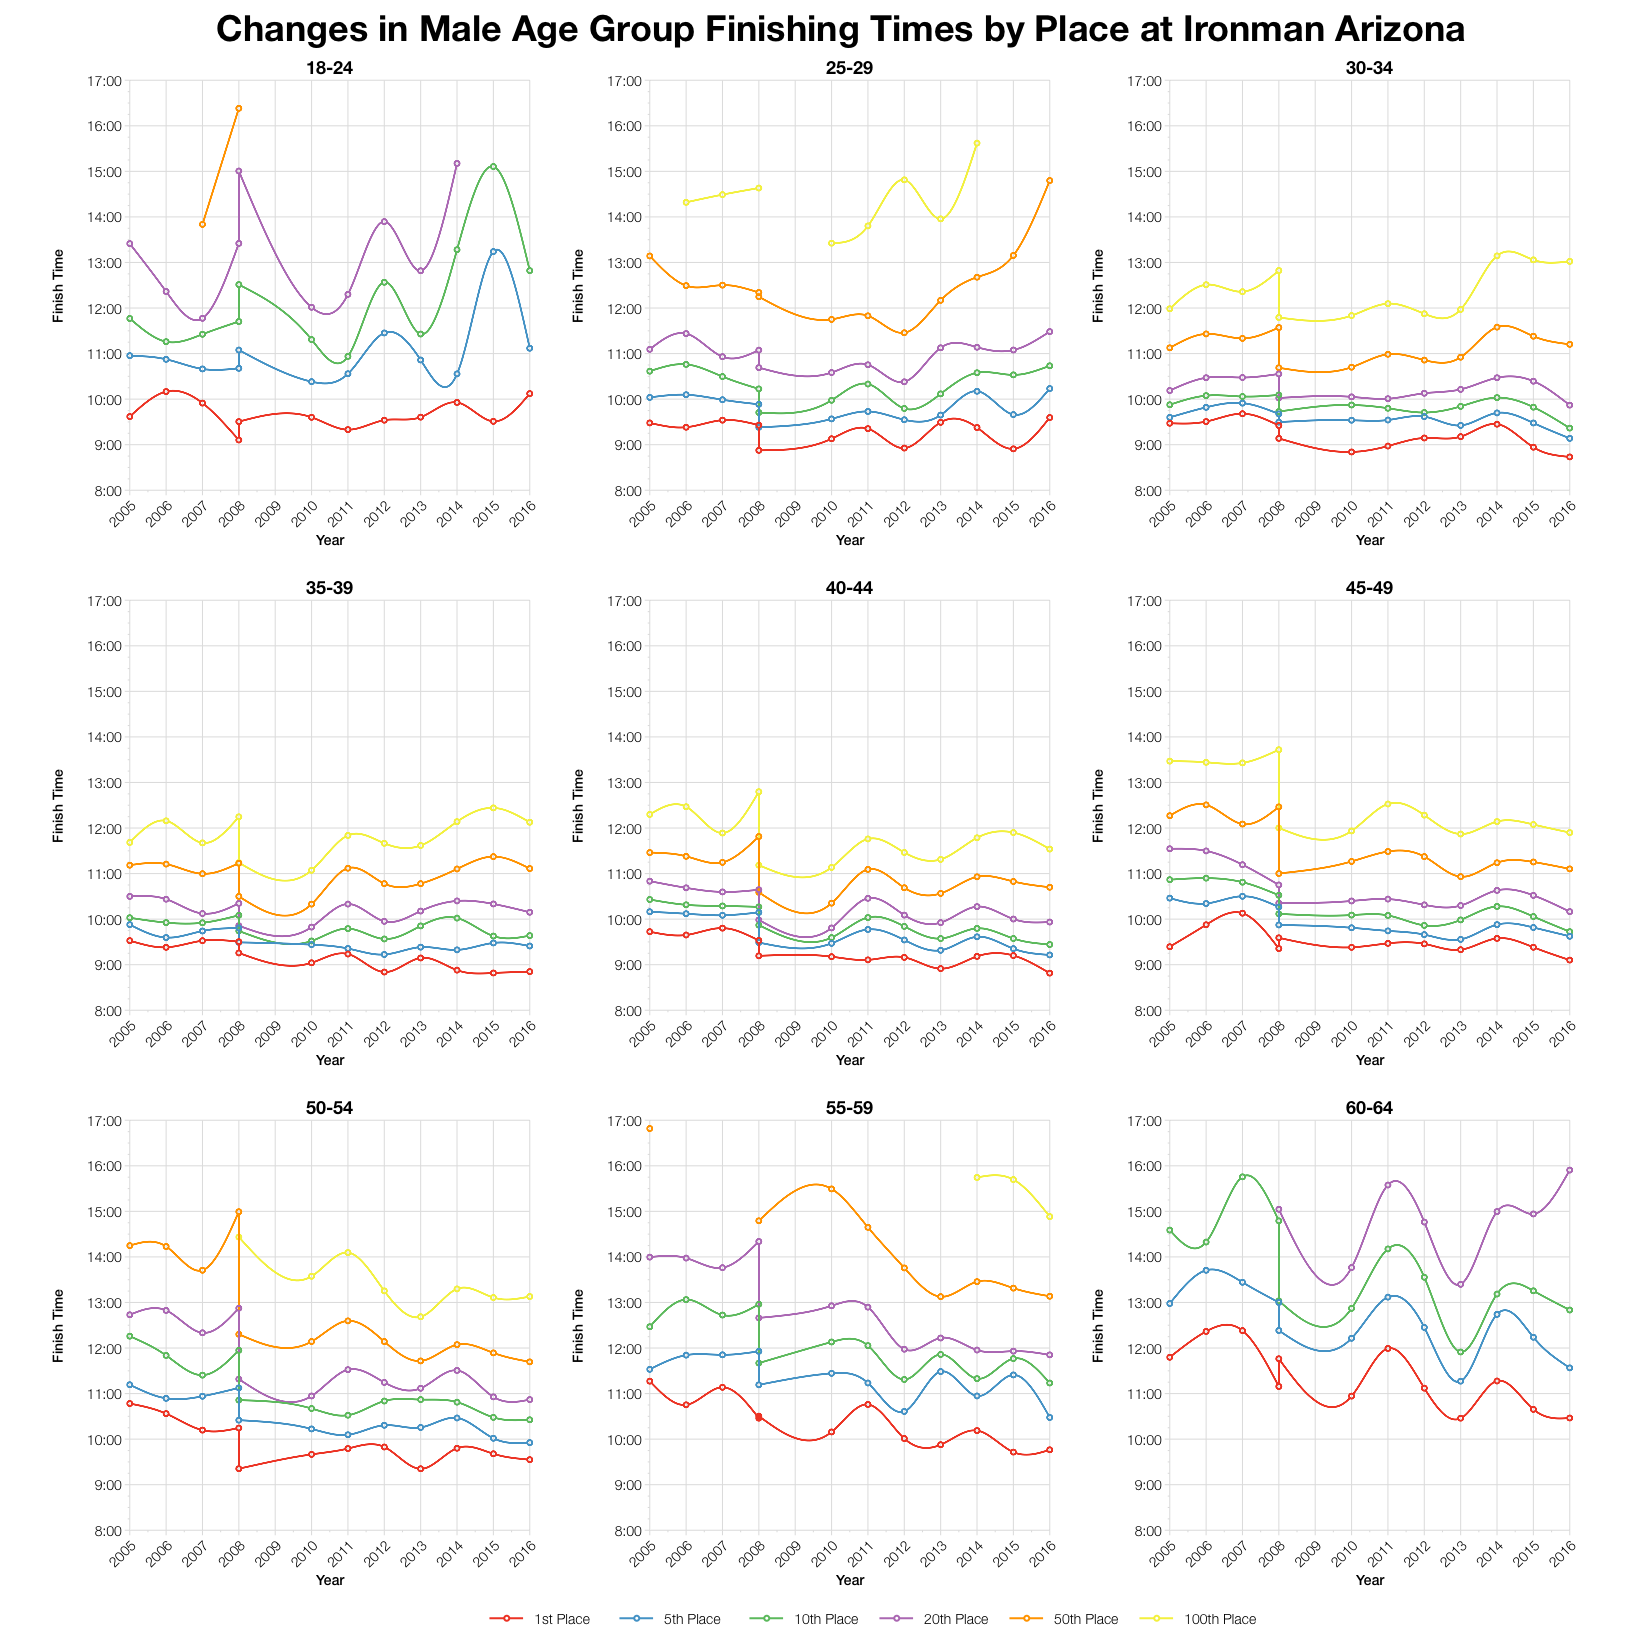
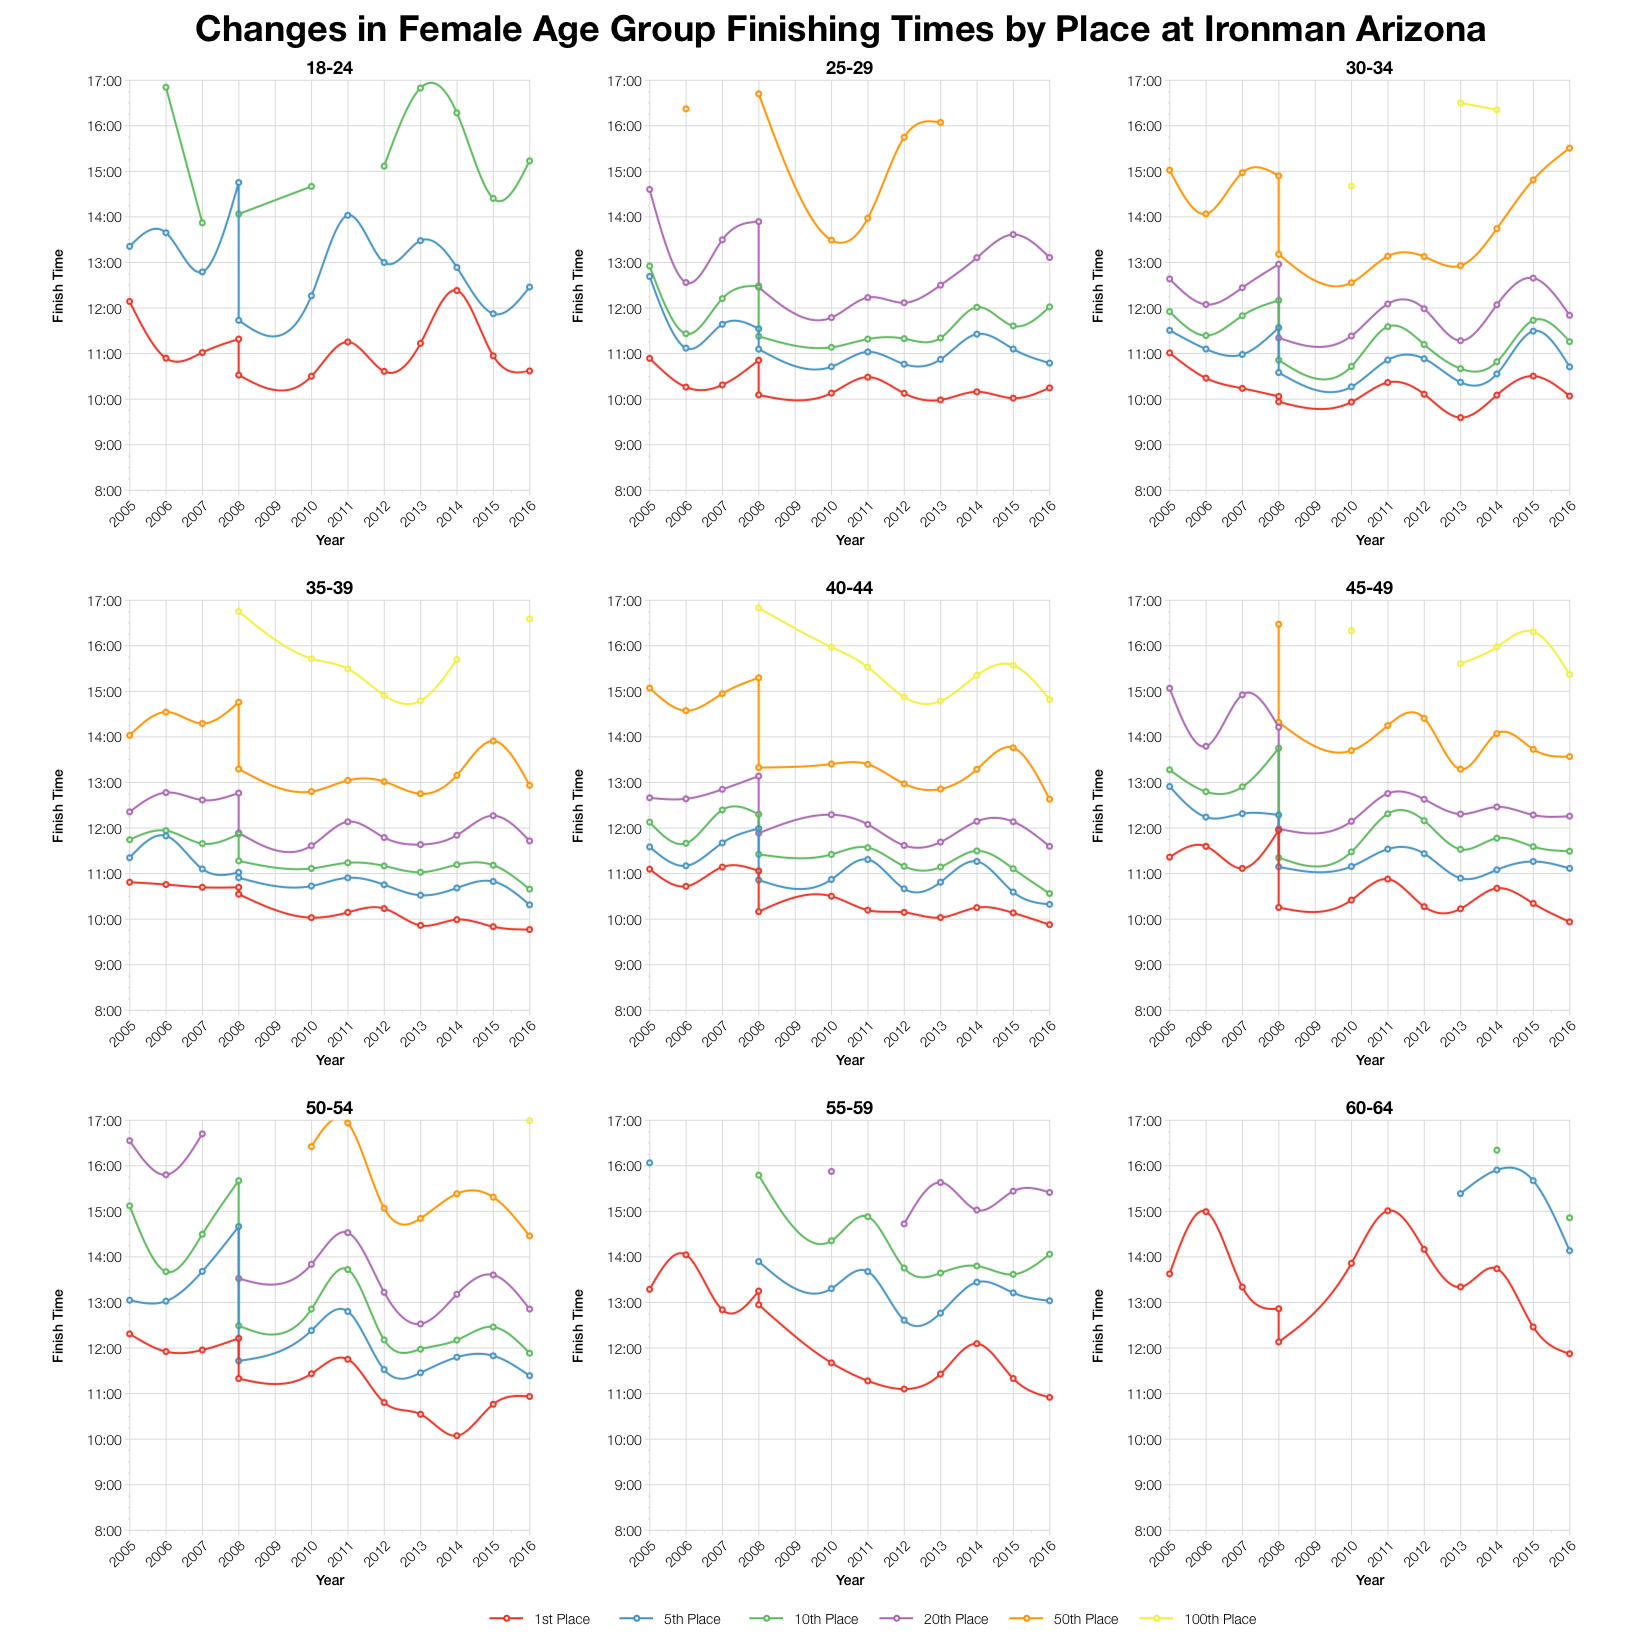
In the above charts you can see the double entry for 2008. It’s not the most elegant display, but it will work for our purposes. Generally the date change for Arizona caused an improvement in race times, this is particularly the case at the front of the field. Although this year’s race is not universally faster, for the largest age groups the trend at the front is towards faster times. Those improvements appear to drop off further back in the field and in the smaller age groups.
| Slots | Winner | Average Kona Qualifier | Final Qualifier | |
|---|---|---|---|---|
| M18-24 | 1 | 10:07:16 | 10:07:16 | 10:07:16 |
| M25-29 | 2 | 9:35:44 | 9:39:18 | 9:42:52 |
| M30-34 | 2 | 8:43:52 | 8:49:41 | 8:55:31 |
| M35-39 | 3 | 8:50:53 | 8:58:36 | 9:02:56 |
| M40-44 | 4 | 8:48:51 | 8:59:52 | 9:08:42 |
| M45-49 | 4 | 9:06:03 | 9:20:14 | 9:30:28 |
| M50-54 | 3 | 9:32:57 | 9:40:48 | 9:46:11 |
| M55-59 | 2 | 9:45:57 | 9:46:22 | 9:46:47 |
| M60-64 | 1 | 10:27:49 | 10:27:49 | 10:27:49 |
| M65-69 | 1 | 11:27:51 | 11:27:51 | 11:27:51 |
| F18-24 | 1 | 10:37:20 | 10:37:20 | 10:37:20 |
| F25-29 | 1 | 10:15:03 | 10:15:03 | 10:15:03 |
| F30-34 | 1 | 10:04:18 | 10:04:18 | 10:04:18 |
| F35-39 | 2 | 9:46:30 | 9:50:42 | 9:54:54 |
| F40-44 | 2 | 9:52:57 | 10:02:20 | 10:11:44 |
| F45-49 | 2 | 9:56:34 | 10:15:58 | 10:35:22 |
| F50-54 | 2 | 10:56:23 | 11:01:26 | 11:06:30 |
| F55-59 | 1 | 10:55:11 | 10:55:11 | 10:55:11 |
| F60-64 | 1 | 11:52:39 | 11:52:39 | 11:52:39 |
| F65-69 | 1 | 14:17:56 | 14:17:56 | 14:17:56 |
Taking my calculation for the likely slot allocation, the above table shows the automatic qualifying times for this year’s race (assuming no roll down). Final times will vary where slots and roll down differ. You can compare this with other races on my Kona qualification page.

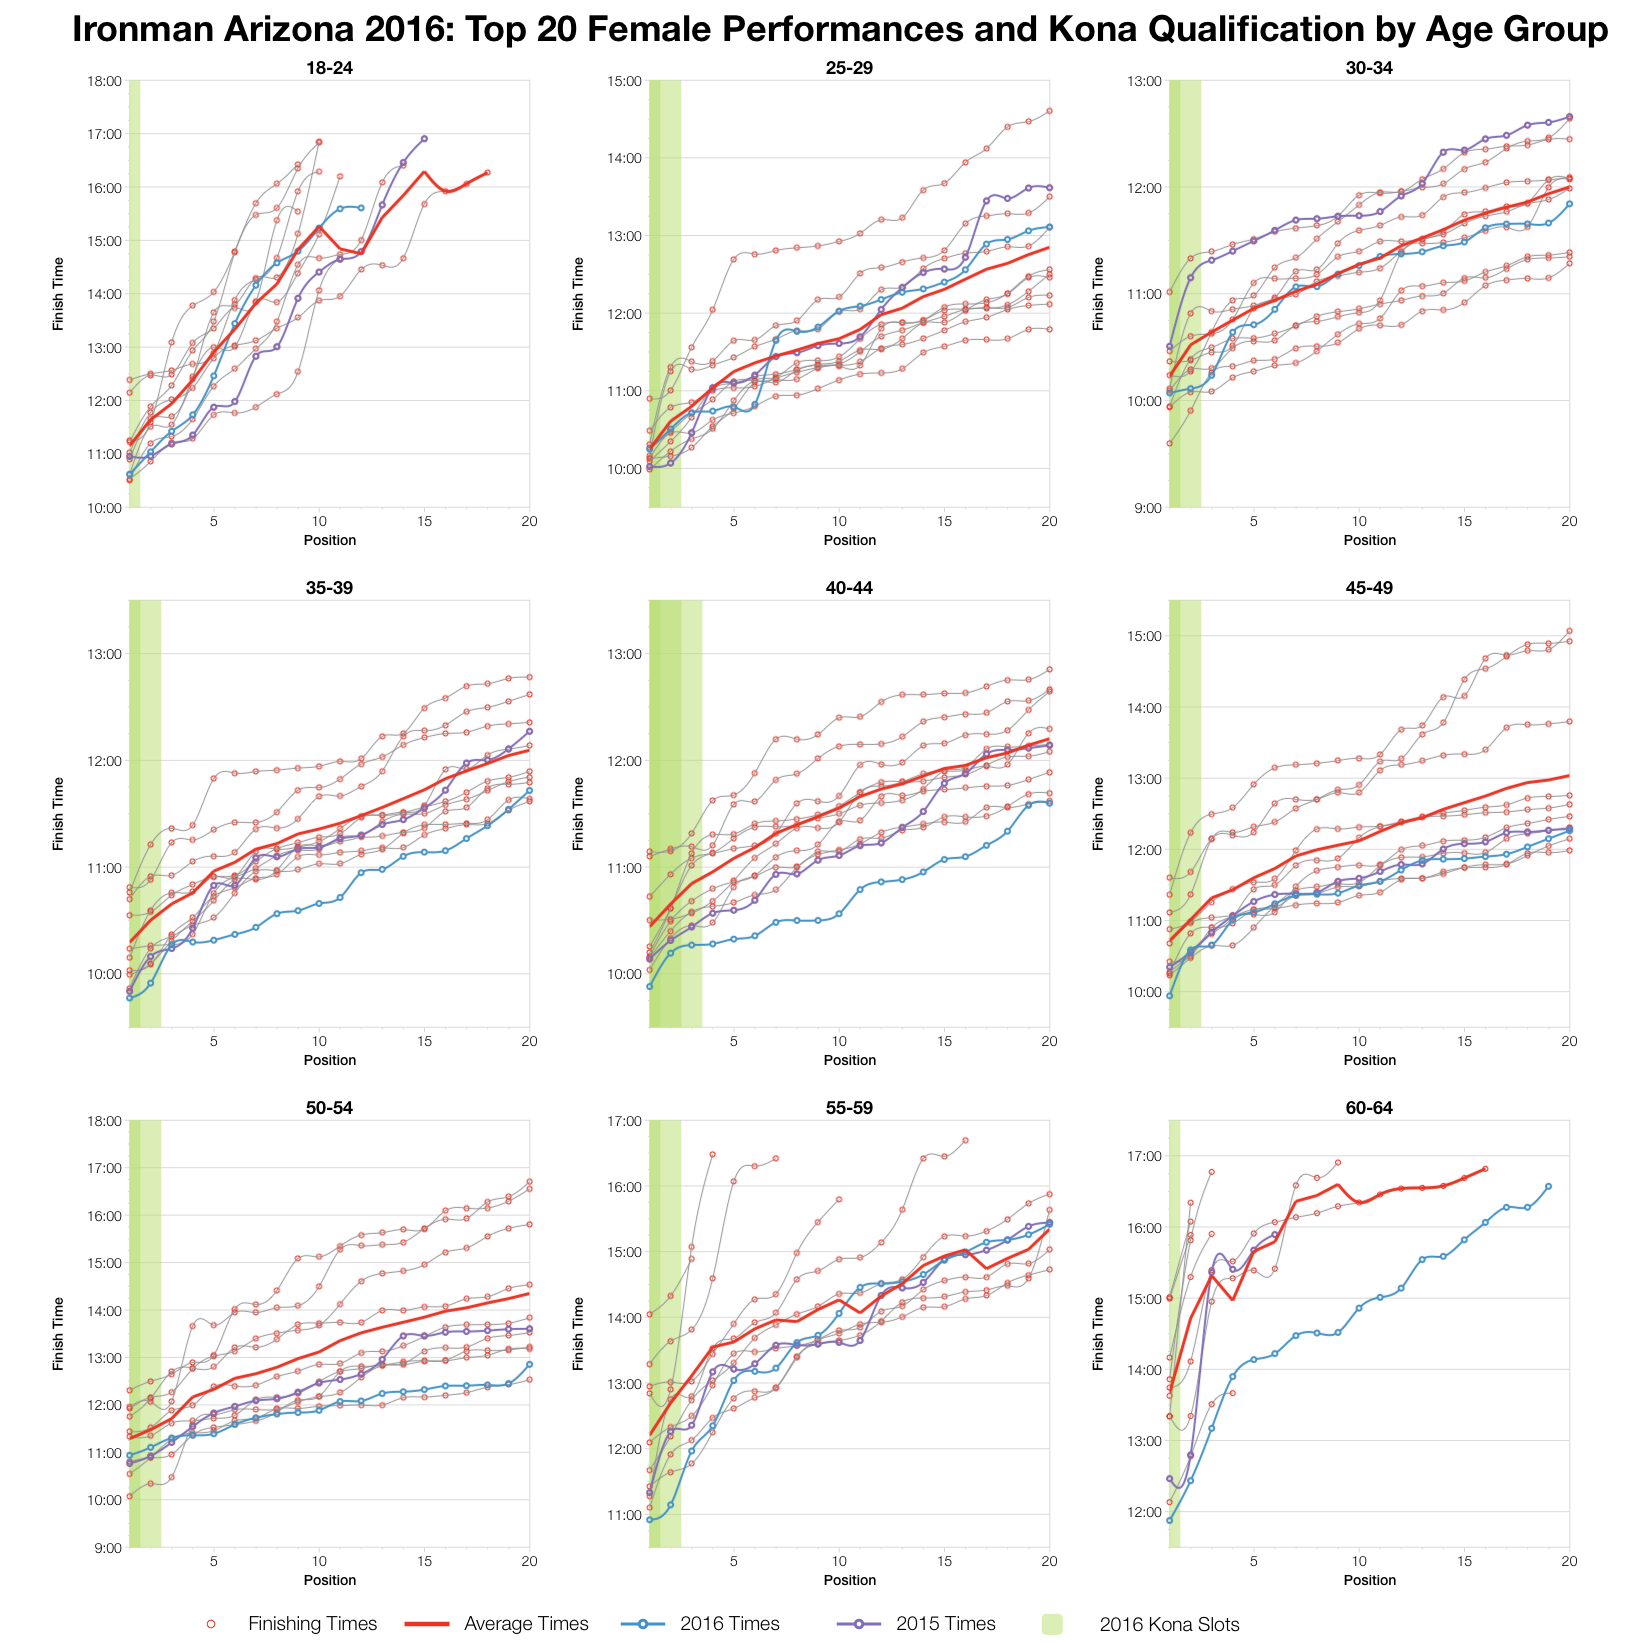
There is an age divide in the top twenties. For those under 30 the times appear to have been average or slower, while for those over 30 the trend is average or faster. In some of the age groups these are the fastest top twenty times seen. That certainly fits with a record breaking year on the course.
Again, there appears to have been a division in the age group field. There were the highly competitive Kona chasers who produced very fast times. Good conditions on a fast course worked well for them. They were balanced out by a large number of middle to back of pack athletes who held the averages in place.
You can access a spreadsheet of the full results and splits from Ironman Arizona 2016 on my Google Drive.


