We move to the US for the second Ironman analysis for the weekend – this time Ironman Lake Placid. Another long established and popular race with the regular 40 Kona slots on offer to age group athletes. Results from the 2017 race look to be typical for the course.
A quick note, that the 2014 race is excluded from this analysis due to irregularities with the results set.
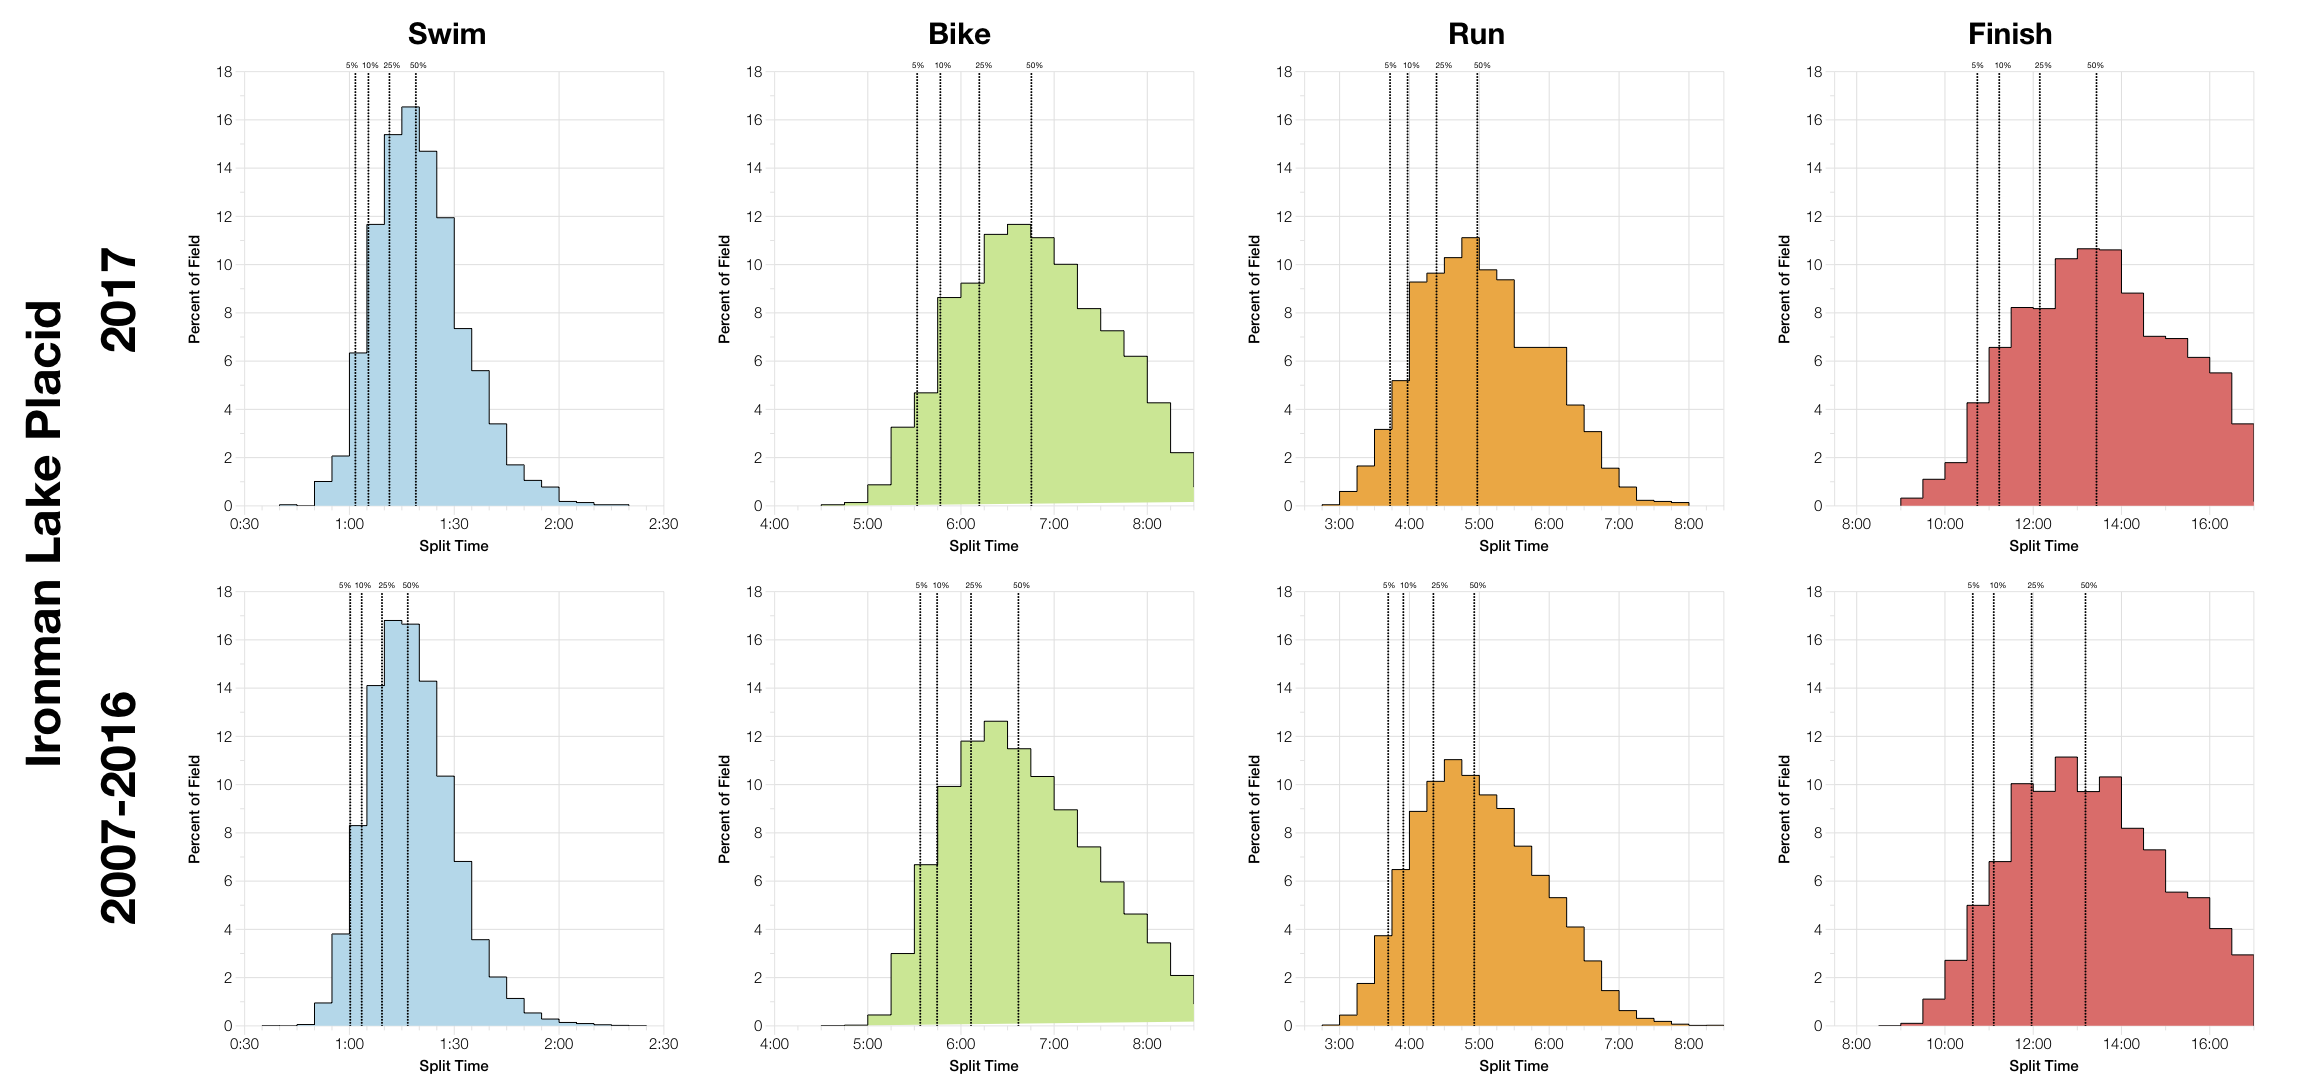
The split distributions from this year’s race are very similar to those from the previous decade. The bike median comes out slightly slower, although further up in the race there’s little difference in the splits. So, 2017 is very slightly slower at the median, but this seems to reflect slower performances in the mid to back of pack.
| Listed Athletes | Swim Finish | Swim DNS/DNF | Bike Finish | Bike DNF | Run Finish | Run DNF | Overall DNS/DNF | |
|---|---|---|---|---|---|---|---|---|
| 2002 | 2062 | 1834 | 11.1% | 1773 | 3.3% | 1624 | 8.4% | 20.6% |
| 2003 | 2066 | 1829 | 11.5% | 1763 | 3.6% | 1671 | 5.2% | 19% |
| 2004 | 2277 | 1939 | 14.8% | 1921 | 0.9% | 1882 | 2% | 17.3% |
| 2006 | 2446 | 2141 | 12.5% | 2108 | 1.5% | 2036 | 3.4% | 16.7% |
| 2007 | 2528 | 2177 | 13.9% | 2138 | 1.8% | 2051 | 4.1% | 18.9% |
| 2008 | 2587 | 2305 | 10.9% | 2259 | 2% | 2193 | 2.9% | 15.2% |
| 2009 | 2566 | 2239 | 12.7% | 2159 | 3.6% | 2051 | 5% | 20.1% |
| 2010 | 3013 | 2536 | 15.8% | 2551 | % | 2471 | 3.1% | 18% |
| 2011 | 2902 | 2459 | 15.3% | 2430 | 1.2% | 2356 | 3% | 18.8% |
| 2012 | 2896 | 2555 | 11.8% | 2435 | 4.7% | 2280 | 6.4% | 21.3% |
| 2013 | 2536 | 2477 | 2.3% | 2426 | 2.1% | 2342 | 3.5% | 7.6% |
| 2014 | 2762 | 1738 | 37.1% | 2362 | % | 2293 | 2.9% | 17% |
| 2015 | 2798 | 2300 | 17.8% | 2235 | 2.8% | 2093 | 6.4% | 25.2% |
| 2016 | 3055 | 2484 | 18.7% | 2387 | 3.9% | 2268 | 5% | 25.8% |
| 2017 | 2333 | 2328 | 0.2% | 2269 | 2.5% | 2195 | 3.3% | 5.9% |
We’ve got good quality DNS/DNF numbers this year without confusion over who started. The main points to note here are that both bike and run DNF rates are on the lower end for this race. Drop outs were relatively low at this year’s event which suggests conditions were moderate.
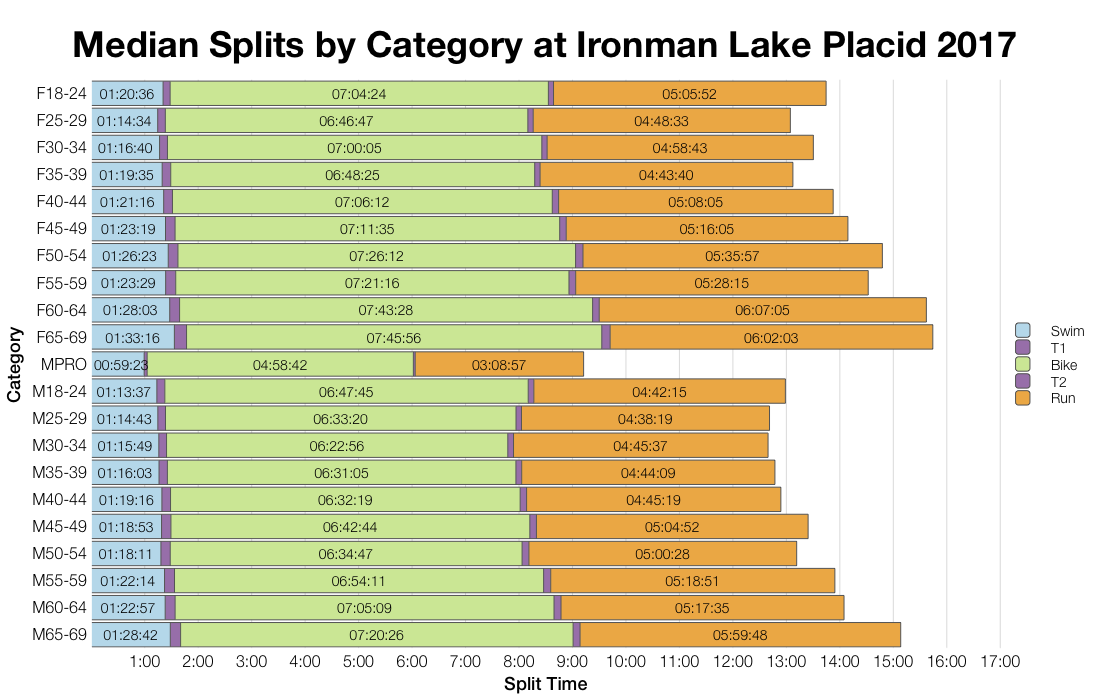
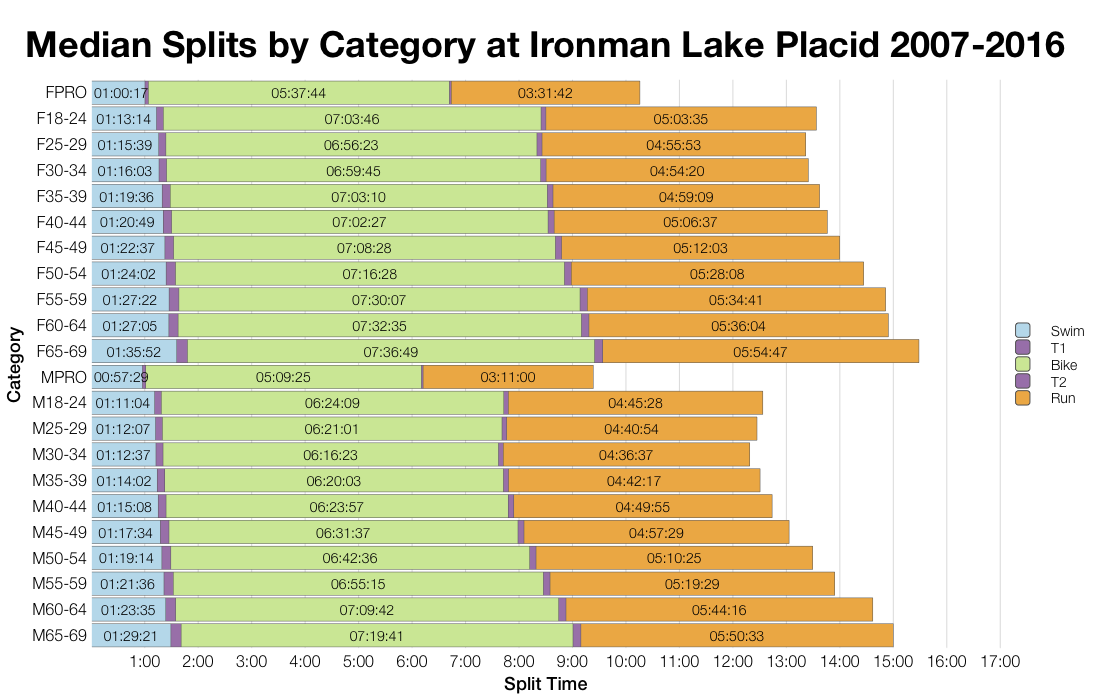
Given the similarities between this year and past results there are no major patterns in the age group median data. Splits aren’t too dissimilar to the aggregated historical data and while they vary it’s not universal across divisions.
| Count | Percentage | |
|---|---|---|
| United States | 2263 | 82.1 |
| Canada | 253 | 9.2 |
| United Kingdom | 47 | 1.7 |
| France | 13 | 0.5 |
| Mexico | 12 | 0.4 |
| China | 11 | 0.4 |
| Japan | 9 | 0.3 |
| Philippines | 8 | 0.3 |
| Venezuela | 7 | 0.3 |
| Ireland | 7 | 0.3 |
| Country | Percentage of Slots | Percentage of Field |
|---|---|---|
| United States | 60.0 | 82.1 |
| Canada | 22.5 | 9.2 |
| Czech Republic | 5.0 | 0.1 |
| Dominican Republic | 2.5 | 0.2 |
| Belgium | 2.5 | 0.1 |
| France | 2.5 | 0.5 |
| India | 2.5 | 0.2 |
| Netherlands | 2.5 | 0.1 |
As with most US races the majority of athletes are North American, not a huge surprise. The US takes most of the slots, but Canada punches above its weight based on entry numbers.
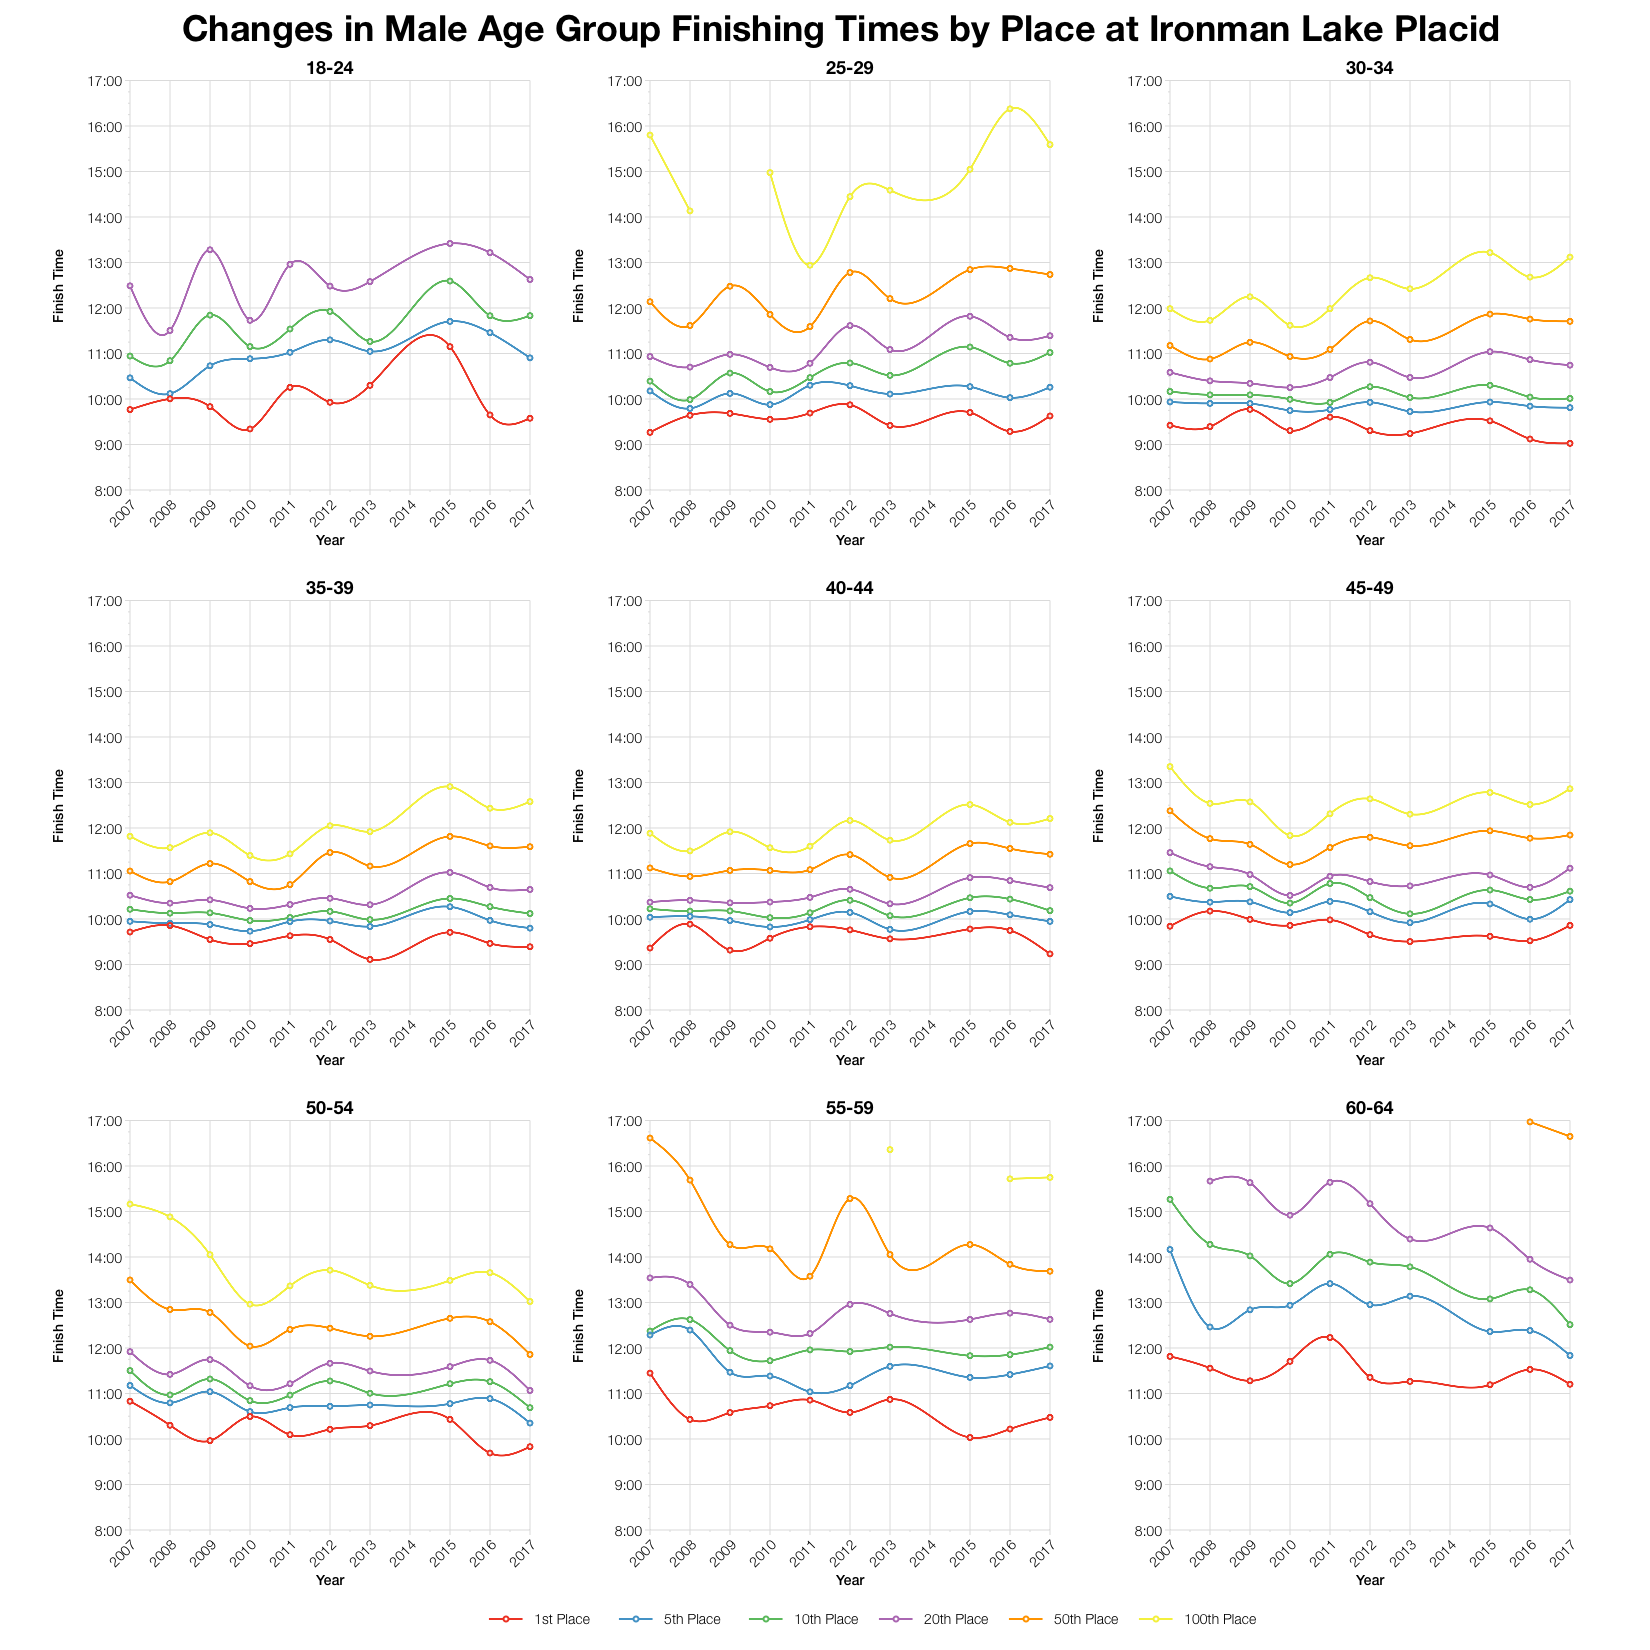
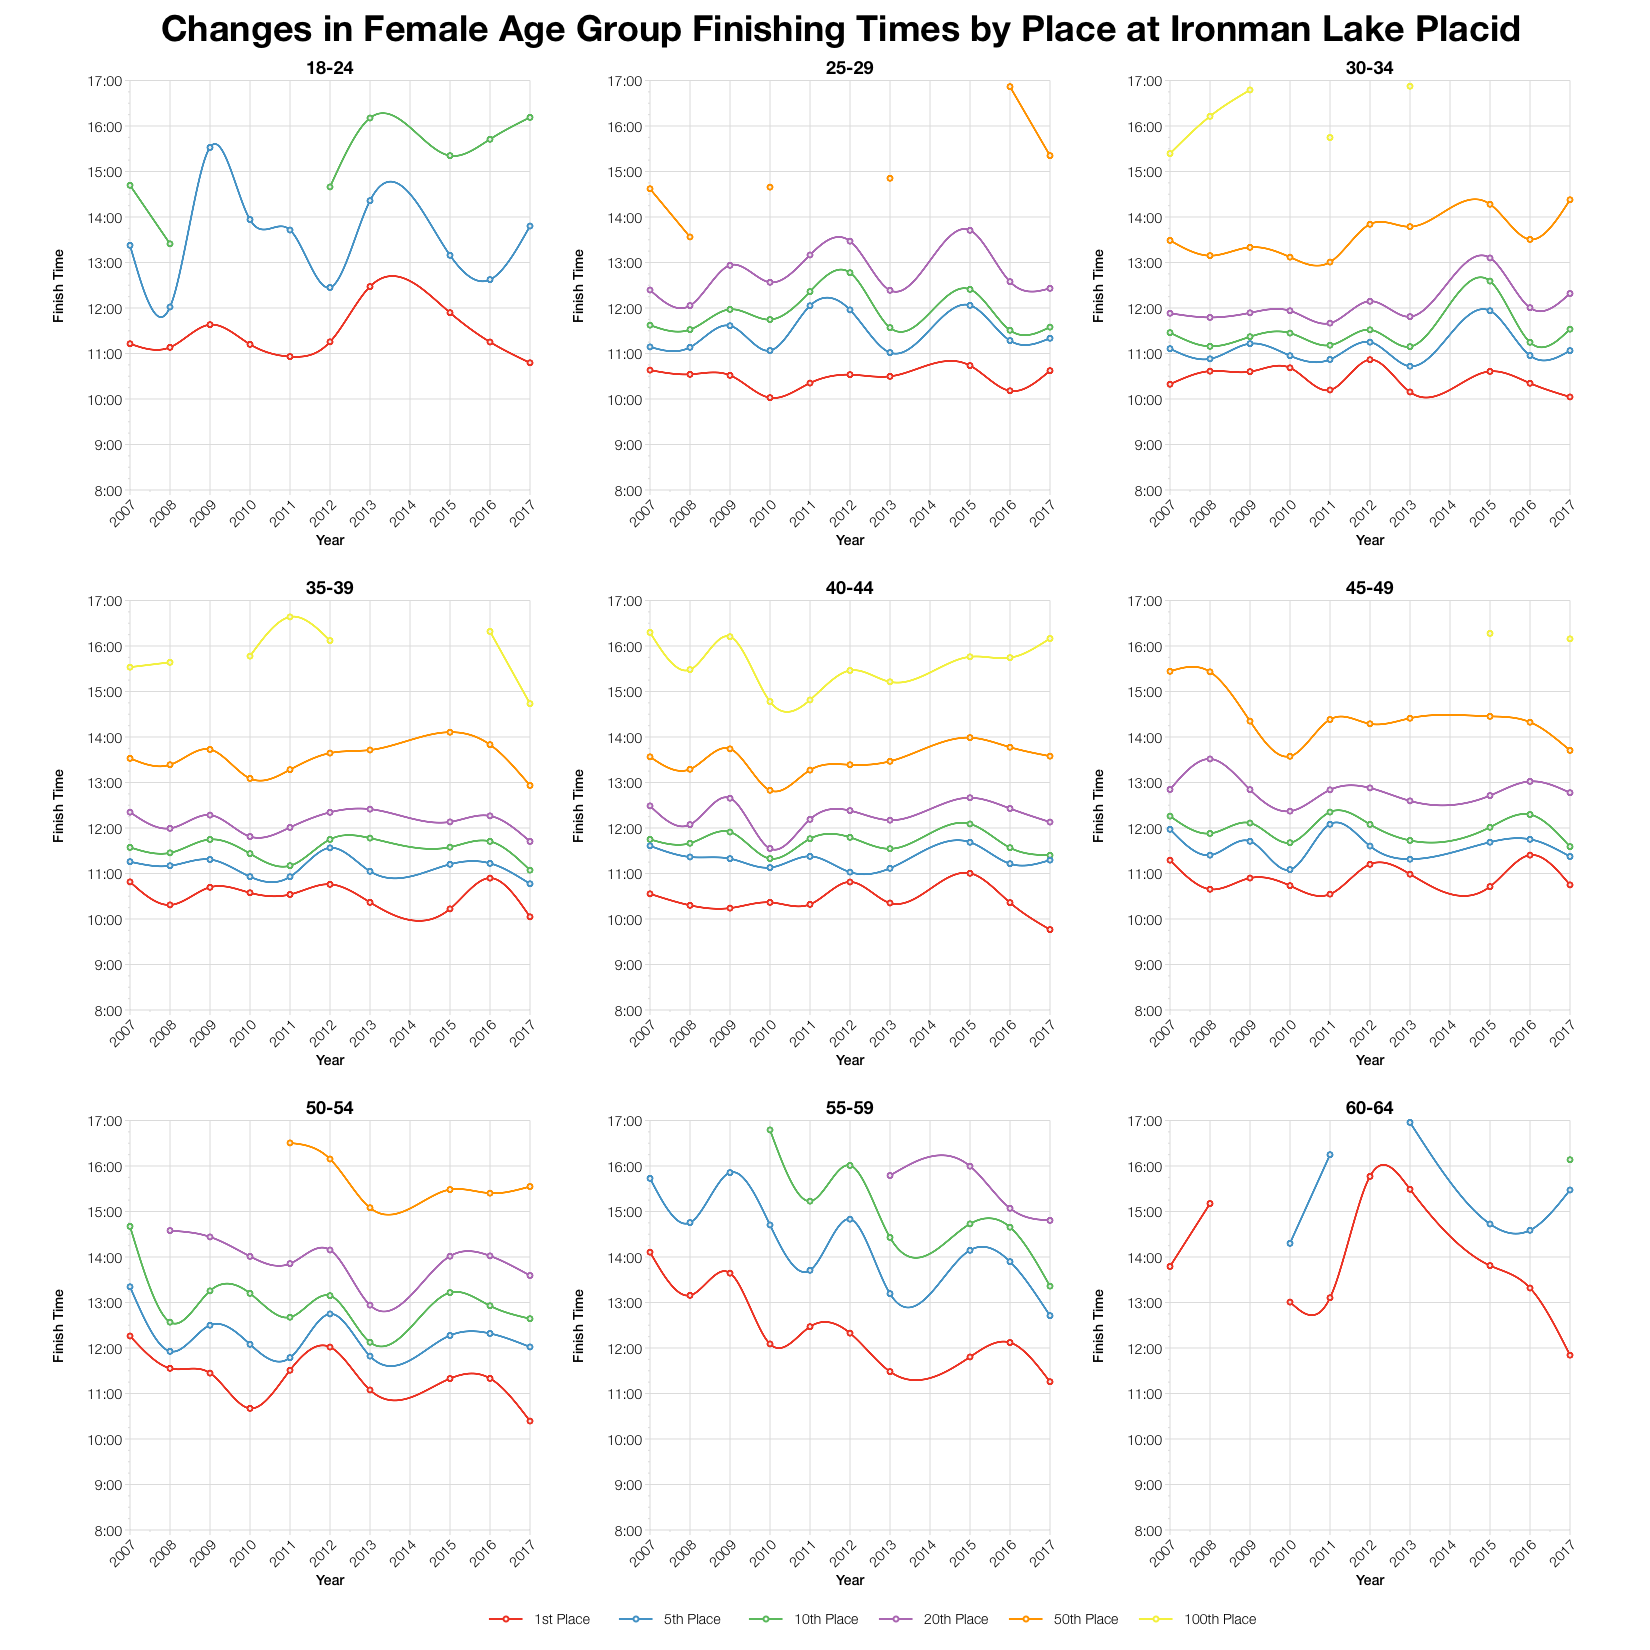
There’s quite a lot of variance in times by age group and position over previous year’s results. Again, no clear pattern across all the age groups. That said, variations are generally quite small and mostly within the bounds of past races This puts this year’s race somewhere in the middle of Lake Placid results.
| Slots | Winner | Average Kona Qualifier | Final Qualifier | |
|---|---|---|---|---|
| M18-24 | 1 | 9:34:41 | 9:34:41 | 9:34:41 |
| M25-29 | 2 | 9:37:37 | 9:39:10 | 9:40:43 |
| M30-34 | 2 | 9:01:34 | 9:11:38 | 9:21:42 |
| M35-39 | 3 | 9:23:21 | 9:30:47 | 9:40:18 |
| M40-44 | 3 | 9:13:57 | 9:26:34 | 9:41:35 |
| M45-49 | 3 | 9:51:35 | 9:56:59 | 10:03:20 |
| M50-54 | 3 | 9:49:47 | 9:56:19 | 10:03:11 |
| M55-59 | 2 | 10:28:29 | 10:31:30 | 10:34:31 |
| M60-64 | 2 | 11:12:15 | 11:13:10 | 11:14:06 |
| M65-69 | 1 | 11:44:53 | 11:44:53 | 11:44:53 |
| M70-74 | 1 | 12:56:01 | 12:56:01 | 12:56:01 |
| M75-79 | 1 | 14:06:53 | 14:06:53 | 14:06:53 |
| F18-24 | 1 | 10:47:42 | 10:47:42 | 10:47:42 |
| F25-29 | 1 | 10:37:18 | 10:37:18 | 10:37:18 |
| F30-34 | 2 | 10:02:41 | 10:21:35 | 10:40:29 |
| F35-39 | 2 | 10:02:50 | 10:05:50 | 10:08:51 |
| F40-44 | 2 | 9:46:00 | 10:13:31 | 10:41:03 |
| F45-49 | 2 | 10:44:57 | 10:45:17 | 10:45:37 |
| F50-54 | 2 | 10:23:39 | 10:53:38 | 11:23:37 |
| F55-59 | 1 | 11:15:28 | 11:15:28 | 11:15:28 |
| F60-64 | 1 | 11:50:32 | 11:50:32 | 11:50:32 |
| F65-69 | 1 | 13:46:17 | 13:46:17 | 13:46:17 |
| F70-74 | 1 | 16:16:37 | 16:16:37 | 16:16:37 |
Based on the results list I’ve calculated how the slots might have been allocated, actual numbers may have varied slightly. From this I can estimate an automatic qualifying time assuming no roll downs. Again, final qualifying times may vary especially when roll downs take place. You can compare this with other races on my Kona qualification page.
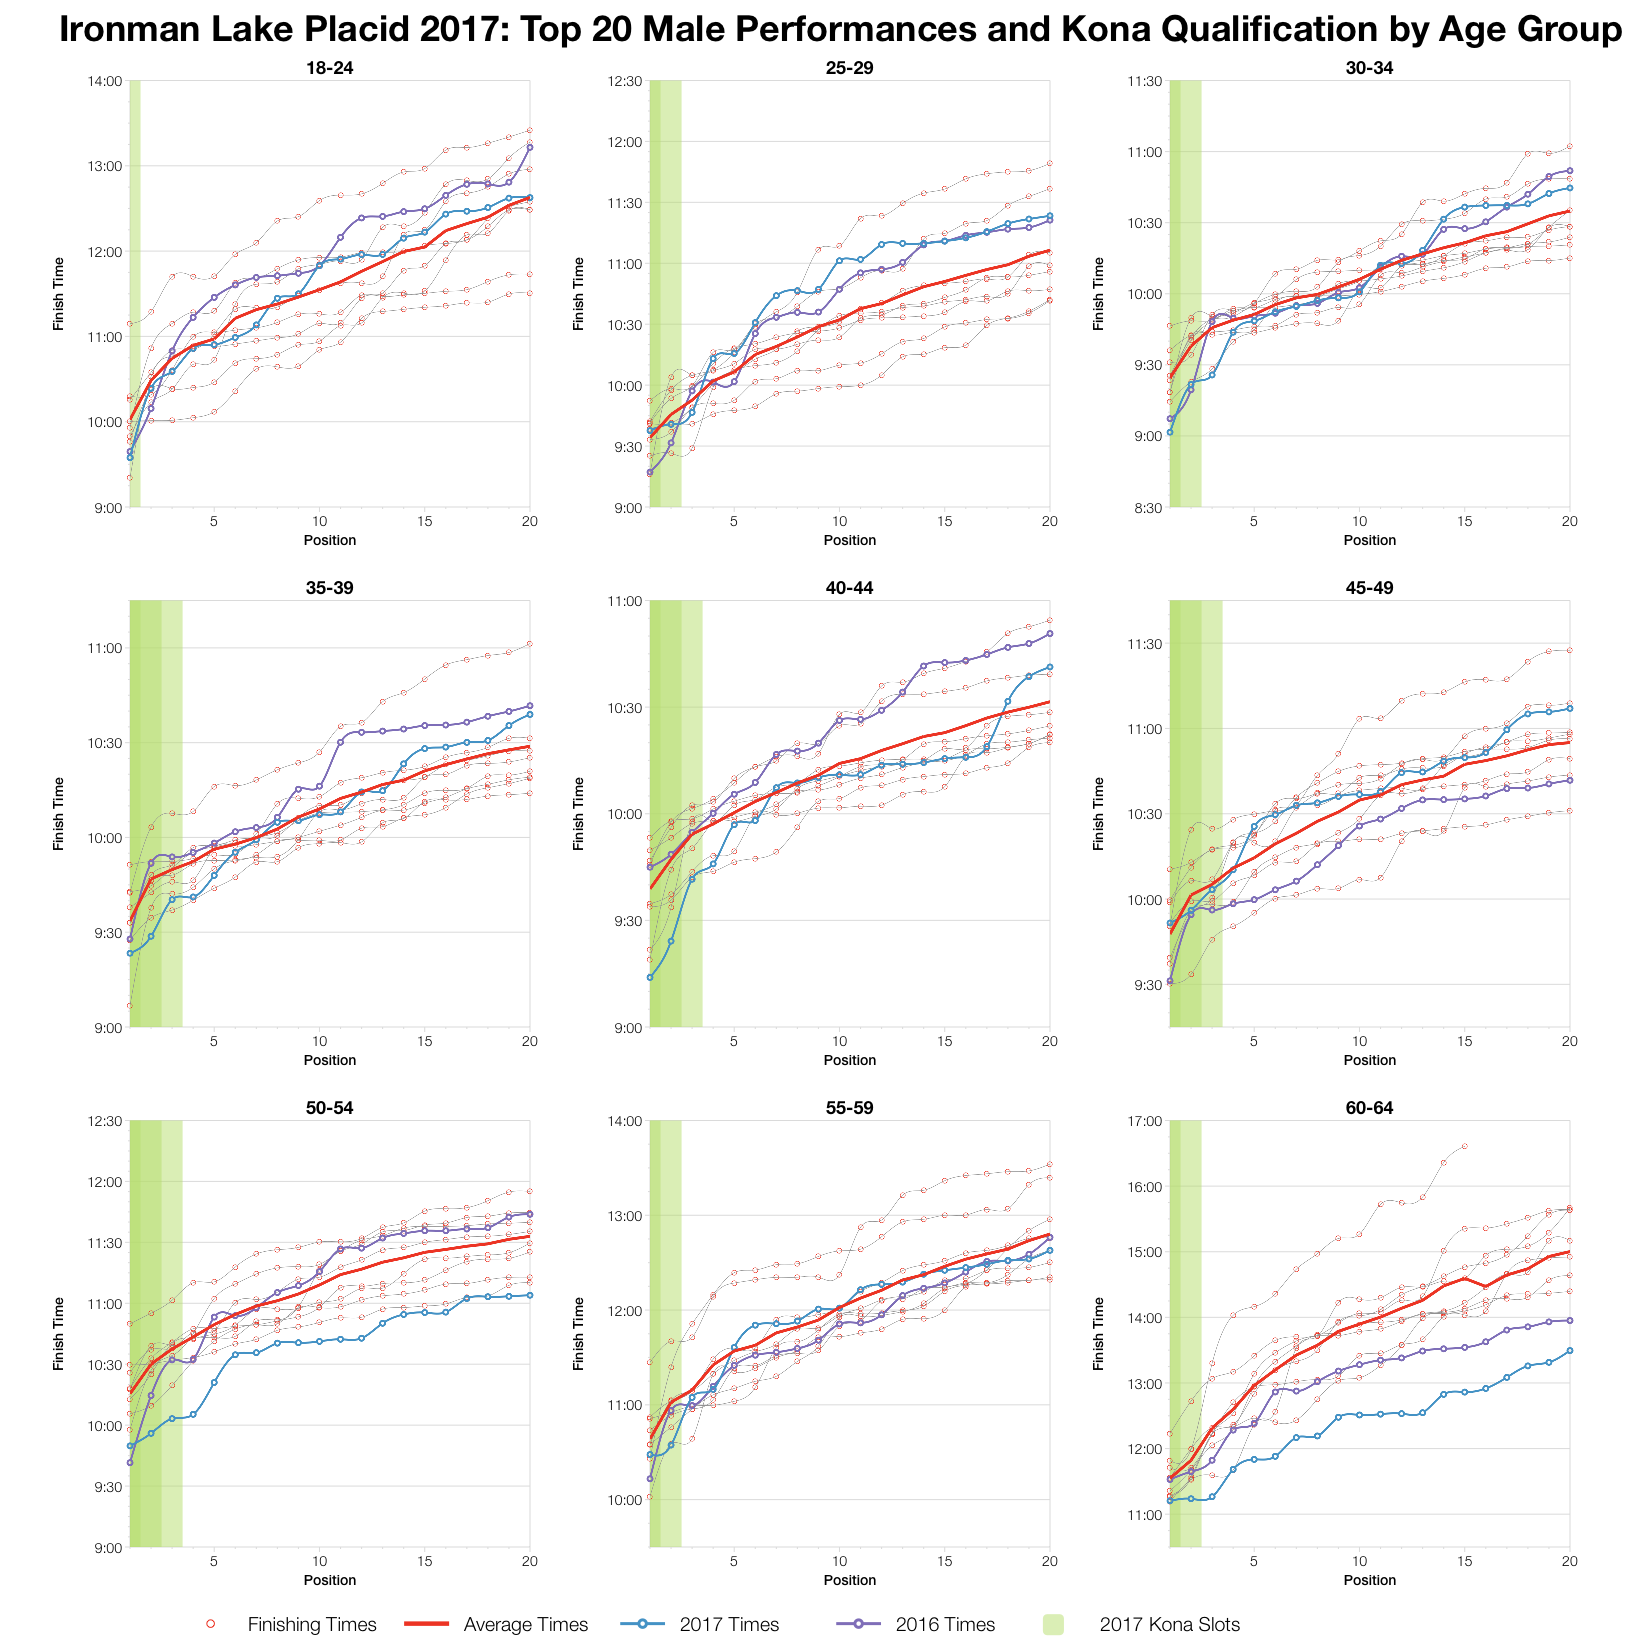
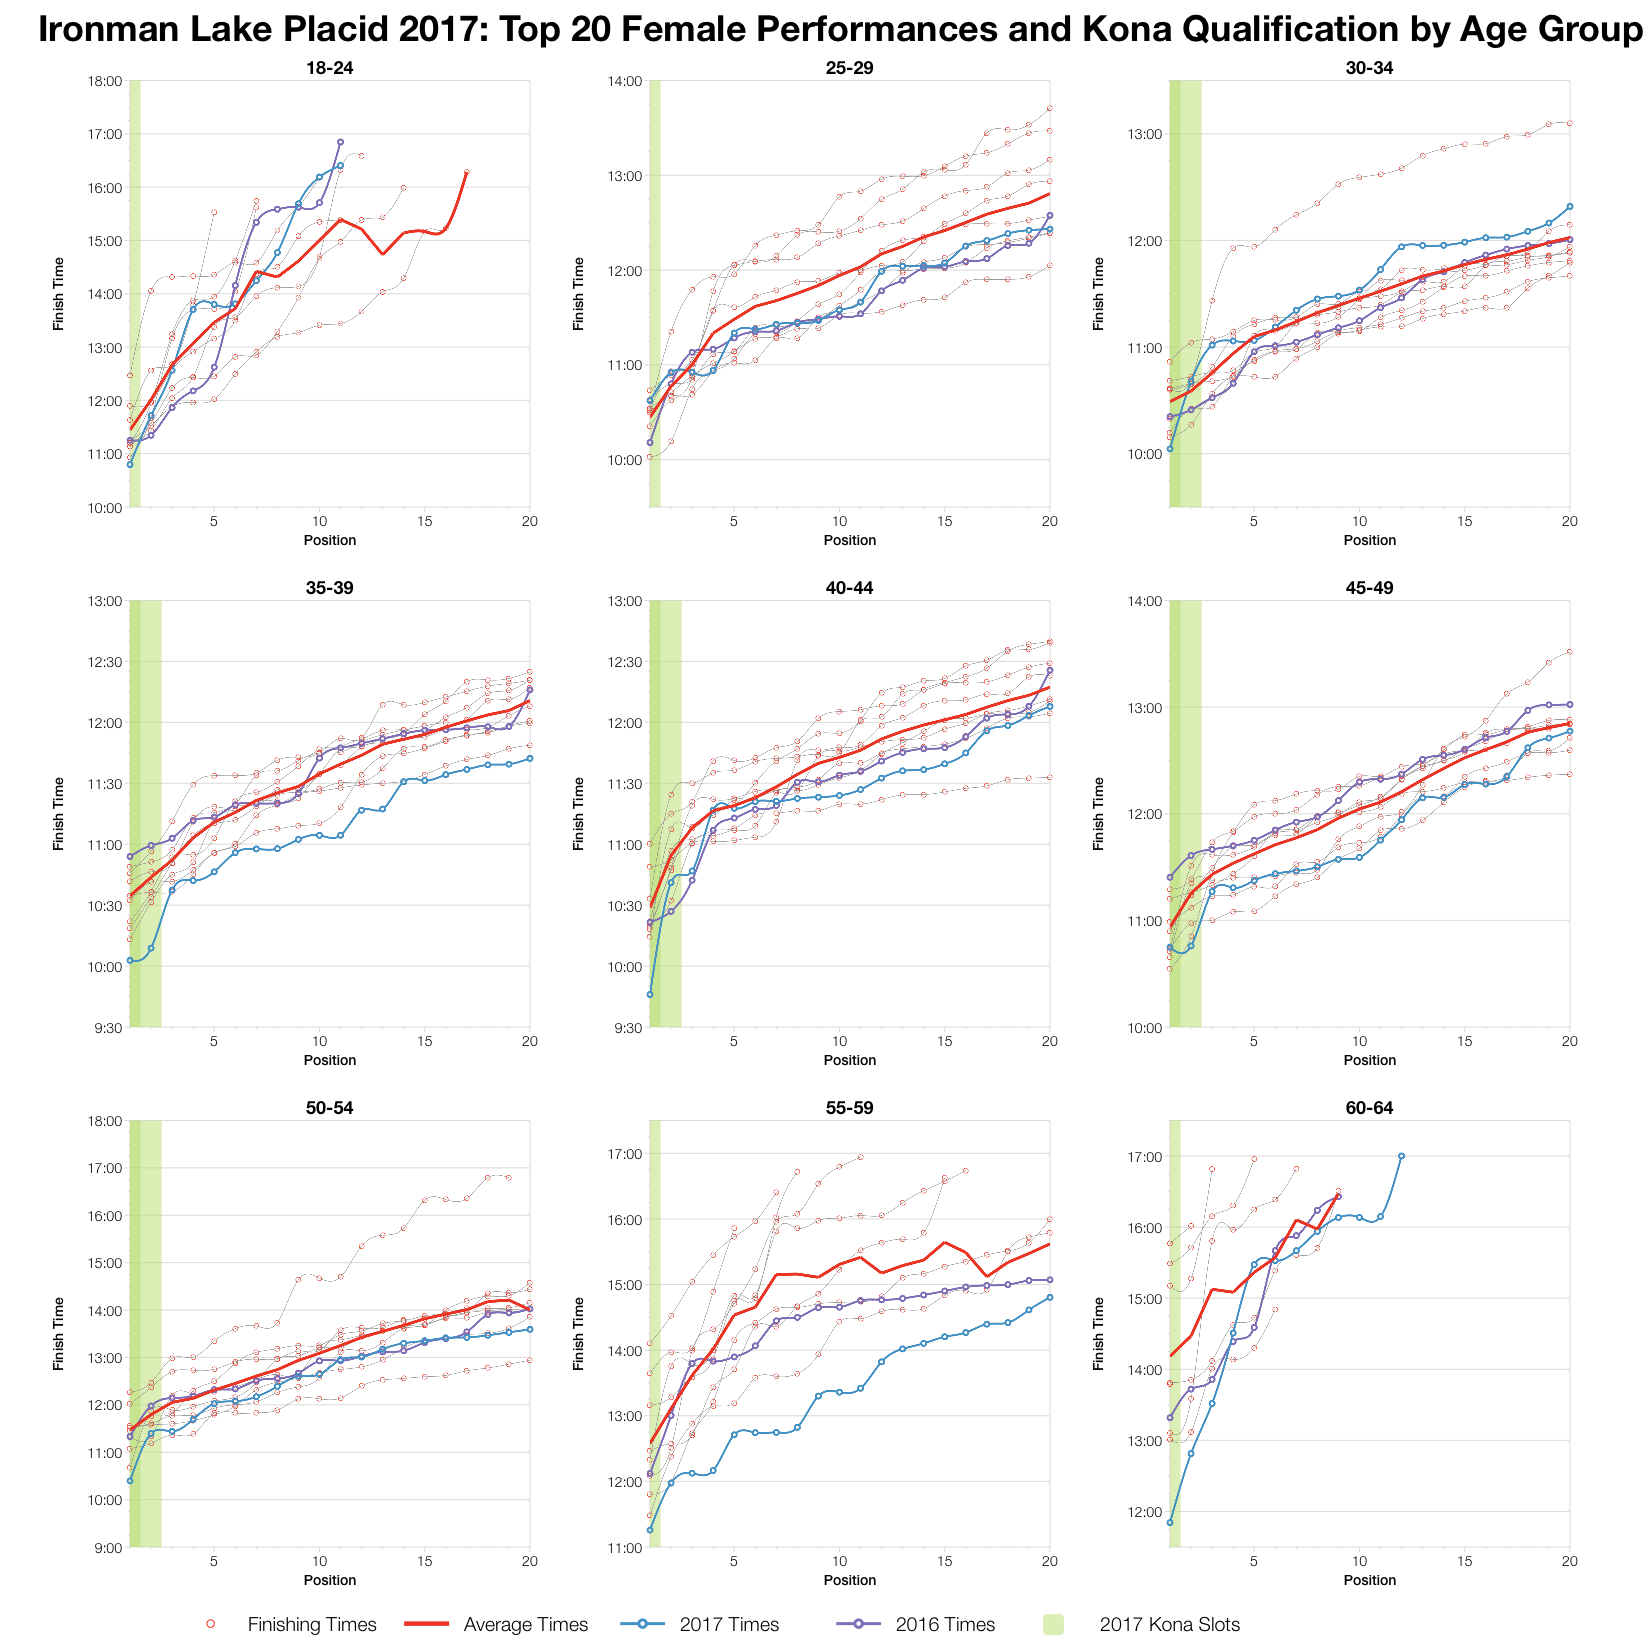
To round up the analysis, performances among the top twenty of each age group. These largely trend close to previous averages with one or two notable exceptions. The F55-59 age group performed particularly strongly while the M25-29 division trended behind most consistently. Taken as a whole this again points to a typical year of racing for the Lake Placid course.
You can access a spreadsheet of the full results from Ironman Lake Placid 2017 on my Google Drive.


