It was big weekend of Ironman racing, leaving me with three events to analyse this week. I’ll get started with Ironman Switzerland. Switzerland sits somewhere in the middle of the mainland European races, neither the fastest or slowest course in the region. It carries the standard 40 Kona slots of most qualifying races and qualification is as competitive as any other European event. Age group times at this year’s race look to be slightly slower than usual.
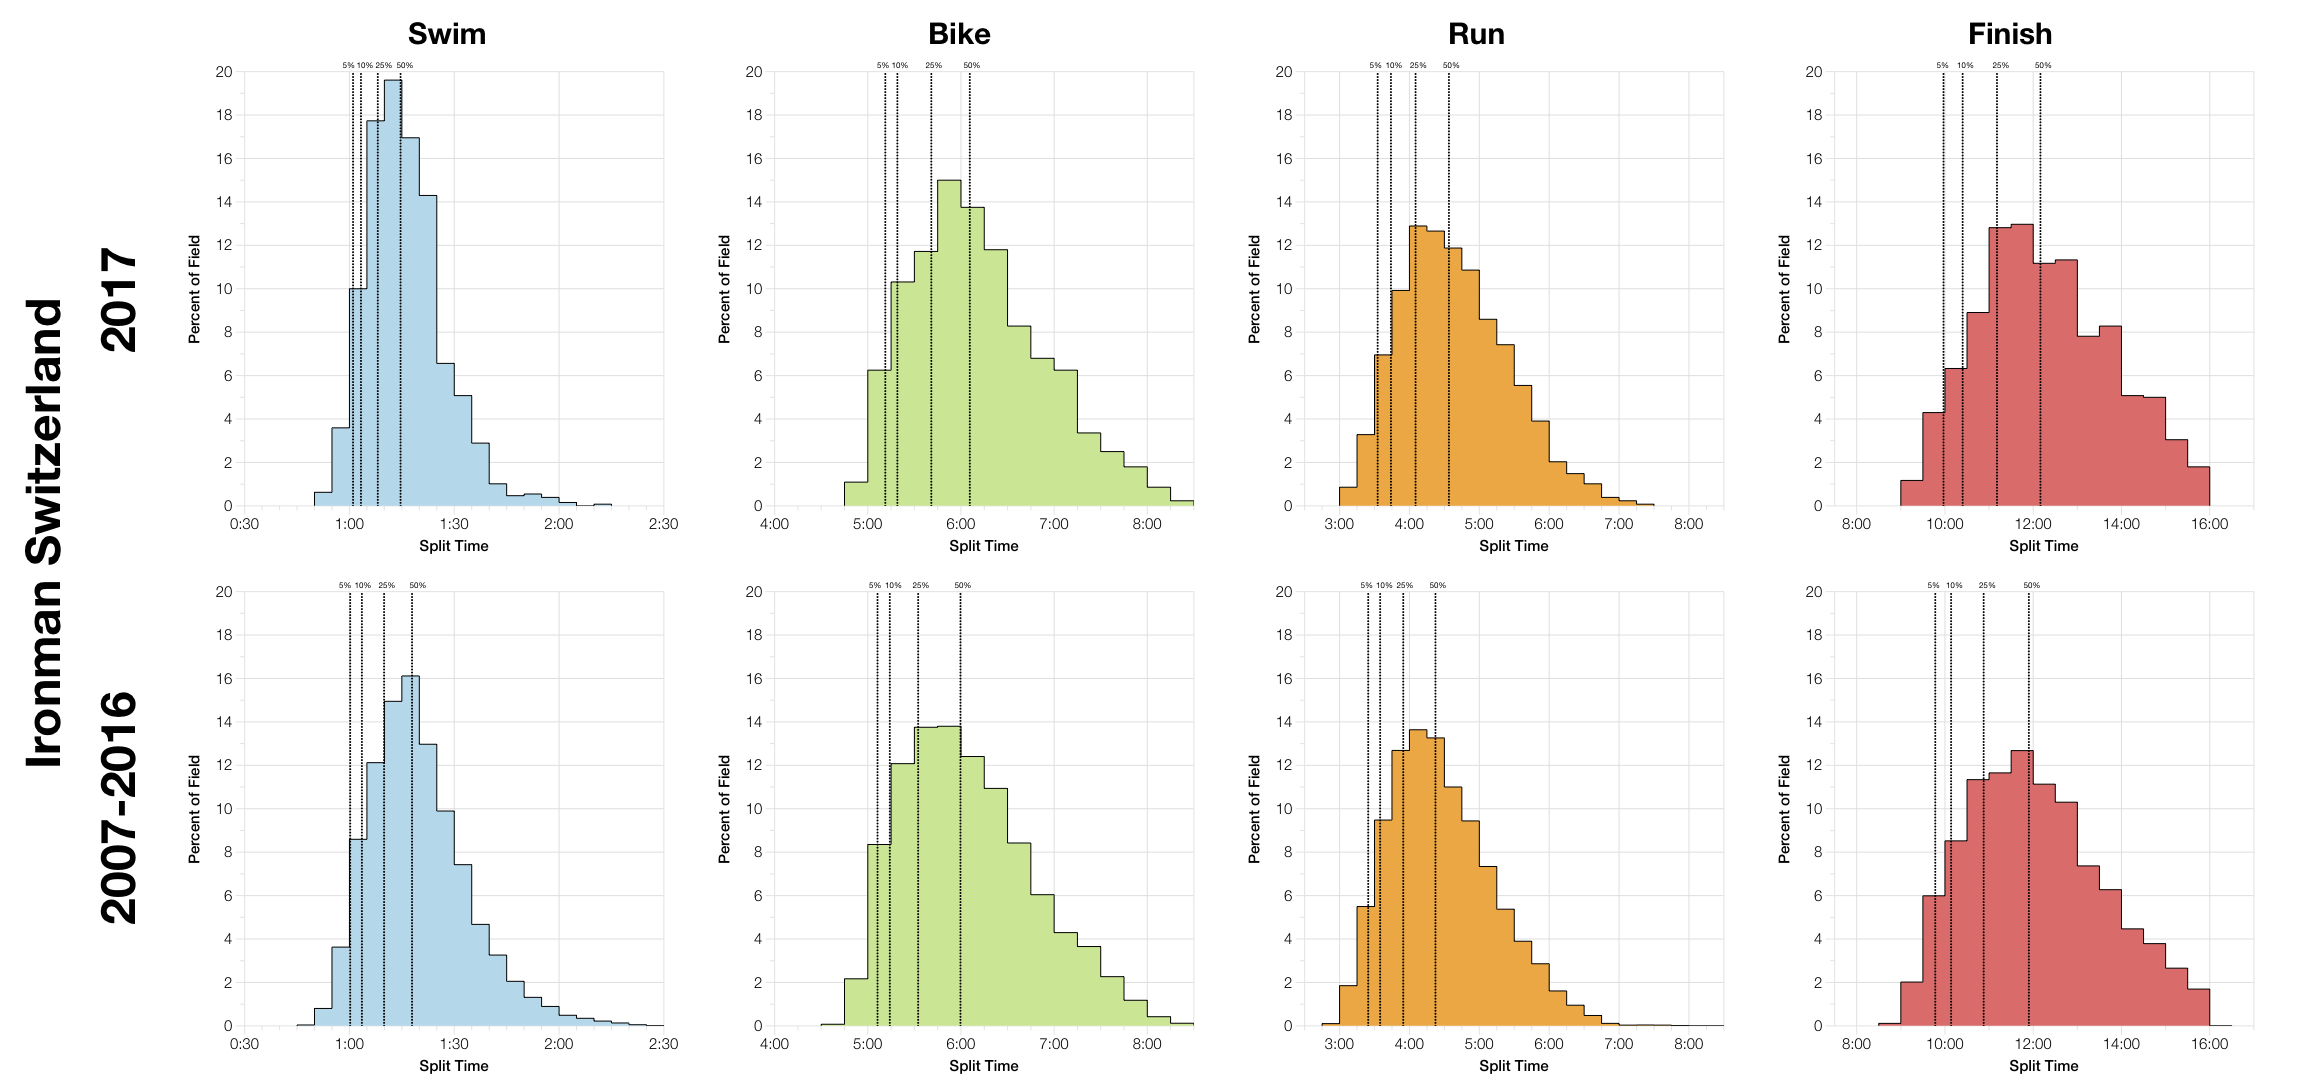
Comparing distributions shows a more tightly bunched swim with athlete out in a shorter span than usual. This is followed by a bike and run that both trend slower than the aggregate results. So overall the race comes out slower than the norm, although not by a significant margin. As is often seen, there’s a broader spread of results around the median with more finishing towards the rear of the race than in the historical date.
| Listed Athletes | Swim Finish | Swim DNS/DNF | Bike Finish | Bike DNF | Run Finish | Run DNF | Overall DNS/DNF | |
|---|---|---|---|---|---|---|---|---|
| 2005 | 1637 | 1499 | 8.4% | 1189 | 20.7% | 1291 | % | 21.1% |
| 2006 | 1827 | 1681 | 8% | 1640 | 2.4% | 1500 | 8.5% | 17.9% |
| 2007 | 1969 | 1809 | 8.1% | 1774 | 1.9% | 1640 | 7.6% | 16.6% |
| 2008 | 2631 | 2057 | 21.8% | 2020 | 1.8% | 1955 | 3.2% | 25.7% |
| 2009 | 2508 | 2092 | 16.6% | 2071 | 1% | 1984 | 4.2% | 20.9% |
| 2010 | 2676 | 2226 | 16.8% | 2250 | % | 2156 | 4.2% | 19.4% |
| 2011 | 1998 | 1759 | 12% | 1704 | 3.1% | 1600 | 6.1% | 19.9% |
| 2012 | 1534 | 1520 | 0.9% | 1480 | 2.6% | 1394 | 5.8% | 9.1% |
| 2013 | 2493 | 2171 | 12.9% | 2060 | 5.1% | 1878 | 8.8% | 24.7% |
| 2014 | 2655 | 2322 | 12.5% | 2247 | 3.2% | 2174 | 3.2% | 18.1% |
| 2015 | 2077 | 1818 | 12.5% | 1703 | 6.3% | 1590 | 6.6% | 23.4% |
| 2016 | 1583 | 1414 | 10.7% | 1367 | 3.3% | 1254 | 8.3% | 20.8% |
| 2017 | 1479 | 1476 | 0.2% | 1407 | 4.7% | 1302 | 7.5% | 12% |
Good DNF/DNS numbers again (older results merge swim DNF and DNS numbers) that show average levels for the course. Bike and run DNFs lean towards the high side, but it’s not extreme.
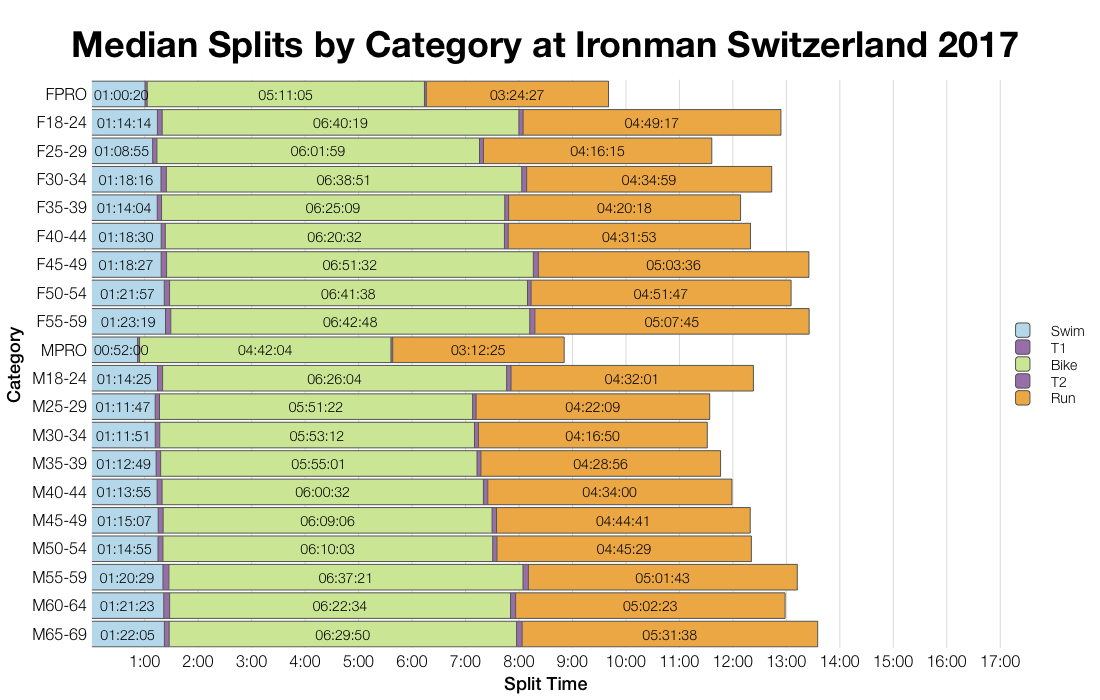
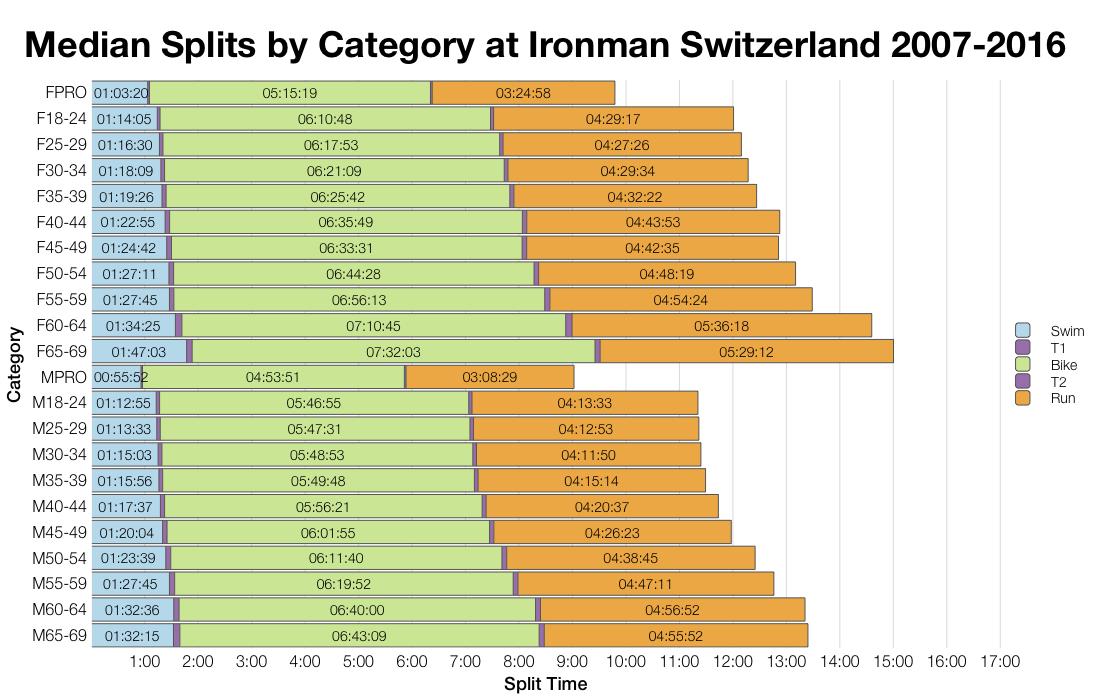
That bike and run were slower than usual this year is clear from the age group medians. The difference tends to be quite small on the bike, but larger on the run. Conversely, swim medians are faster for this year’s results.
| Count | Percentage | |
|---|---|---|
| Switzerland | 402 | 24.7 |
| United Kingdom | 236 | 14.5 |
| Germany | 190 | 11.7 |
| France | 147 | 9 |
| Italy | 105 | 6.5 |
| Spain | 83 | 5.1 |
| United States | 57 | 3.5 |
| Belgium | 42 | 2.6 |
| Finland | 36 | 2.2 |
| Austria | 30 | 1.8 |
| Country | Percentage of Slots | Percentage of Field |
|---|---|---|
| Germany | 30.0 | 11.7 |
| Switzerland | 22.5 | 24.7 |
| United Kingdom | 10.0 | 14.5 |
| Belgium | 7.5 | 2.6 |
| France | 7.5 | 9.0 |
| Russia | 5.0 | 1.3 |
| Denmark | 5.0 | 0.7 |
| Italy | 2.5 | 6.5 |
| Australia | 2.5 | 1.2 |
| Poland | 2.5 | 1.8 |
| Spain | 2.5 | 5.1 |
| Netherlands | 2.5 | 1.1 |
A wide spread of nationalities raced in Switzerland with the three largest groups taking most of the slots.
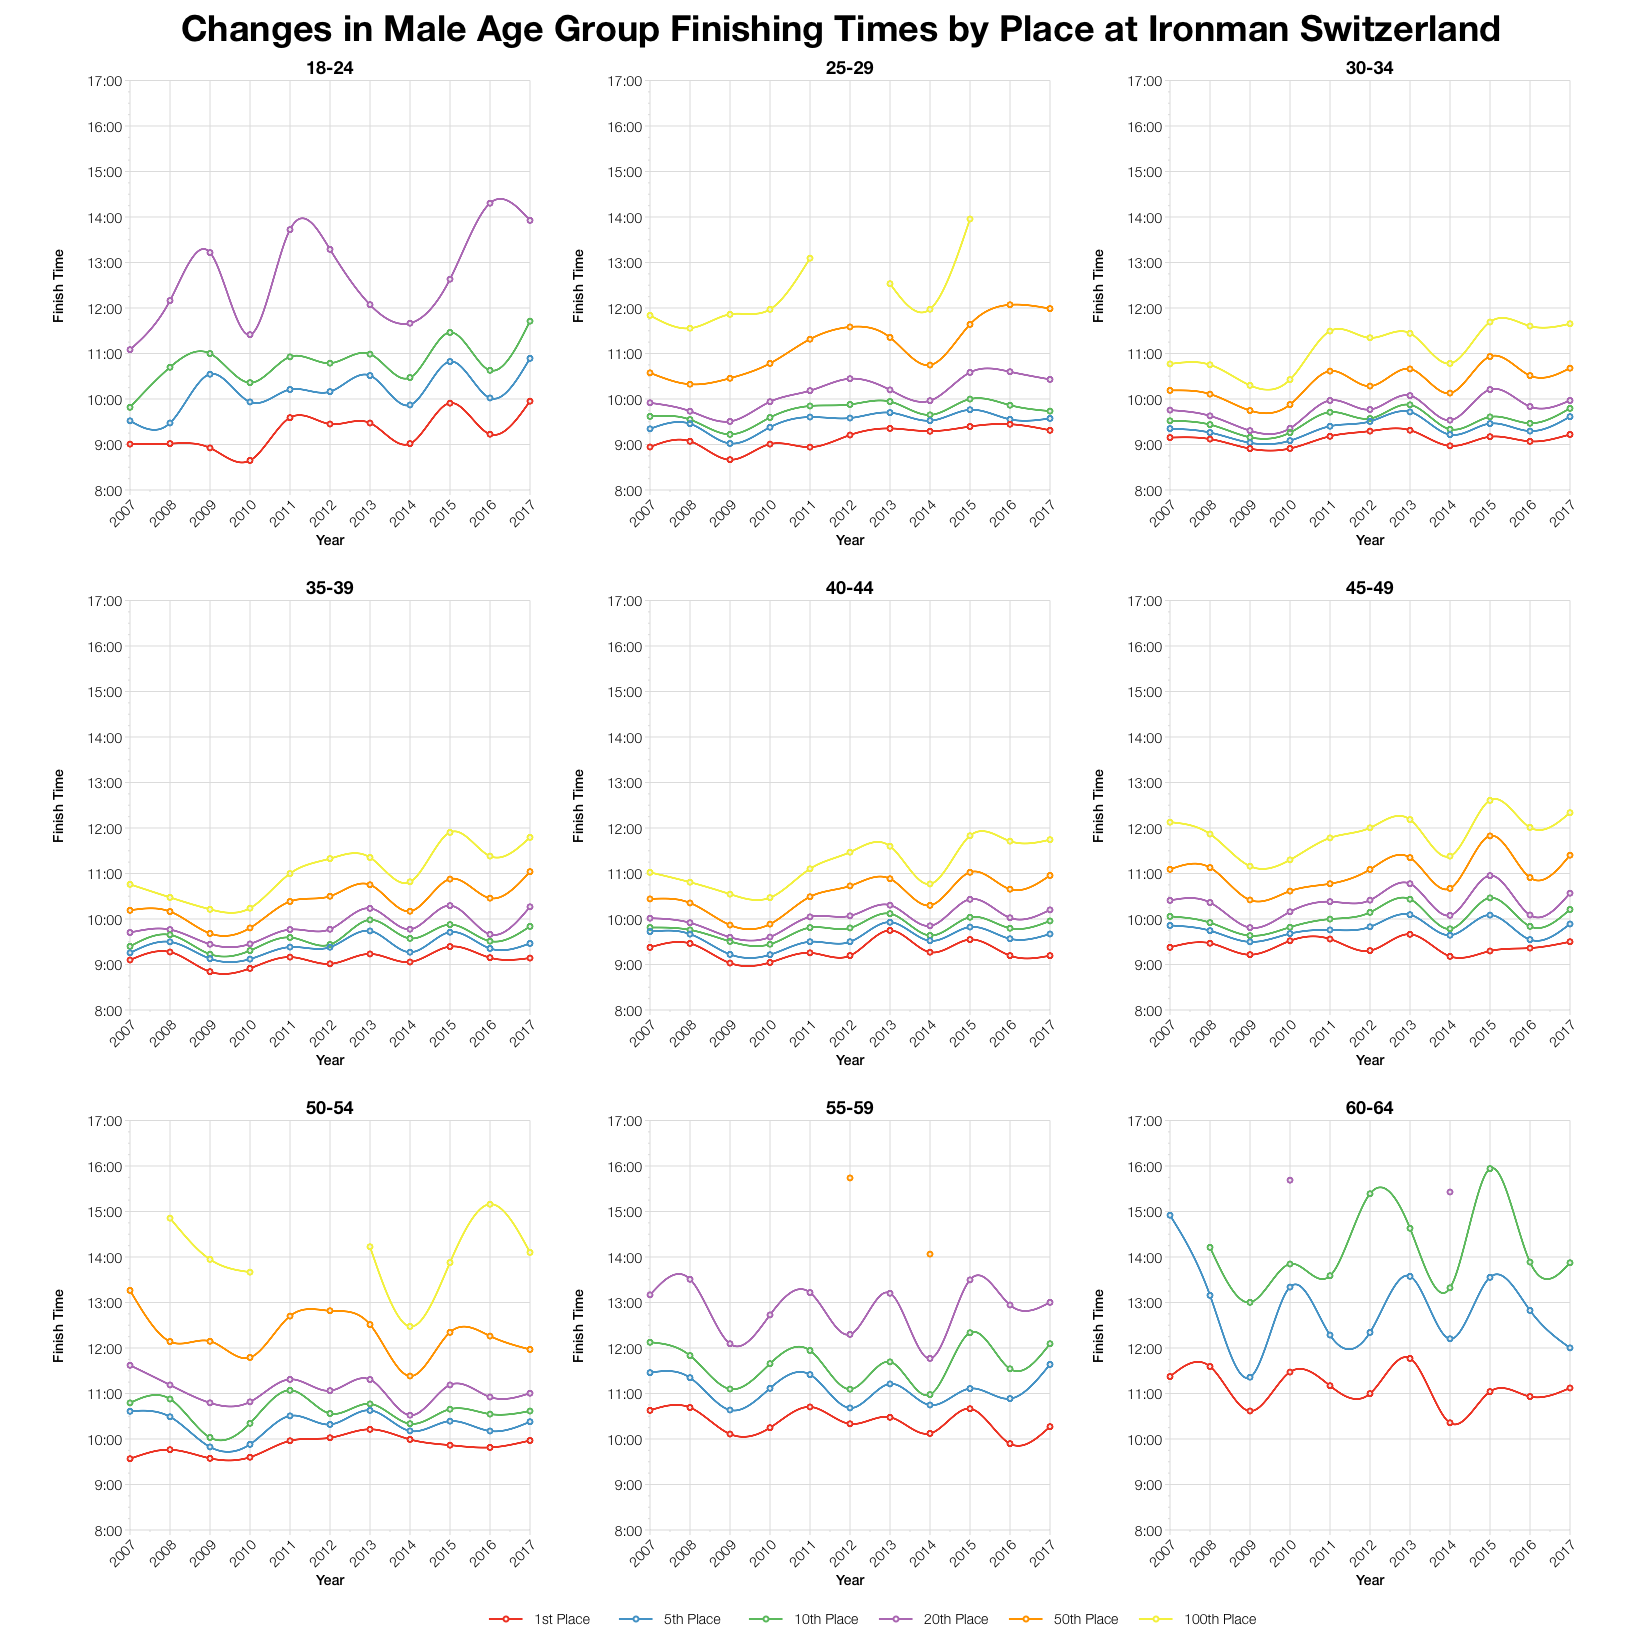
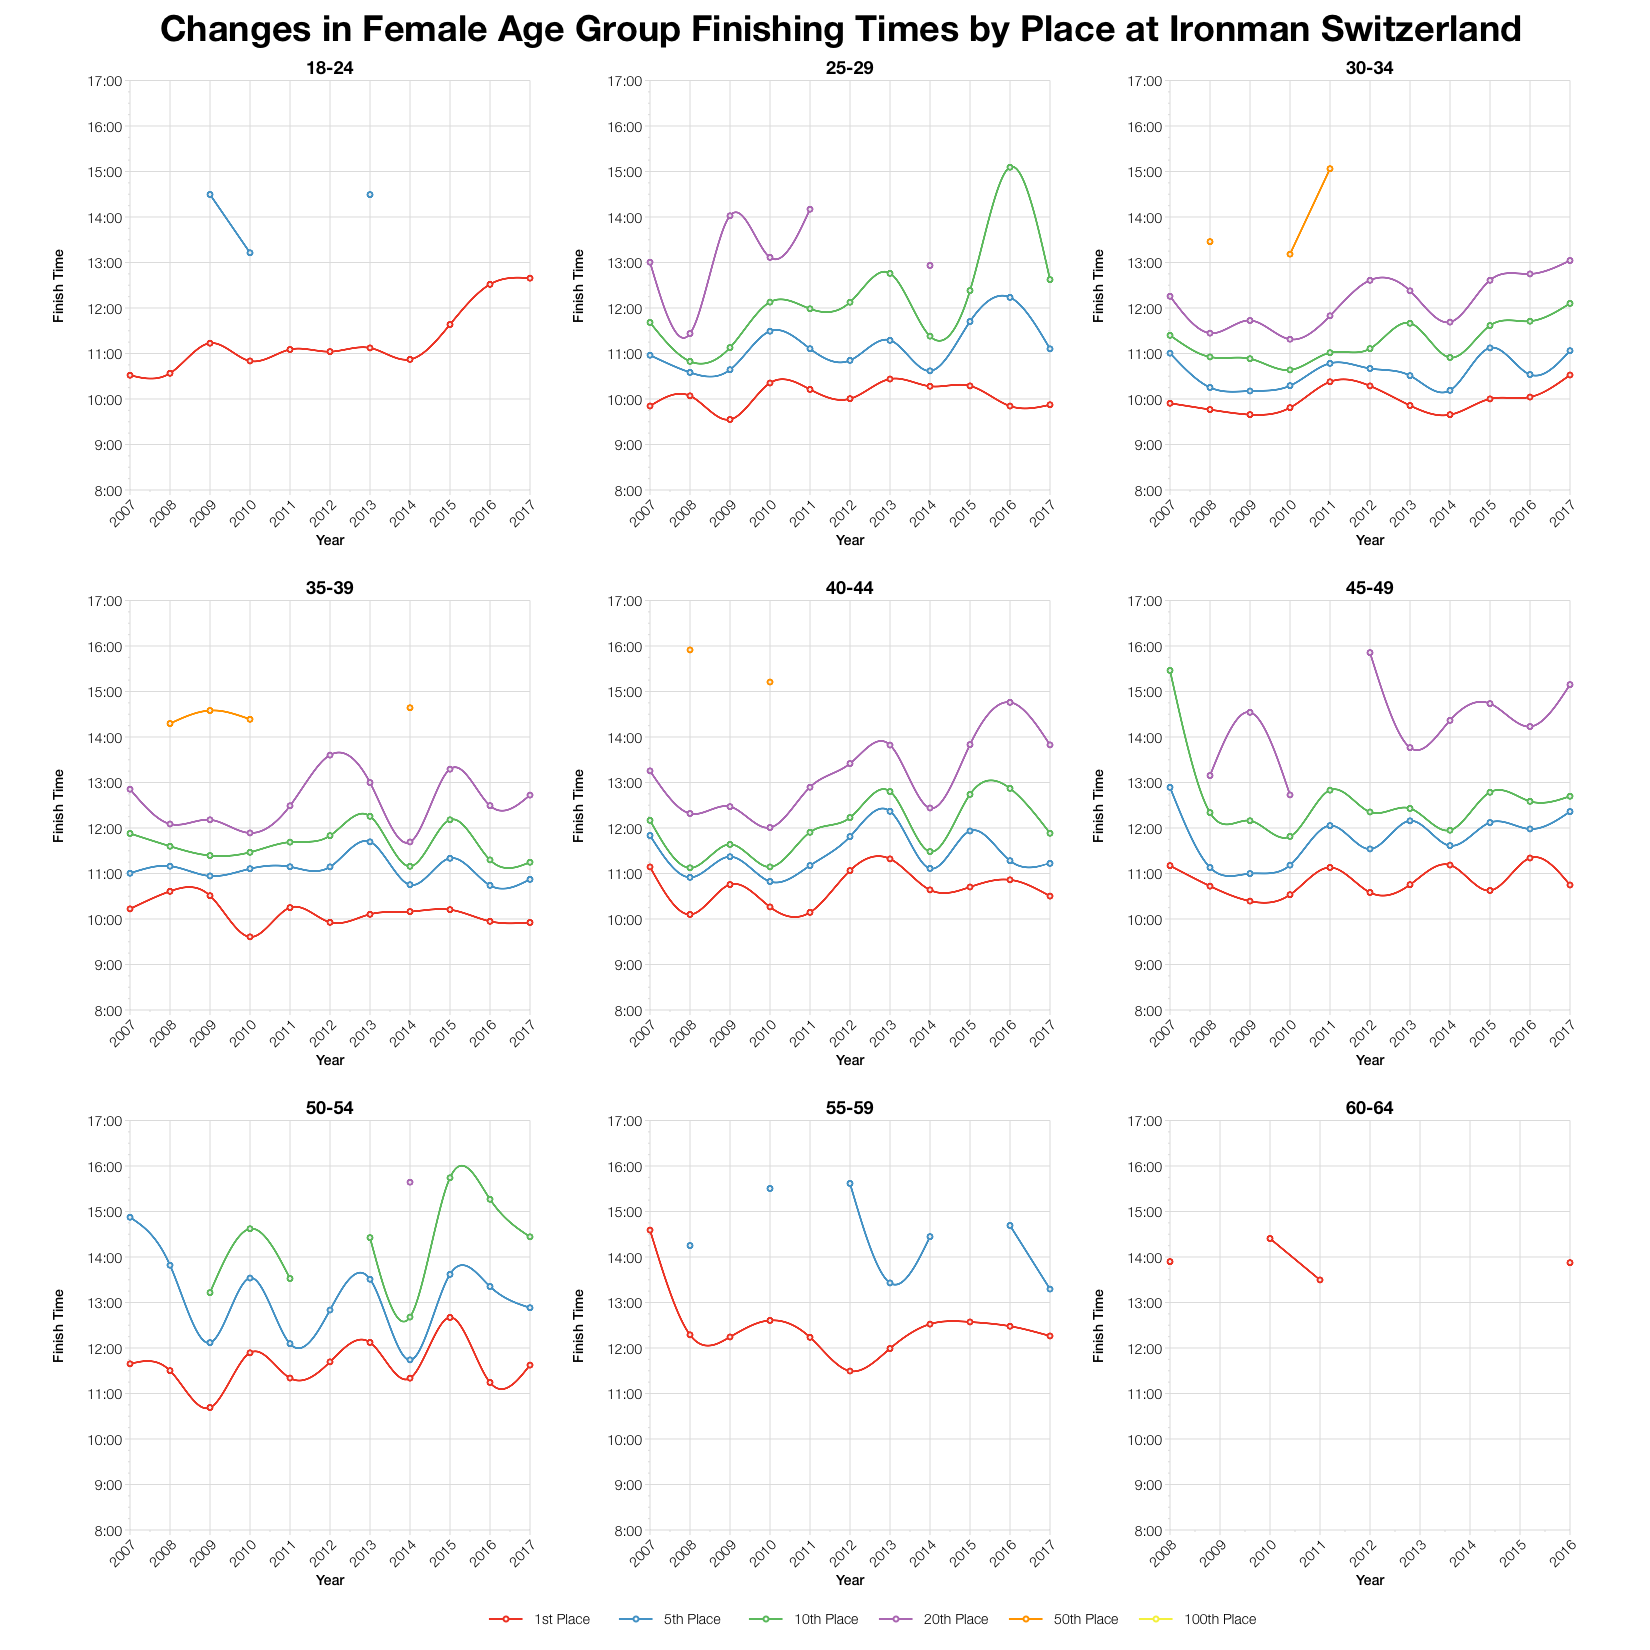
Tracking positions across age groups generally shows a slowing for times at this year’s race. This is more pronounced further back in the race than at the front of each age group. The times are not the slowest, but put this year towards the slow end. I’d note that entry numbers are lower for the last two years and this may mean the field has changed with more middle of the pack athletes and fewer potential front of pack athletes. Even if this is the case, the limited change at the front of the age groups shows that qualifying remains unchanged.
| Slots | Winner | Average Kona Qualifier | Final Qualifier | |
|---|---|---|---|---|
| M18-24 | 1 | 9:57:10 | 9:57:10 | 9:57:10 |
| M25-29 | 2 | 9:18:46 | 9:19:05 | 9:19:25 |
| M30-34 | 4 | 9:13:15 | 9:22:41 | 9:36:24 |
| M35-39 | 4 | 9:08:30 | 9:14:49 | 9:22:03 |
| M40-44 | 5 | 9:11:37 | 9:30:16 | 9:40:14 |
| M45-49 | 4 | 9:29:58 | 9:43:44 | 9:53:20 |
| M50-54 | 3 | 9:58:01 | 10:09:43 | 10:16:27 |
| M55-59 | 2 | 10:16:13 | 10:17:20 | 10:18:28 |
| M60-64 | 1 | 11:07:17 | 11:07:17 | 11:07:17 |
| M65-69 | 1 | 13:35:06 | 13:35:06 | 13:35:06 |
| M70-74 | 1 | 13:38:01 | 13:38:01 | 13:38:01 |
| F18-24 | 1 | 12:39:23 | 12:39:23 | 12:39:23 |
| F25-29 | 1 | 9:52:21 | 9:52:21 | 9:52:21 |
| F30-34 | 2 | 10:31:39 | 10:34:12 | 10:36:45 |
| F35-39 | 2 | 9:55:24 | 10:00:19 | 10:05:15 |
| F40-44 | 2 | 10:30:13 | 10:36:12 | 10:42:11 |
| F45-49 | 2 | 10:44:50 | 10:58:20 | 11:11:50 |
| F50-54 | 1 | 11:37:29 | 11:37:29 | 11:37:29 |
| F55-59 | 1 | 12:15:51 | 12:15:51 | 12:15:51 |
Based on the results I’ve estimated the slot allocation in Switzerland and from that the times that would automatically qualify you in each age group. Actual numbers may vary from this and roll down will influence the qualifying times. If you want to see more data on qualifying times at Ironman Switzerland and other races, check out my Kona qualification page.
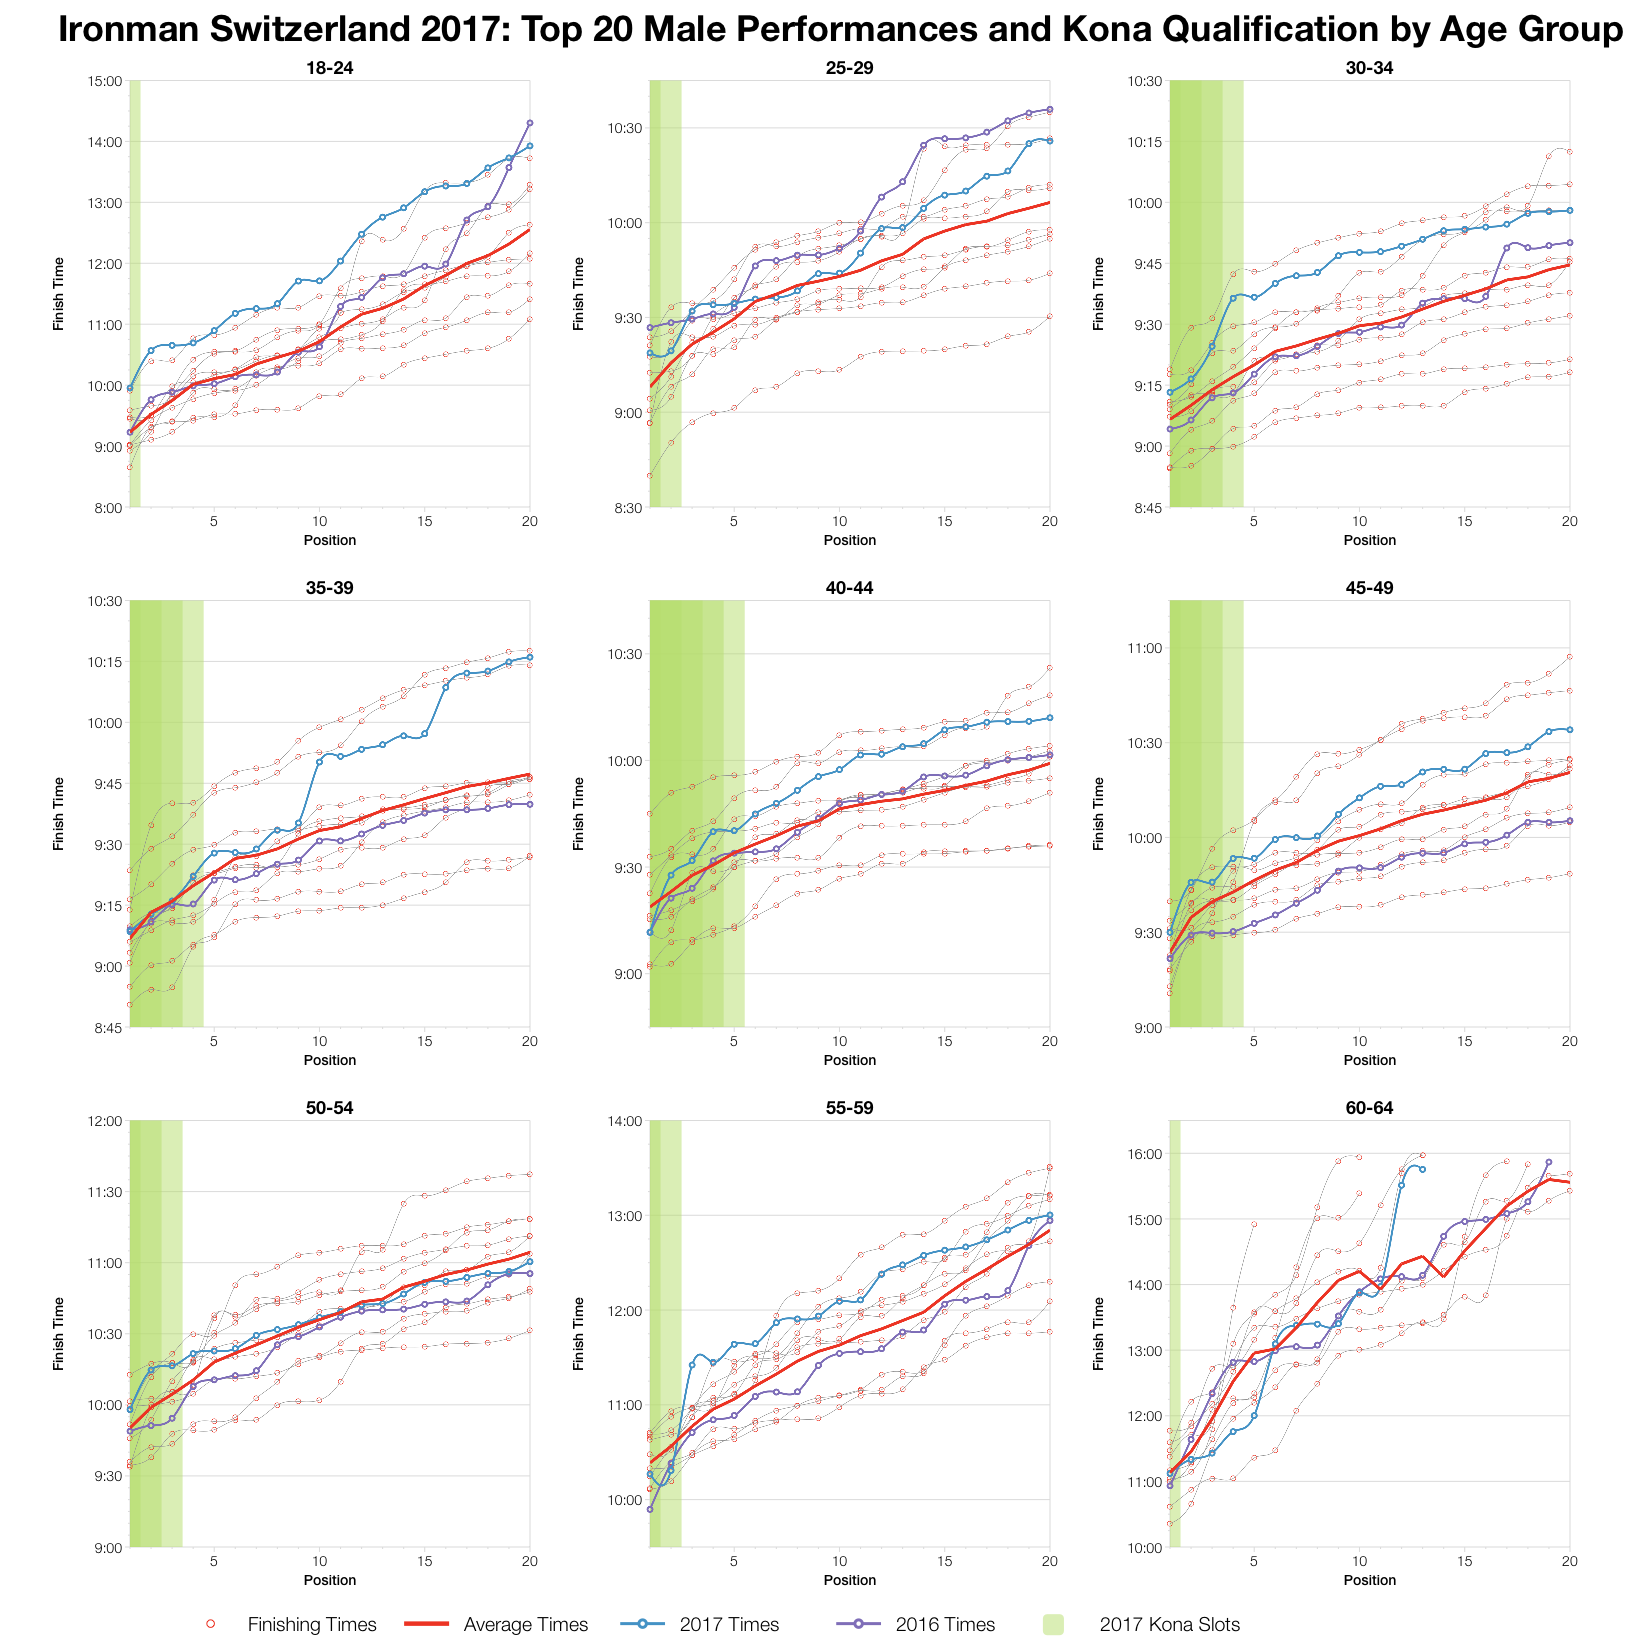
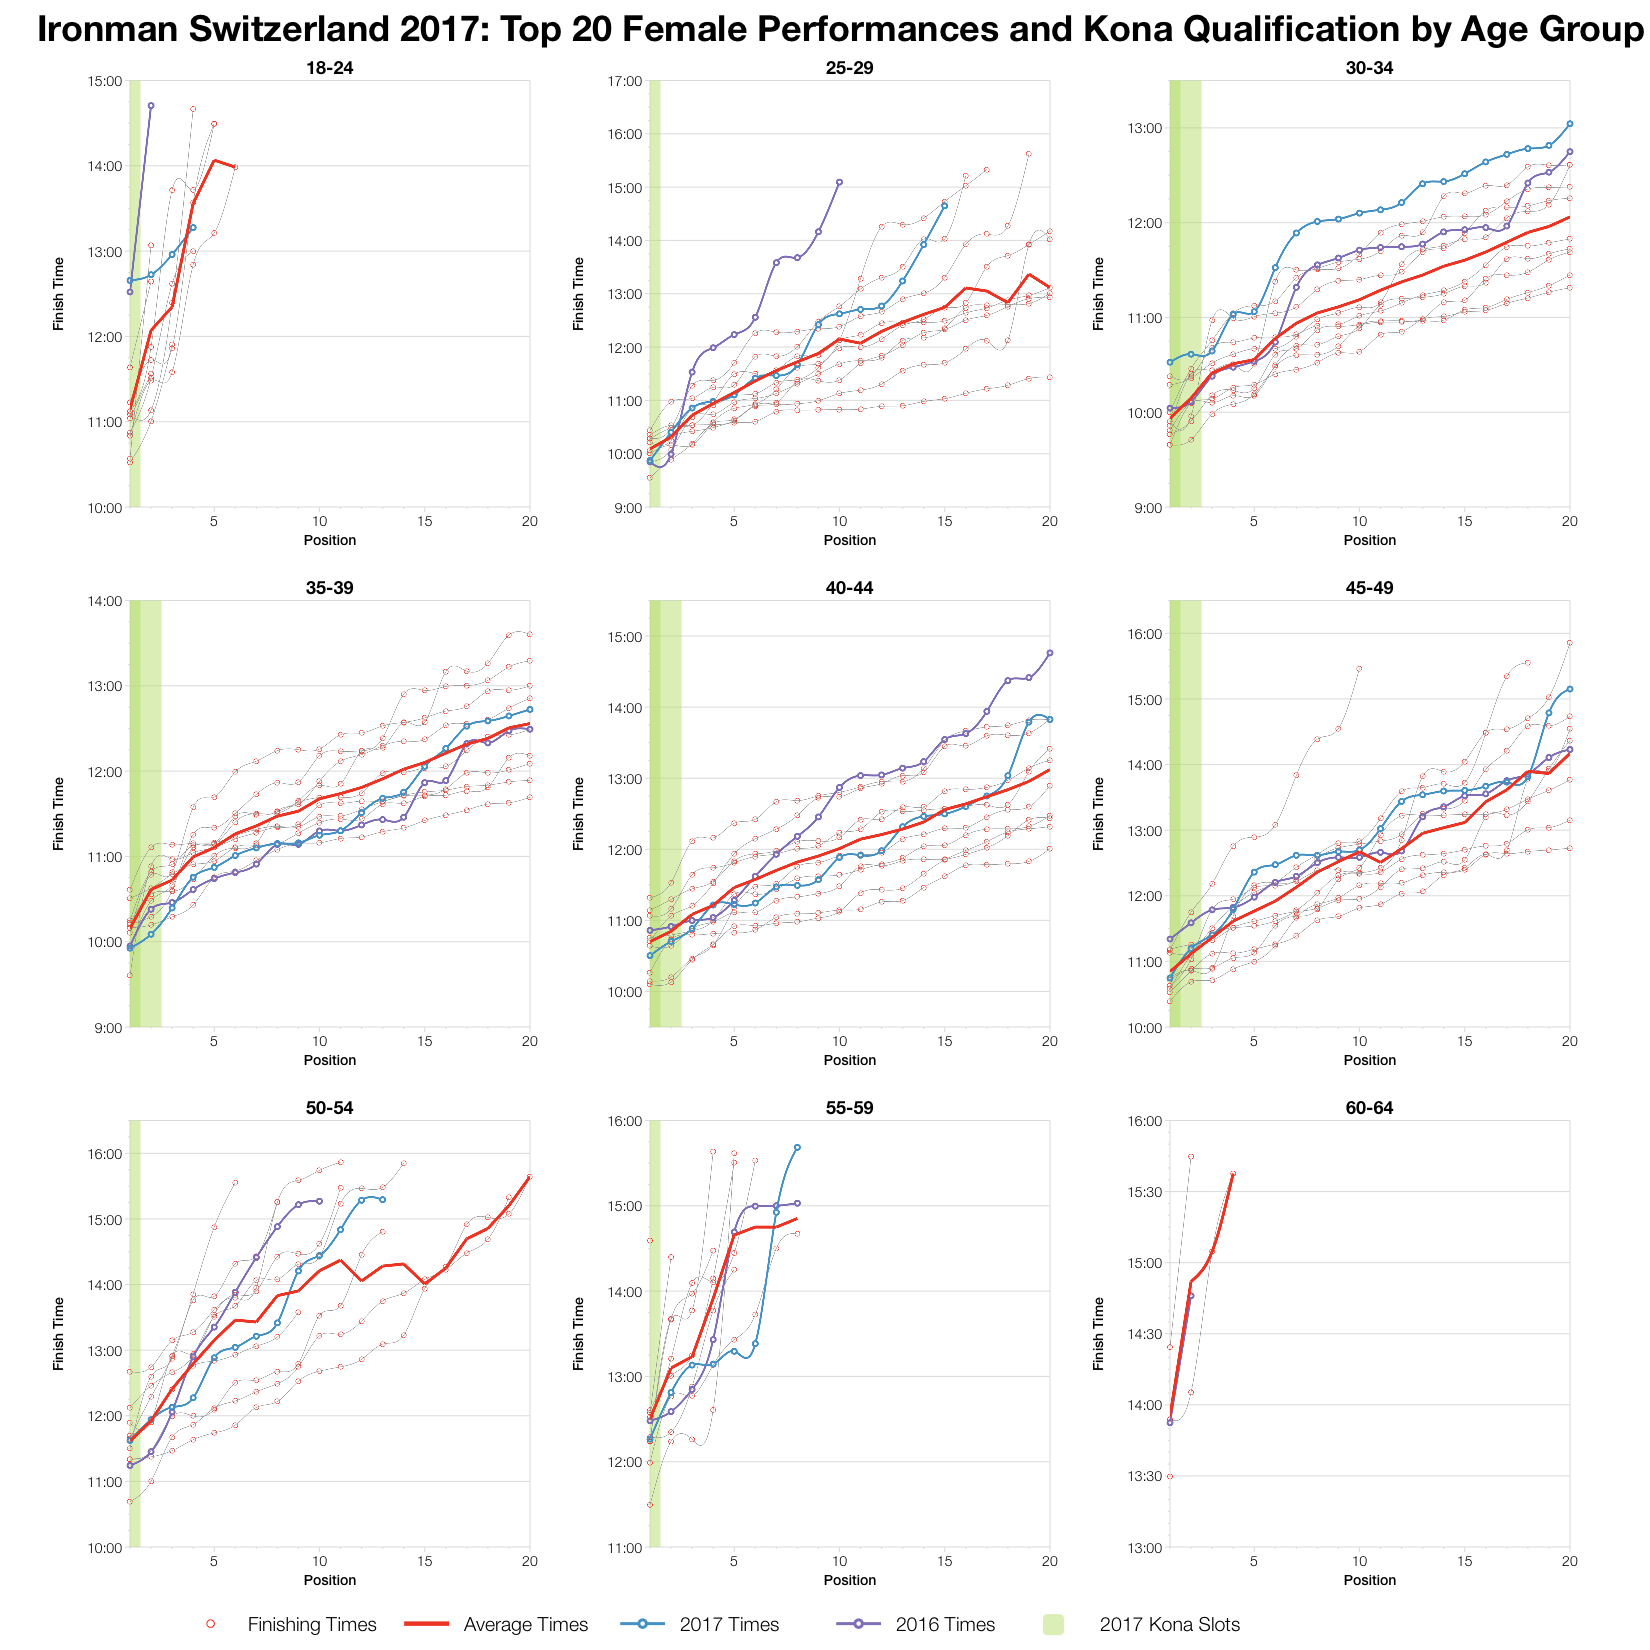
For most age groups this year’s results do track behind the top 20 average. As noted before, when you look at the top 3 the difference tends to be minimal, but over the 20 times were generally slower than average. How much of this is down to conditions on the day and how much reflects the competitiveness of a smaller field is hard to say.
You can access a spreadsheet of the full results from Ironman Switzerland 2017 on my Google Drive.


