My third analysis from the weekend is for Ironman Staffordshire 70.3. There are no Kona slots to consider here and I don’t cover 70.3s in enough detail to produce statistics for their World Champs. This analysis will just focus on how results compare with previous years of racing in Staffordshire.
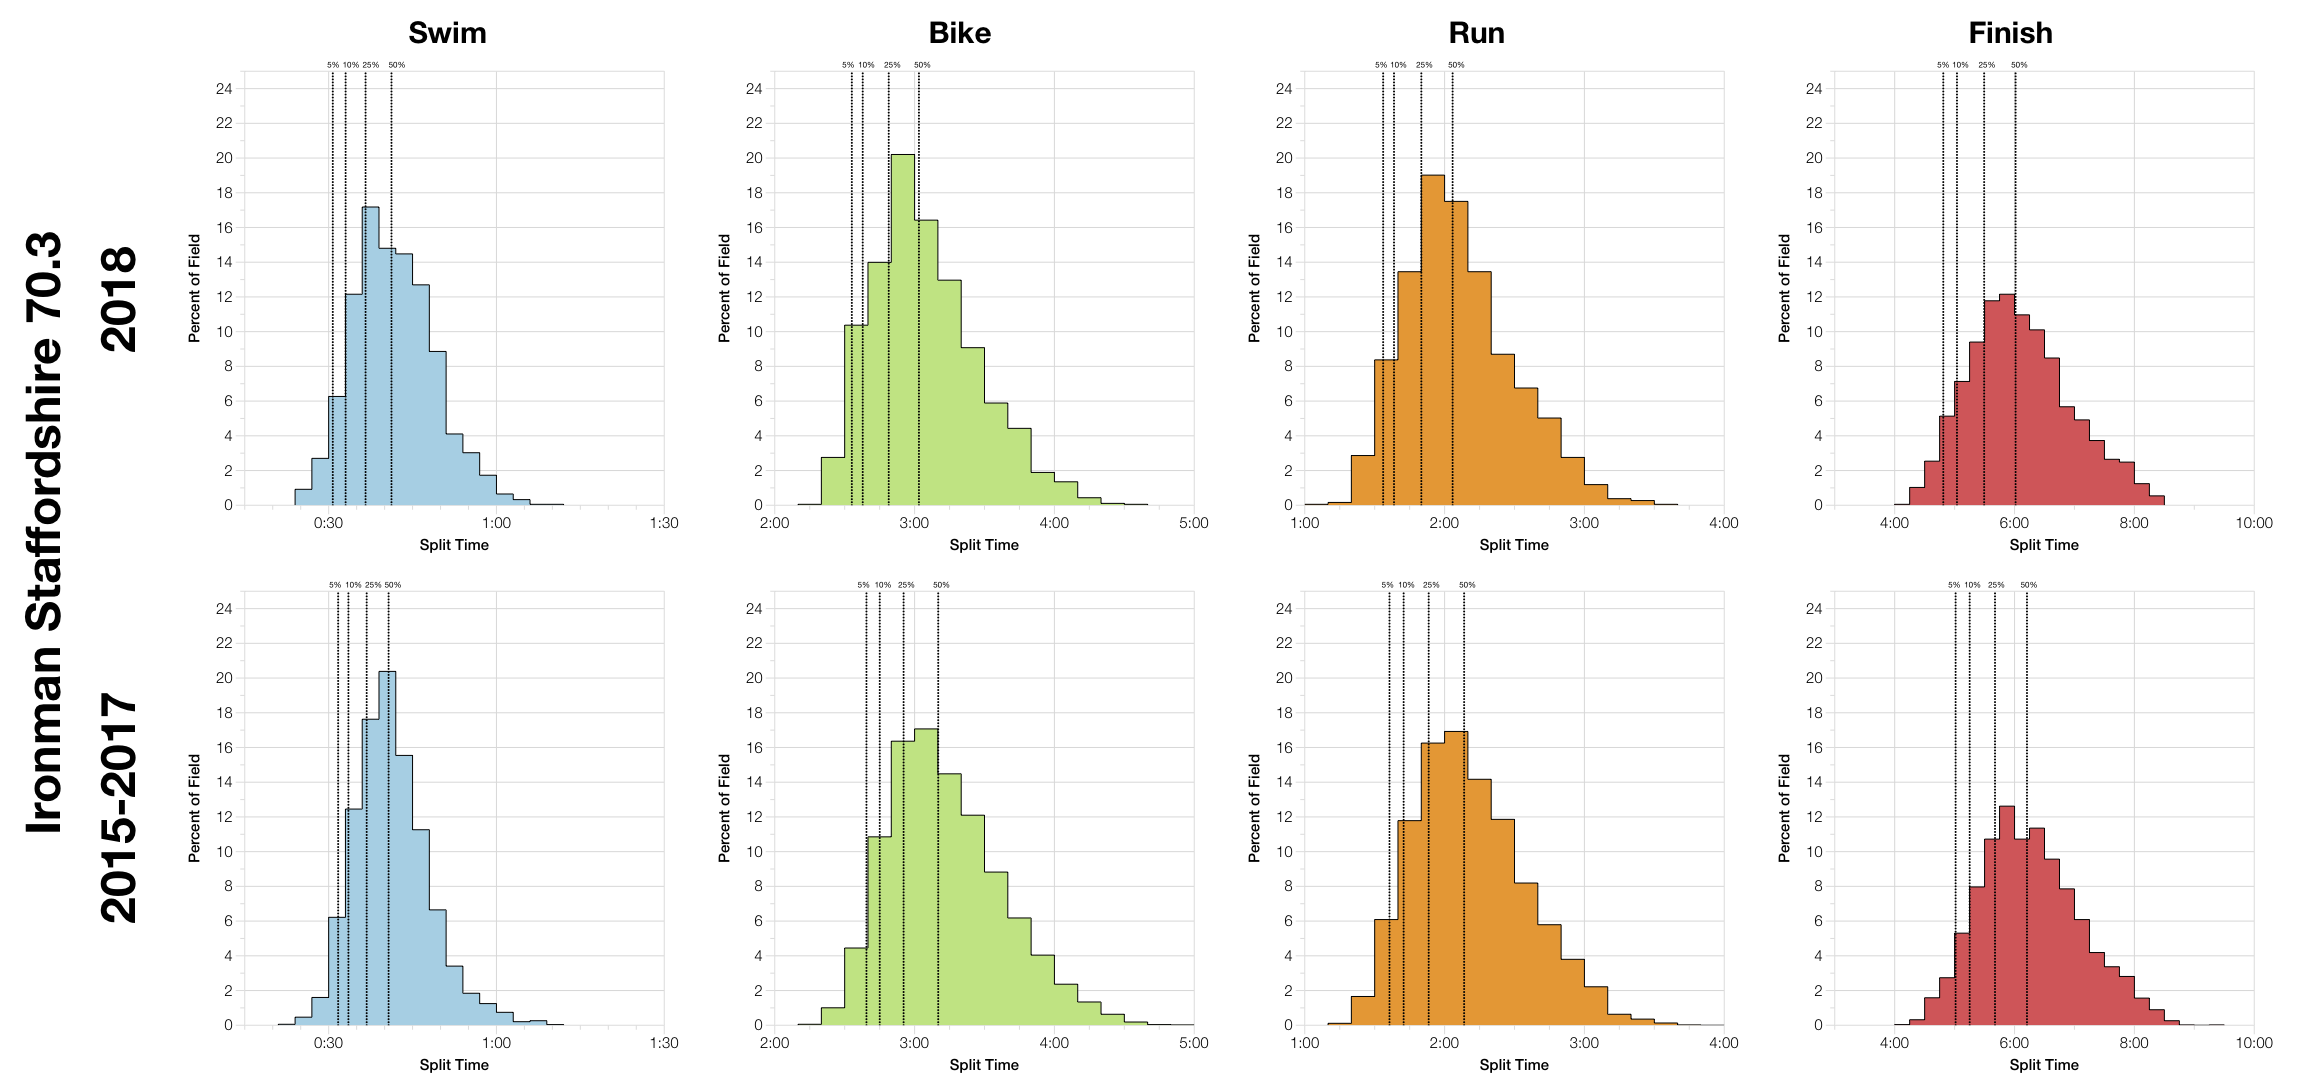
This year’s race comes out faster in both bike and run than the aggregated data from the previous 3 years of the event. So we see a faster overall race in 2018 trending through the front and middle of the pack. Conditions look to have been good for racing, certainly in comparison to the heat of the previous year.
DNF levels compare well with previous years (note that 2015/2016 DNF numbers also include DNS figures) with no significant levels of drop out on bike or run.
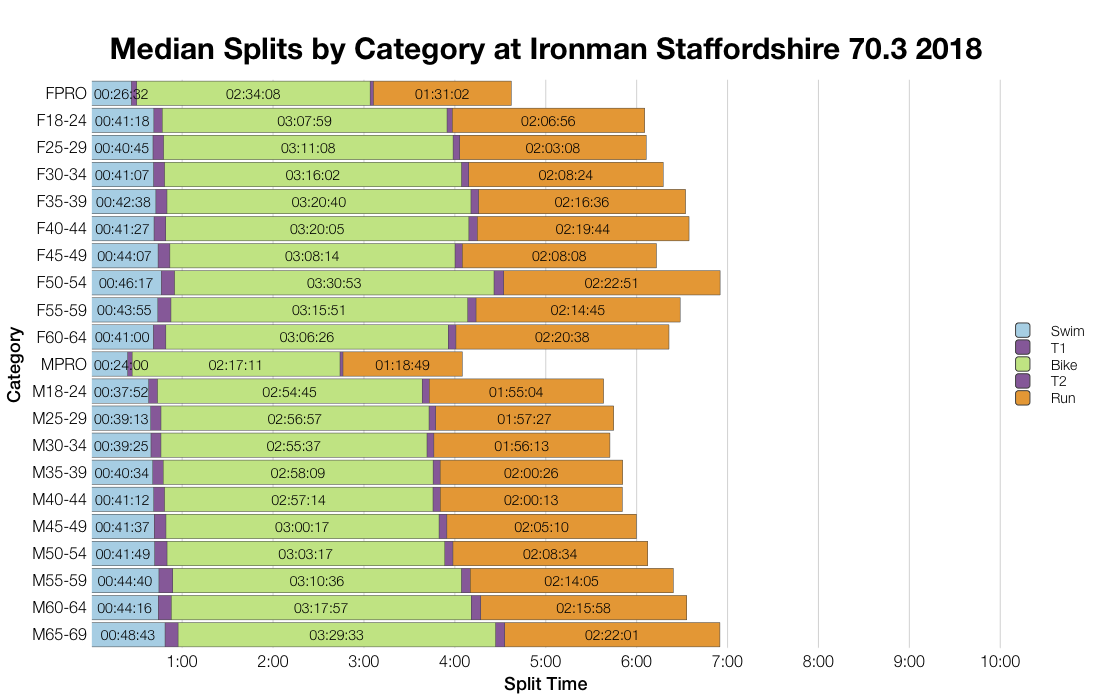
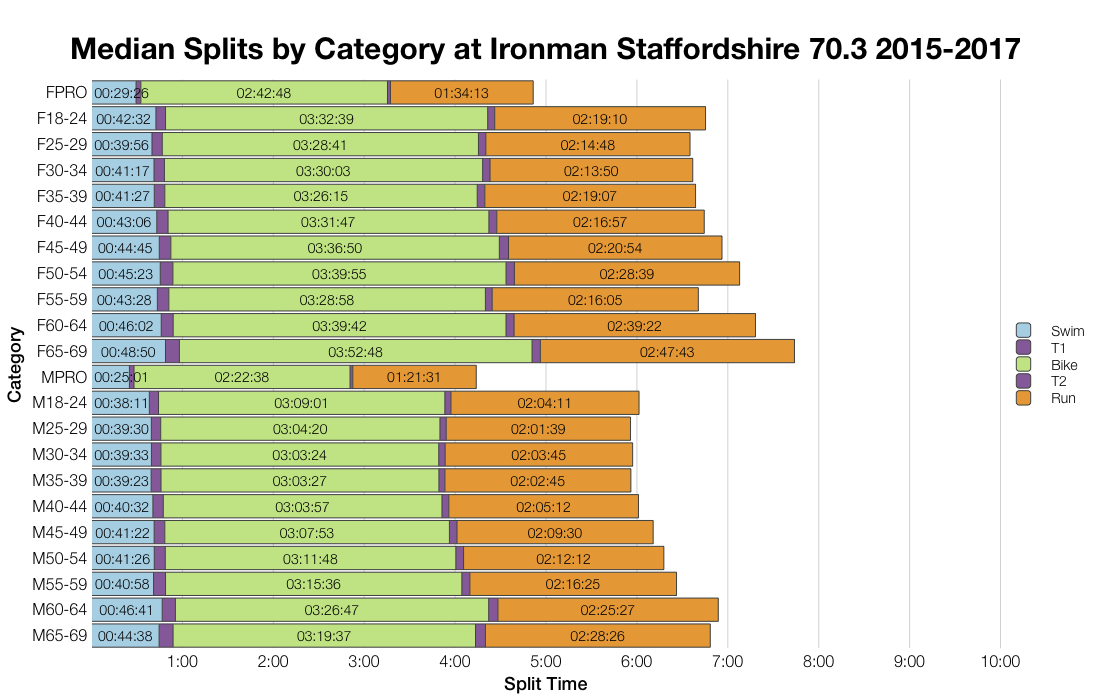
Following the pattern seen in the distributions, when we look closer at individual age group median splits we see faster times for 2018. Both bike and run show a consistent pattern of faster times across most of the age group field.
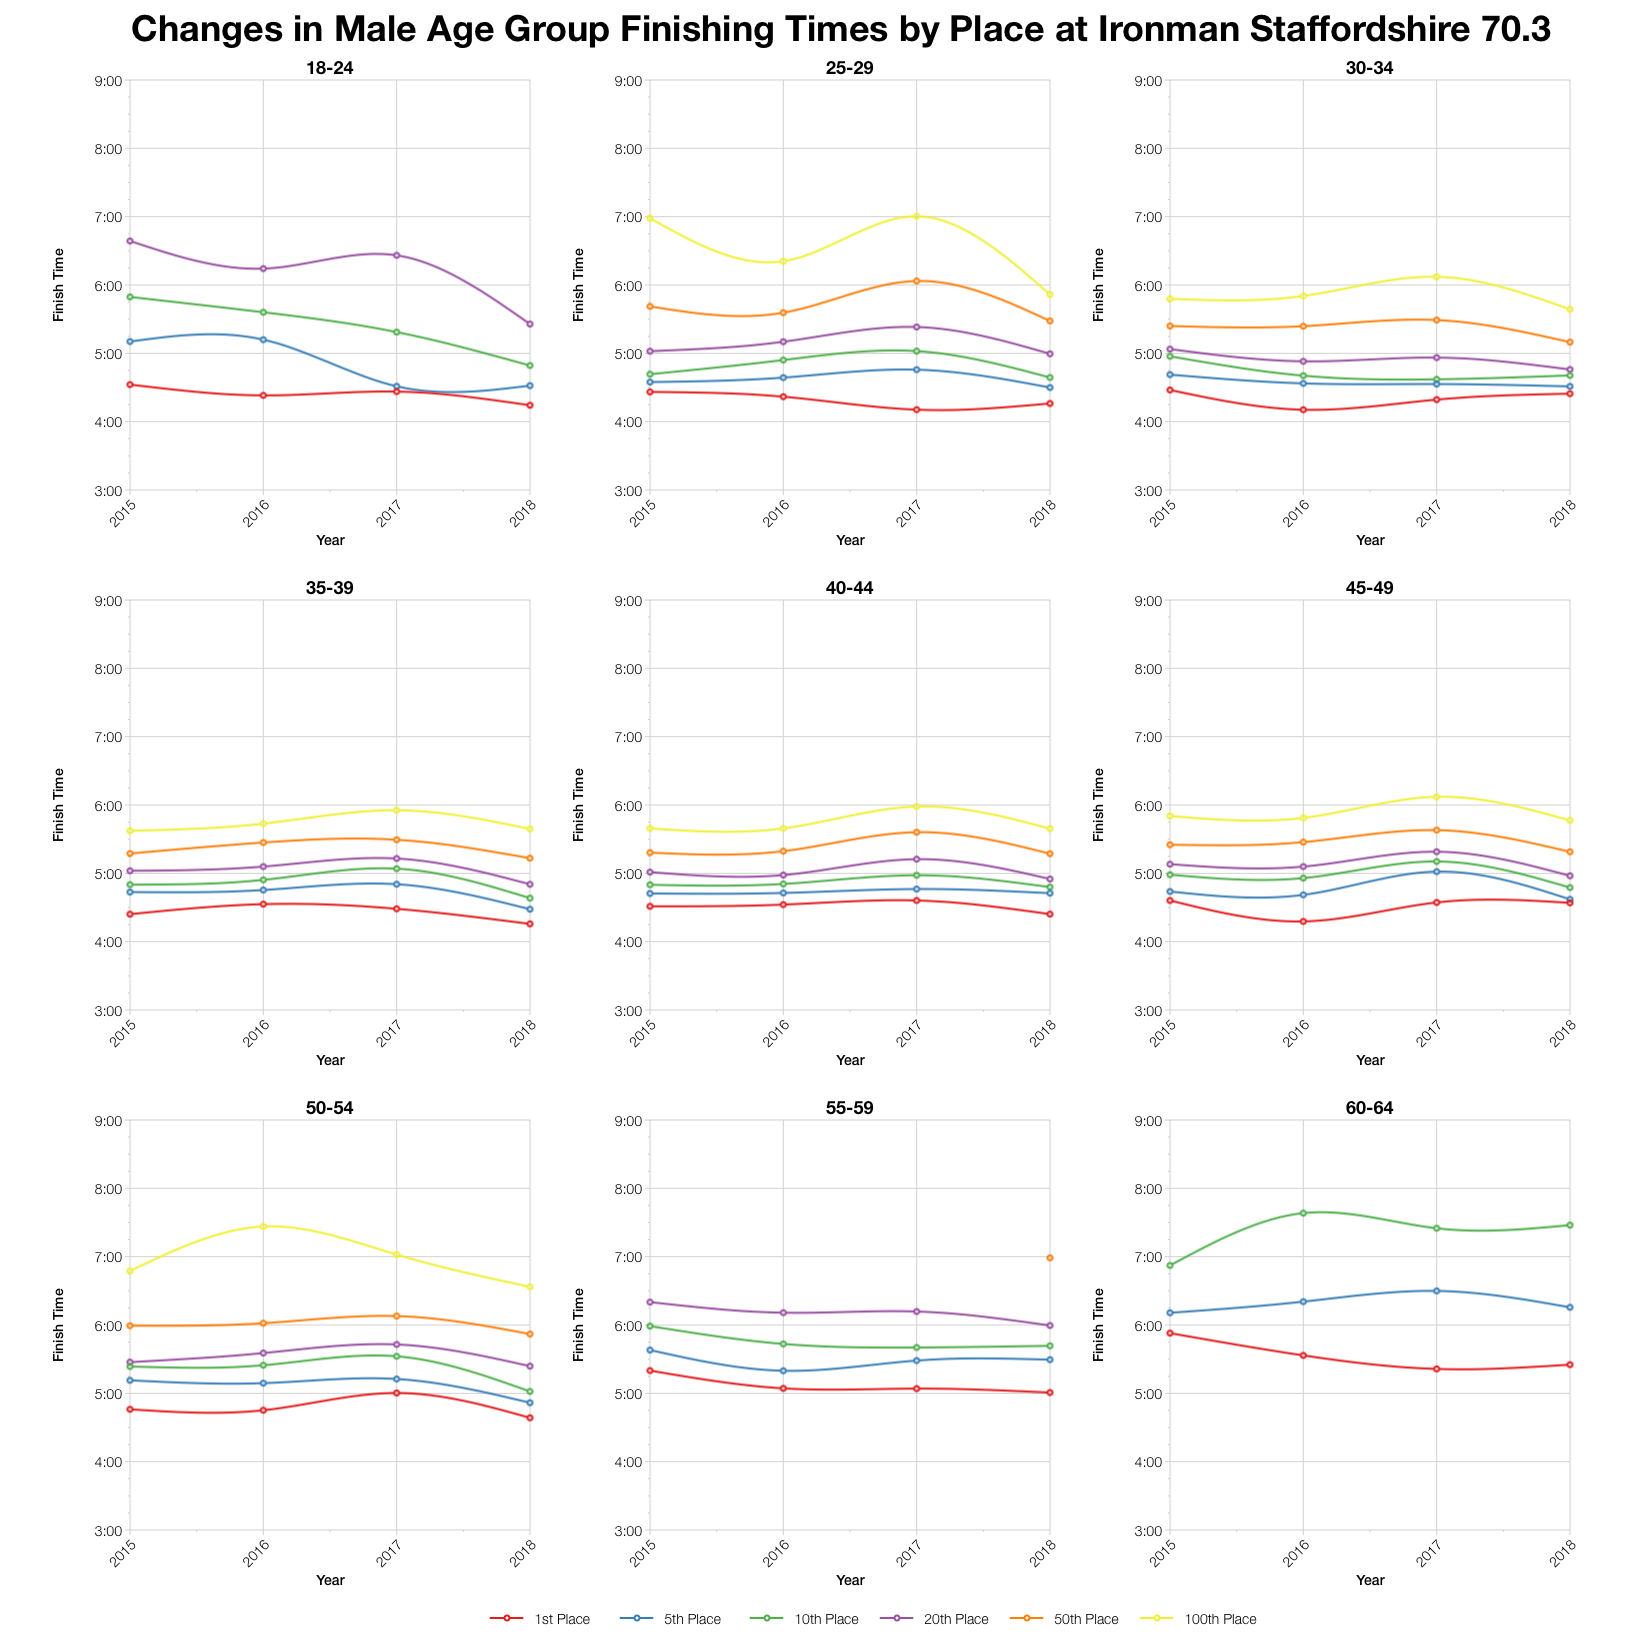
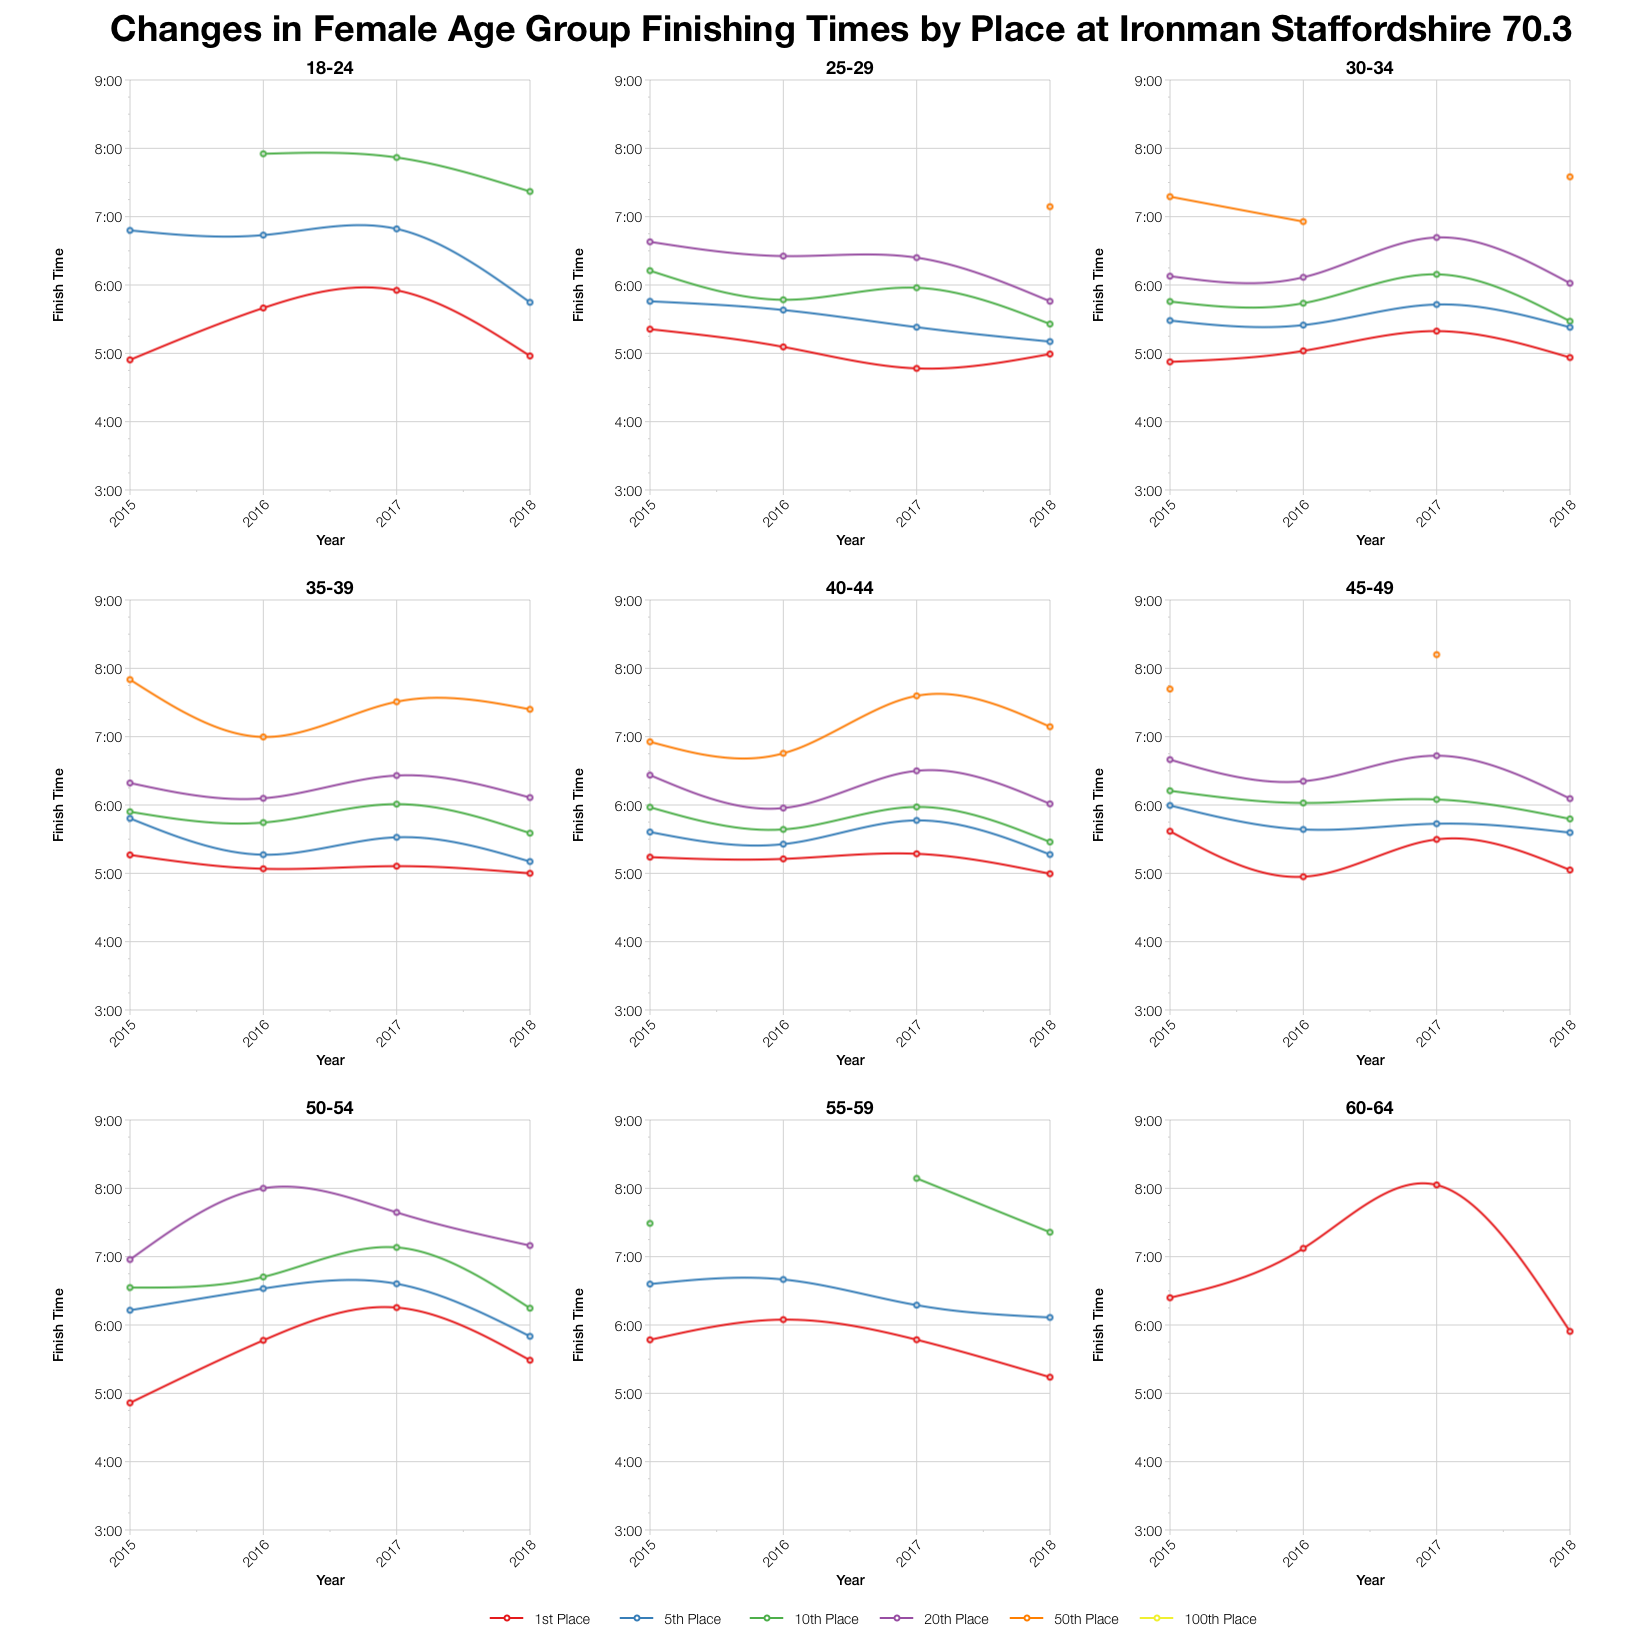
If we track the times for specific age group placings over the last four years then 2018 tends to be faster at most placings. 2017 was the slowest year so far thanks to the hot conditions, so there’s a clear upturn from that point, but comparing with the years before, times are often a little faster. Not necessarily a radical change, but clearly distinguishable.
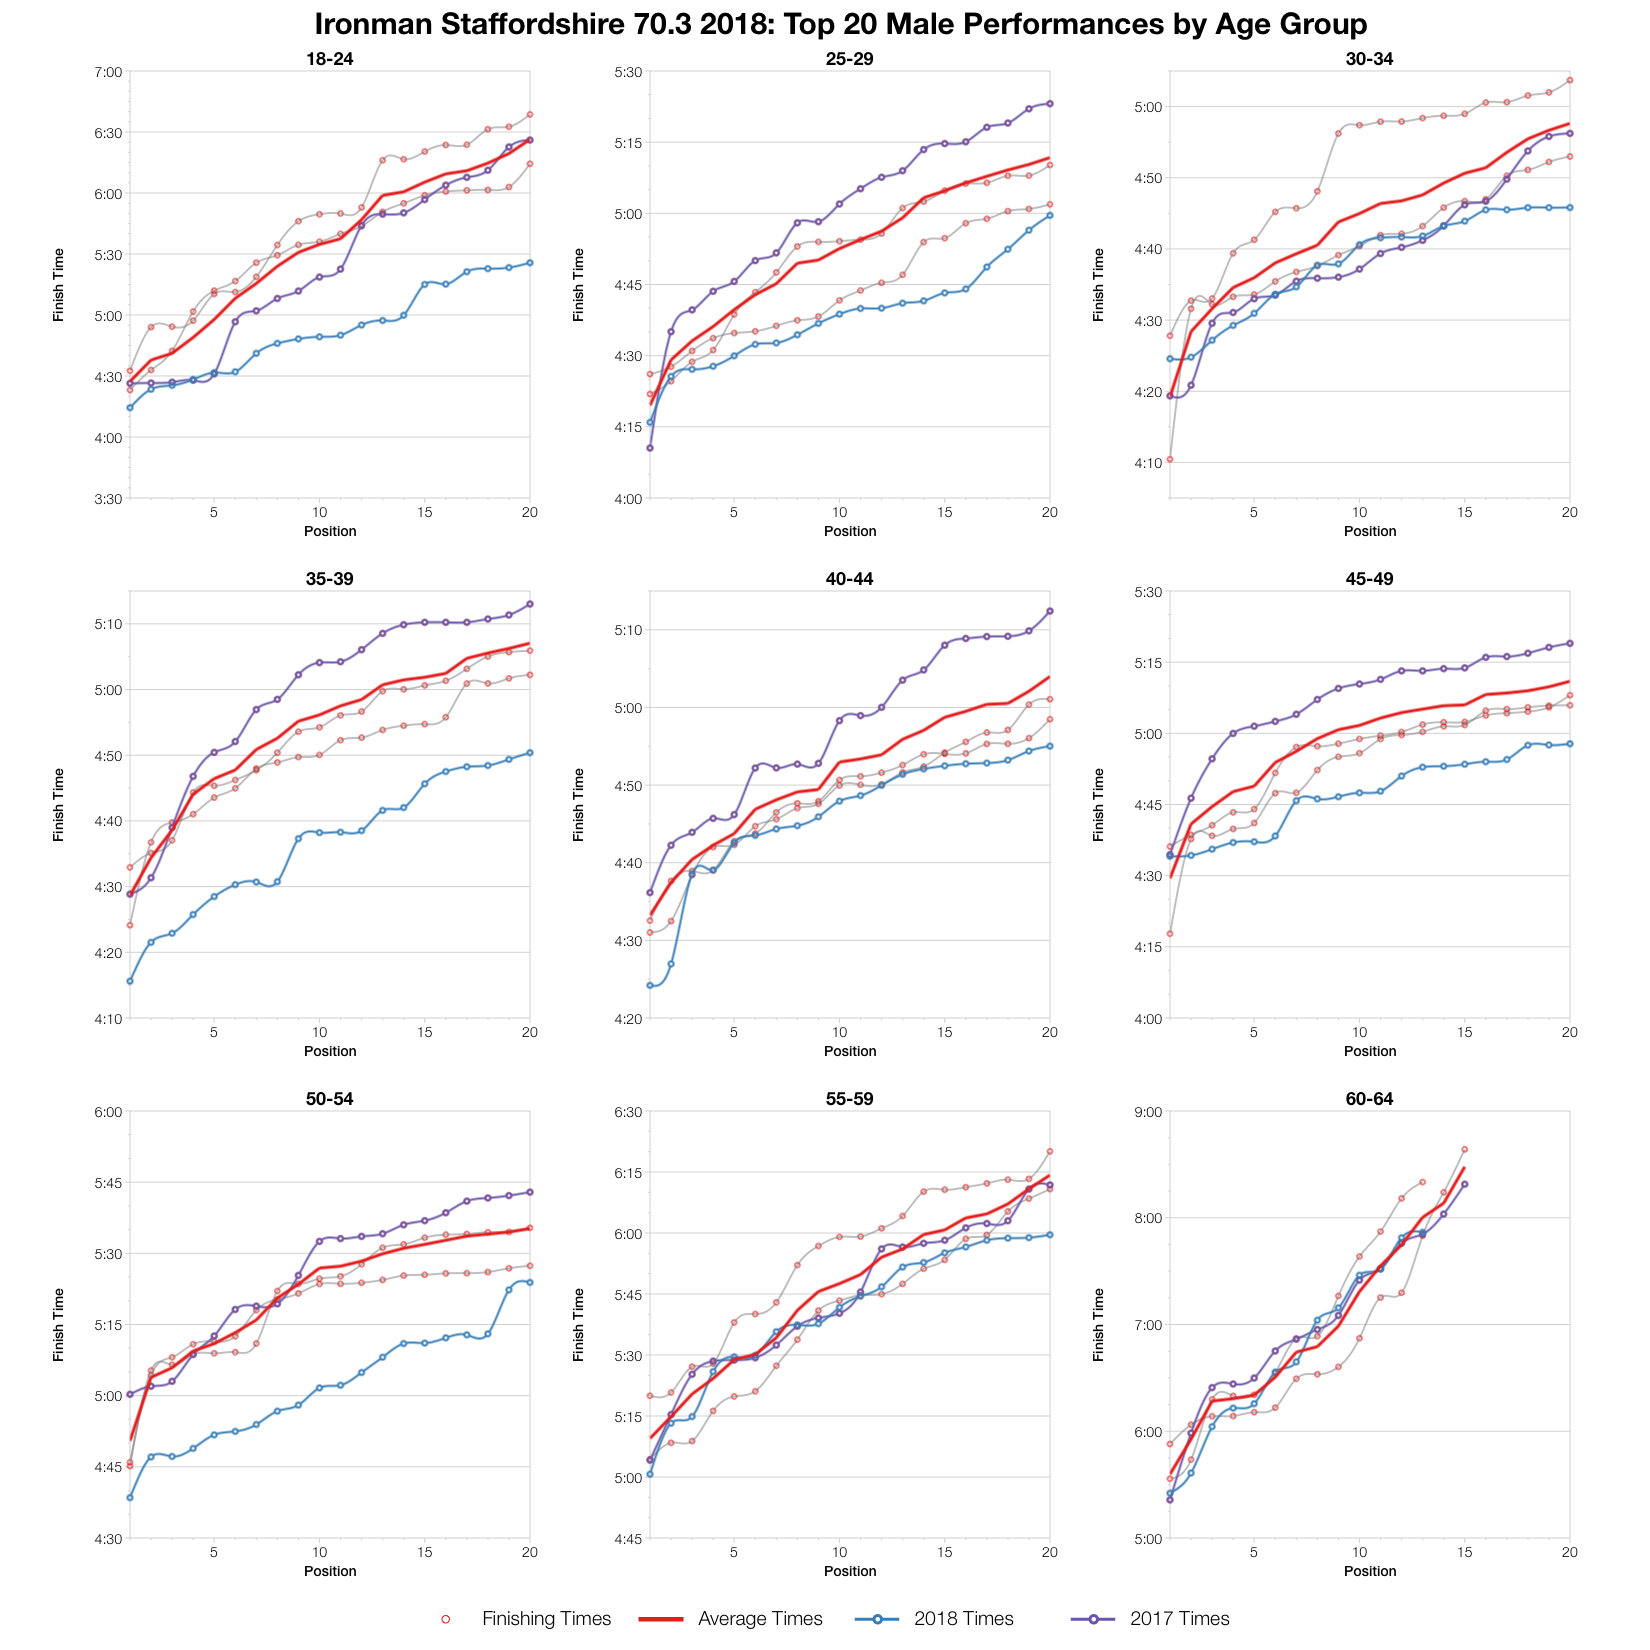
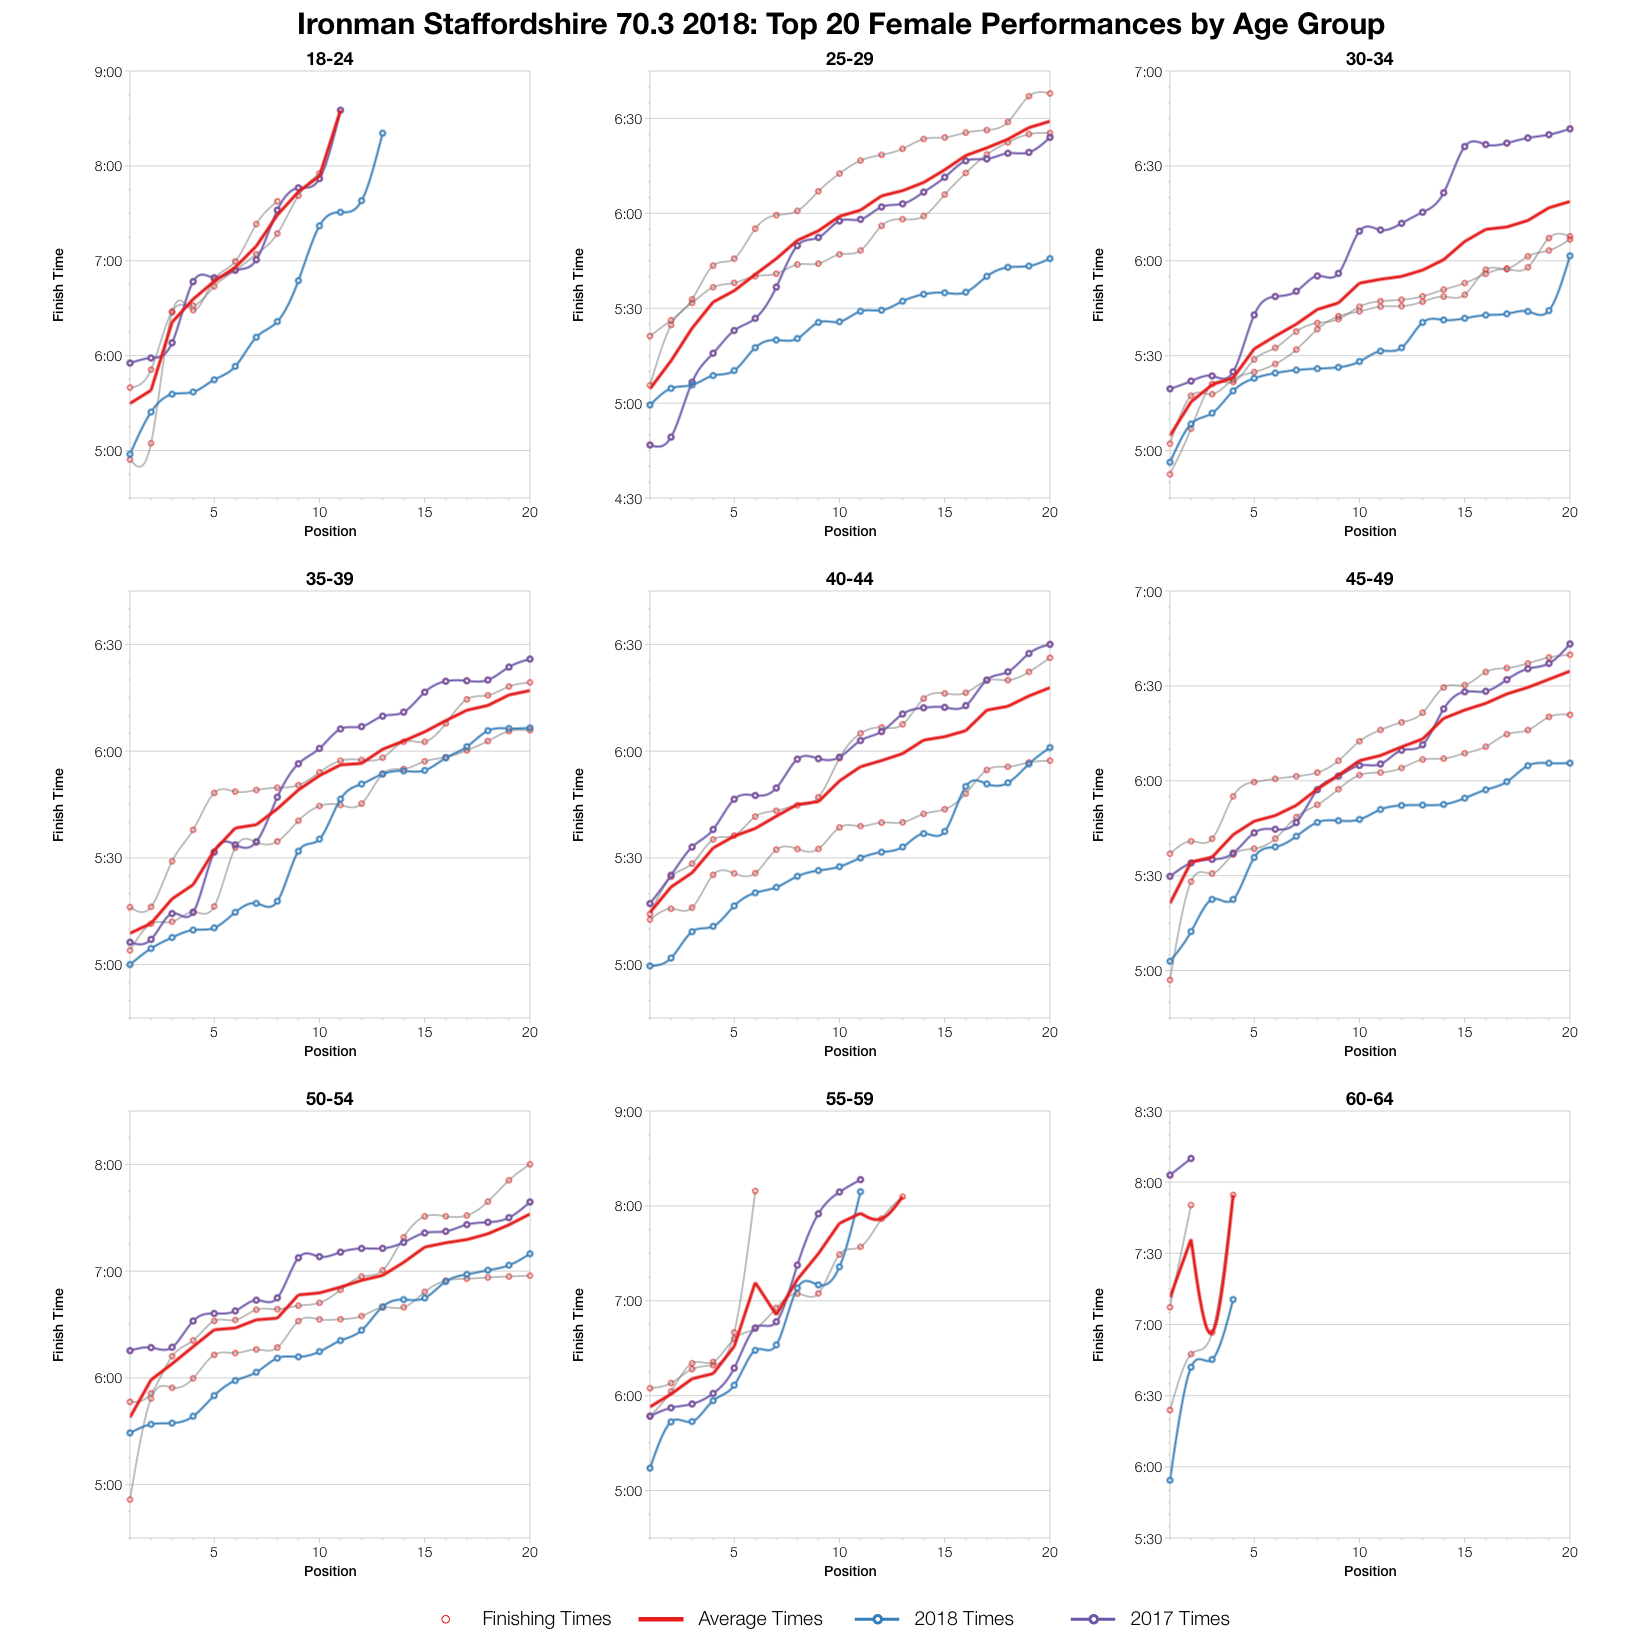
Finally the top 20 in each age group. Here we see a pattern where times are mostly ahead of the course averages and also ahead of previous results. Many of the top twenty in each age group beat previous times for those places. At the very front of the race, podium positions within the age groups, the times are not necessarily as far ahead, but that varies with age group.
You can access a spreadsheet of the full results from Ironman Staffordshire 70.3 2018 on my Google Drive.


