Steeping away form the Ironman brand for the third analysis this week with the biggest race of the weekend – Challenge Roth. There are no Kona slots to consider here, just a famous course and fast times. This year’s race looks to be a typical year for Roth.
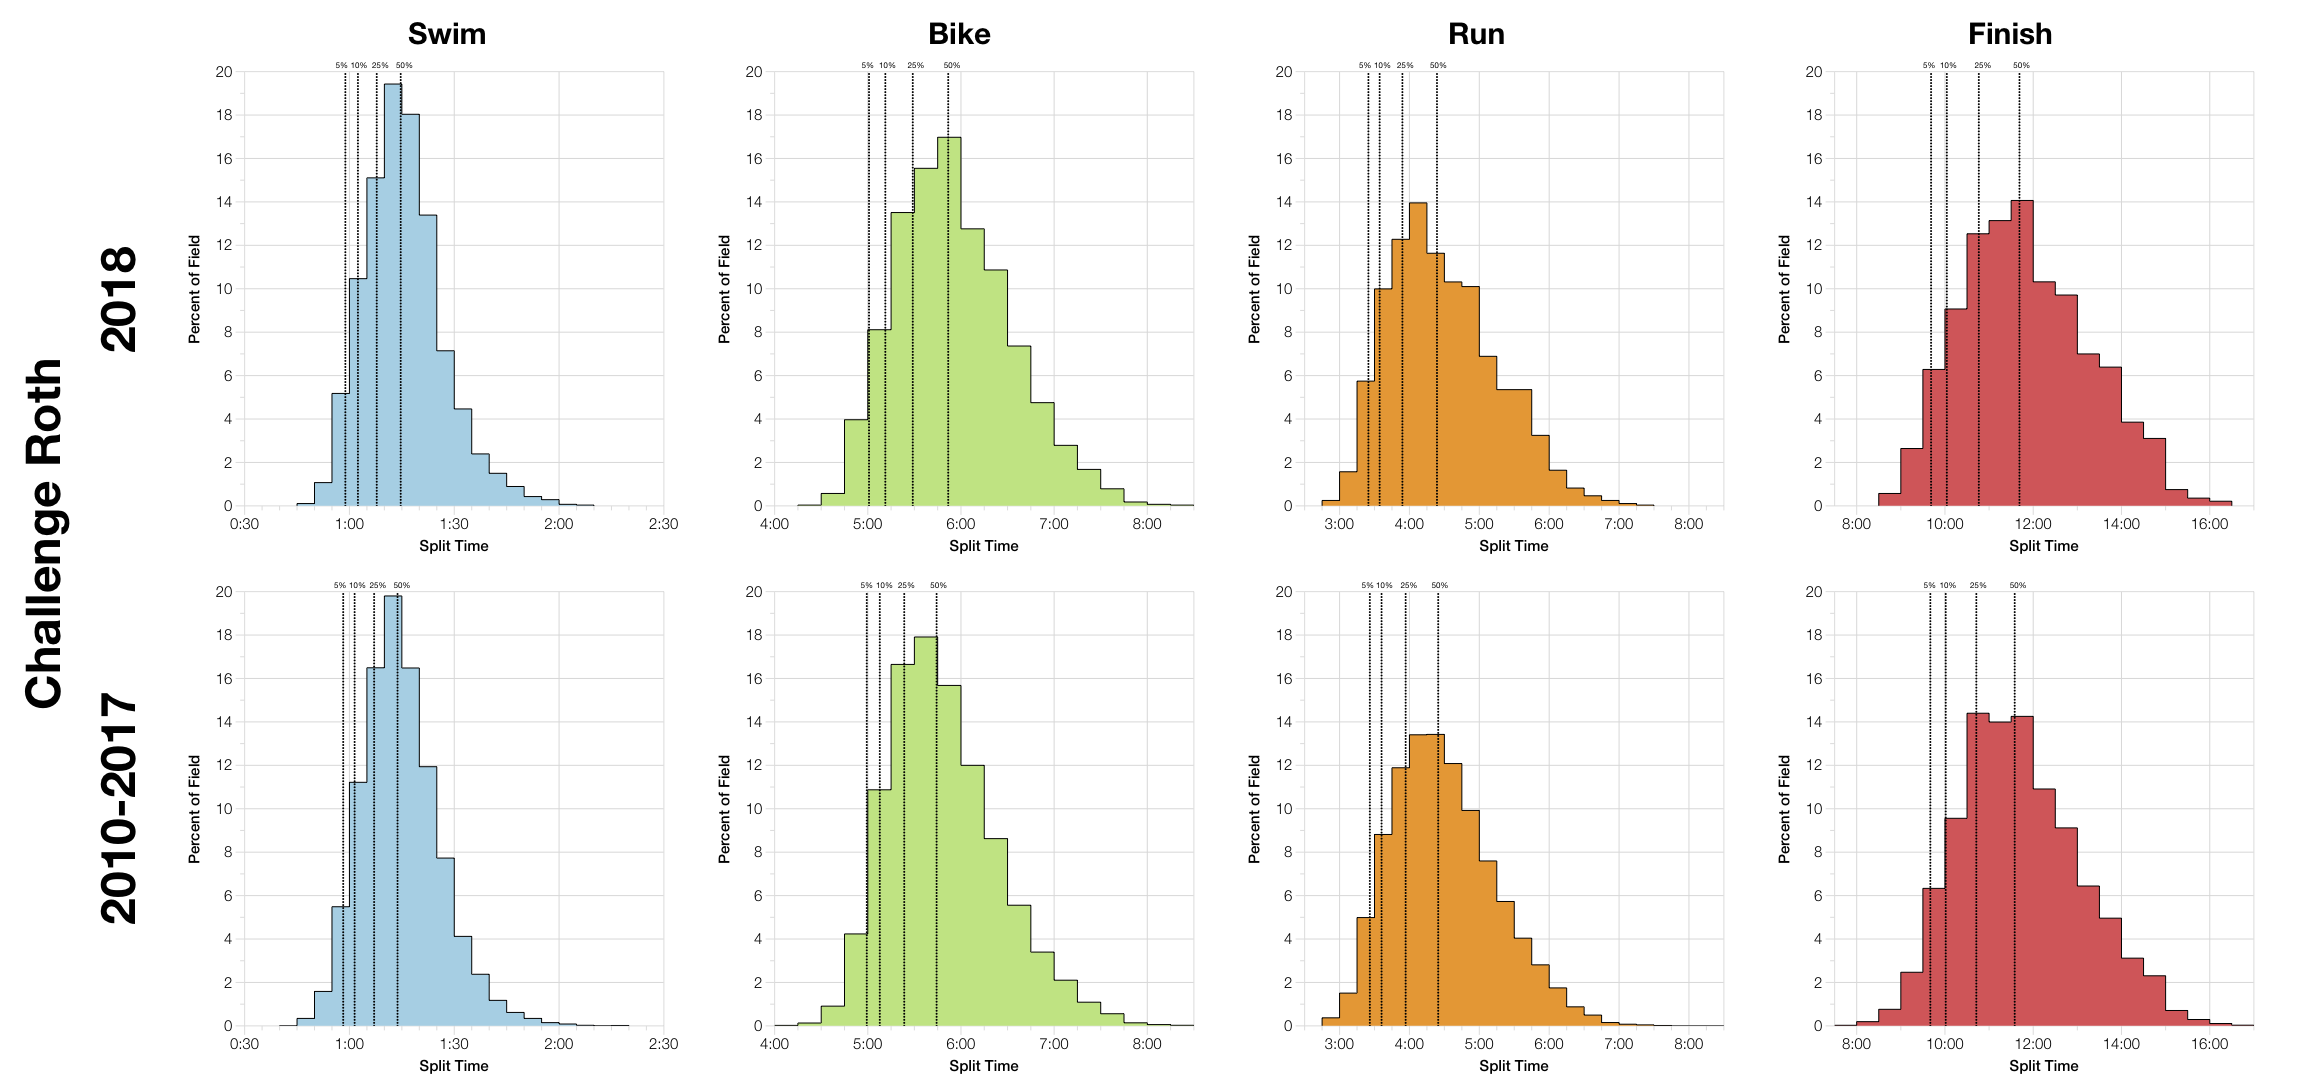
The 2018 splits distribute very similarly to the previous 7 years of race results. Perhaps the only variation to mention is with the bike distribution which trends slightly slower than the amalgamated data from previous races. Differences are small and largely balance out when we look at the overall distributions.
There are enough problems with the way results have been presented over the years that DNF data is at best sporadic. There’s nothing exceptional about the statistics from this year’s race – they don’t appear to represent a high or low for the course.

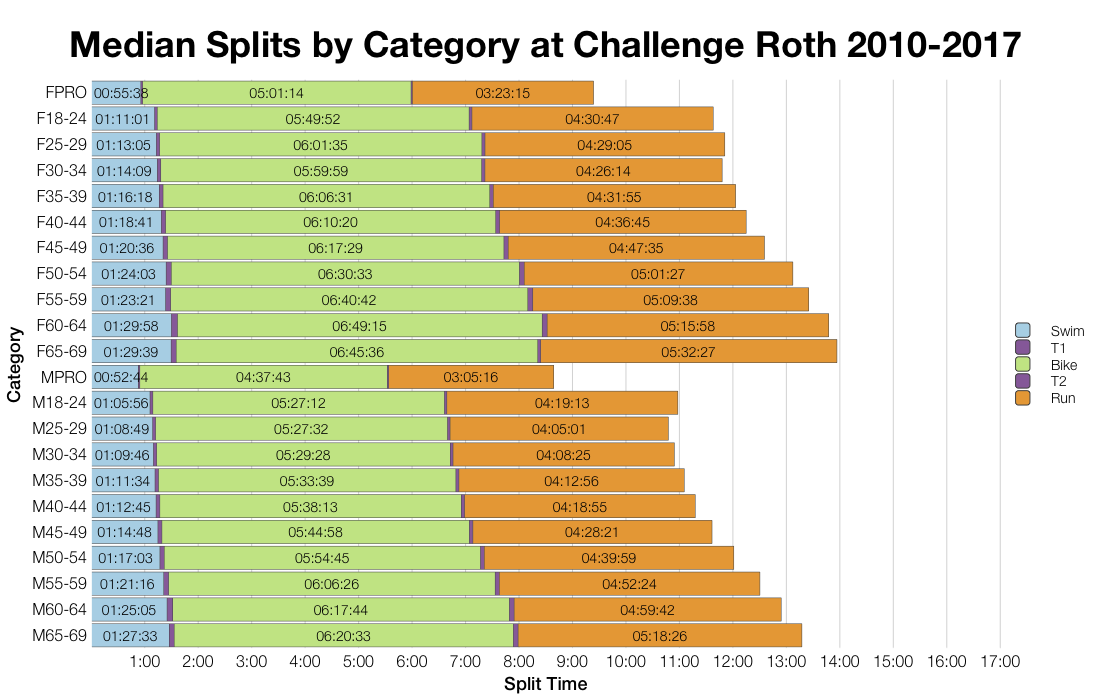
As with the distribution comparing age group medians doesn’t highlight any major differences. Bike medians are perhaps slightly slower, but by a small margin.
Probably the most famous Iron distance race outside the Ironman brand – Roth draws a field from around the world.
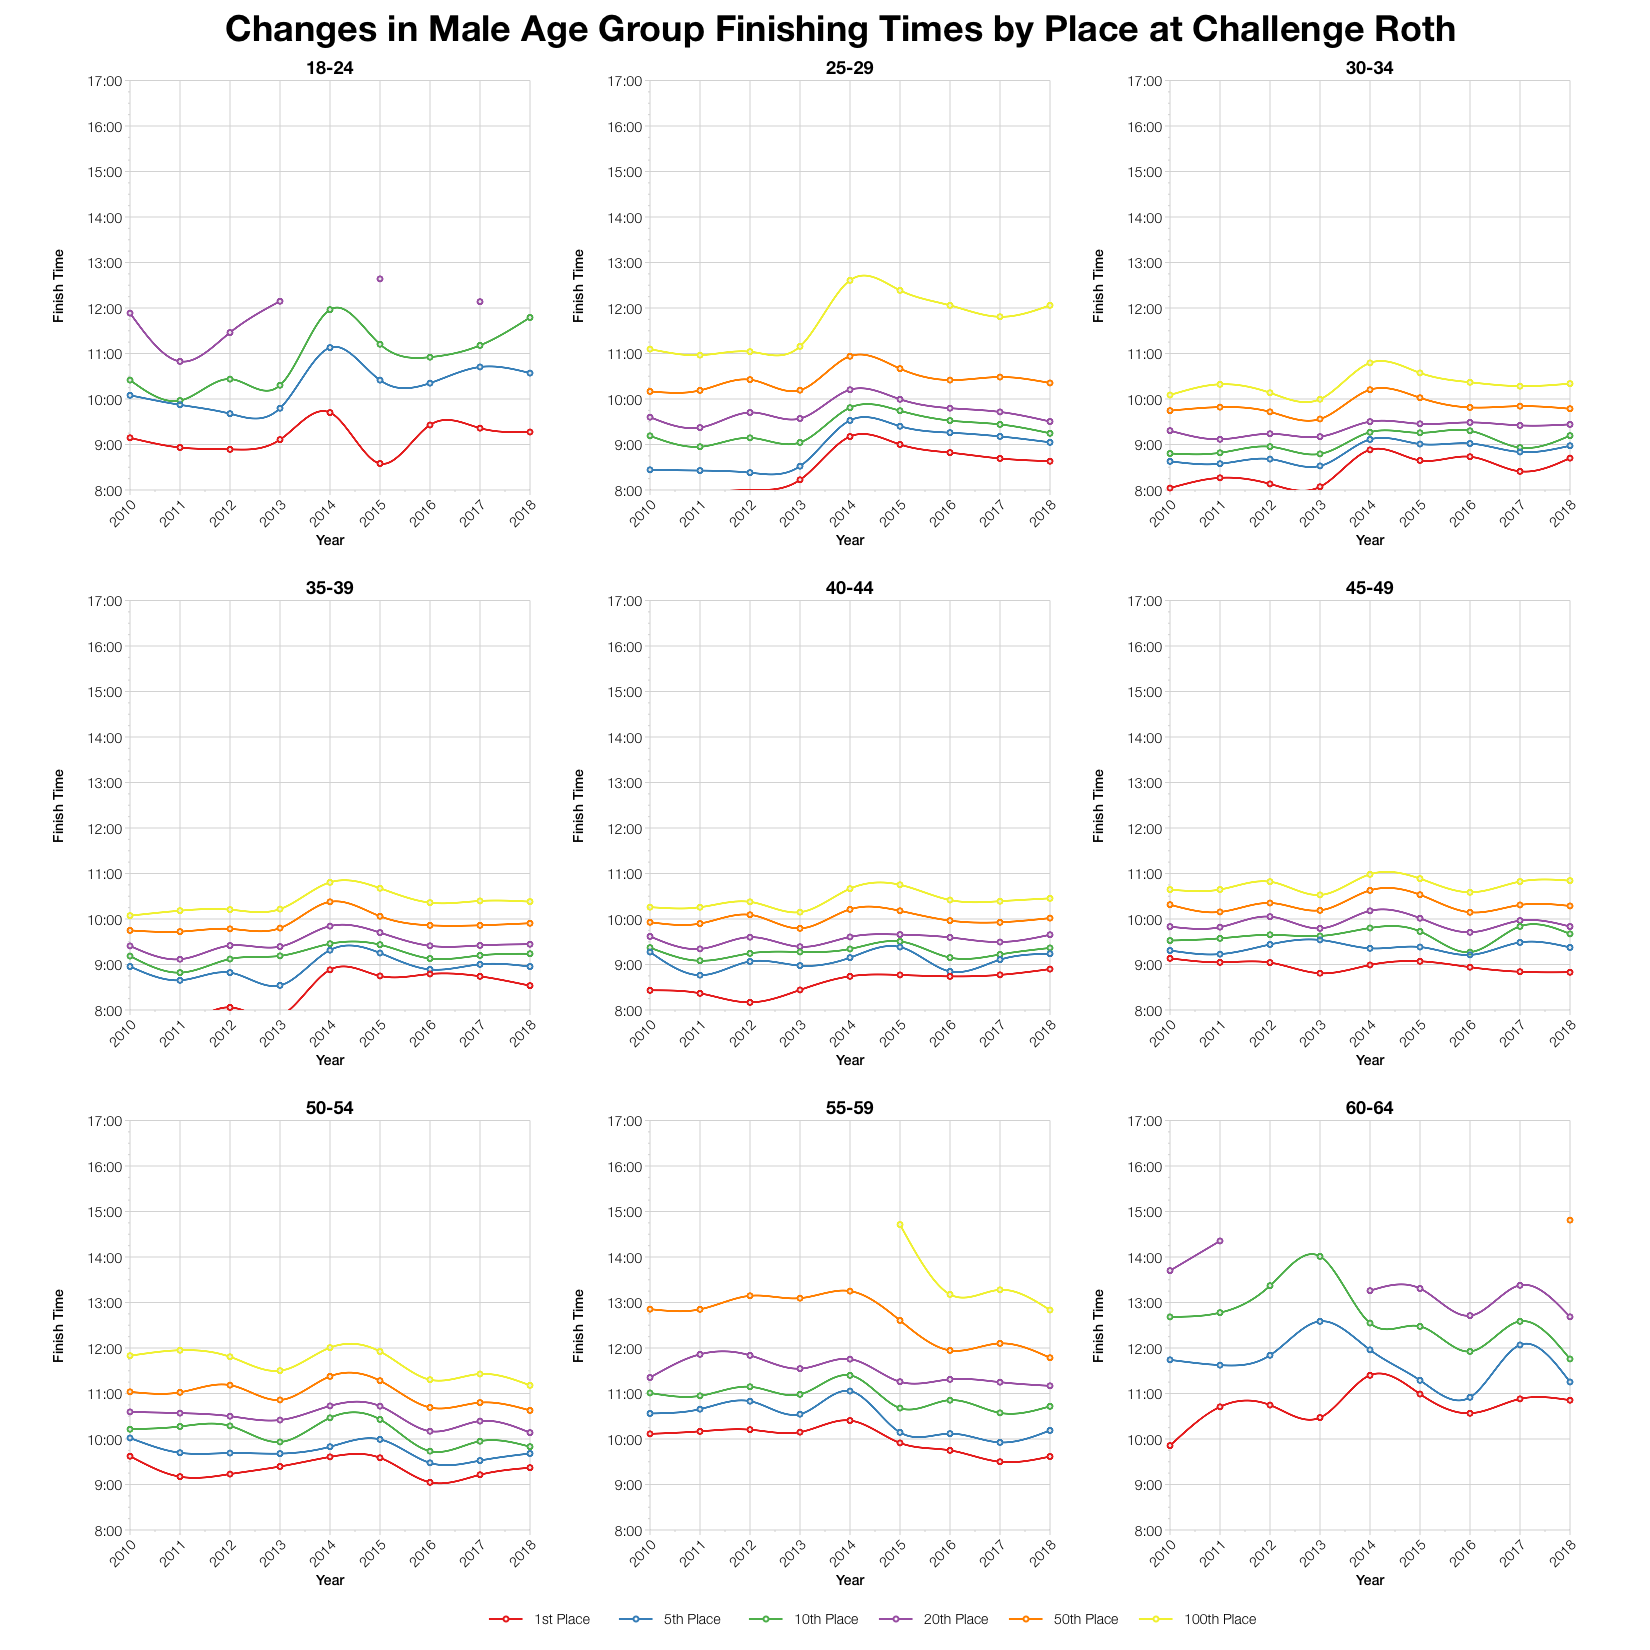
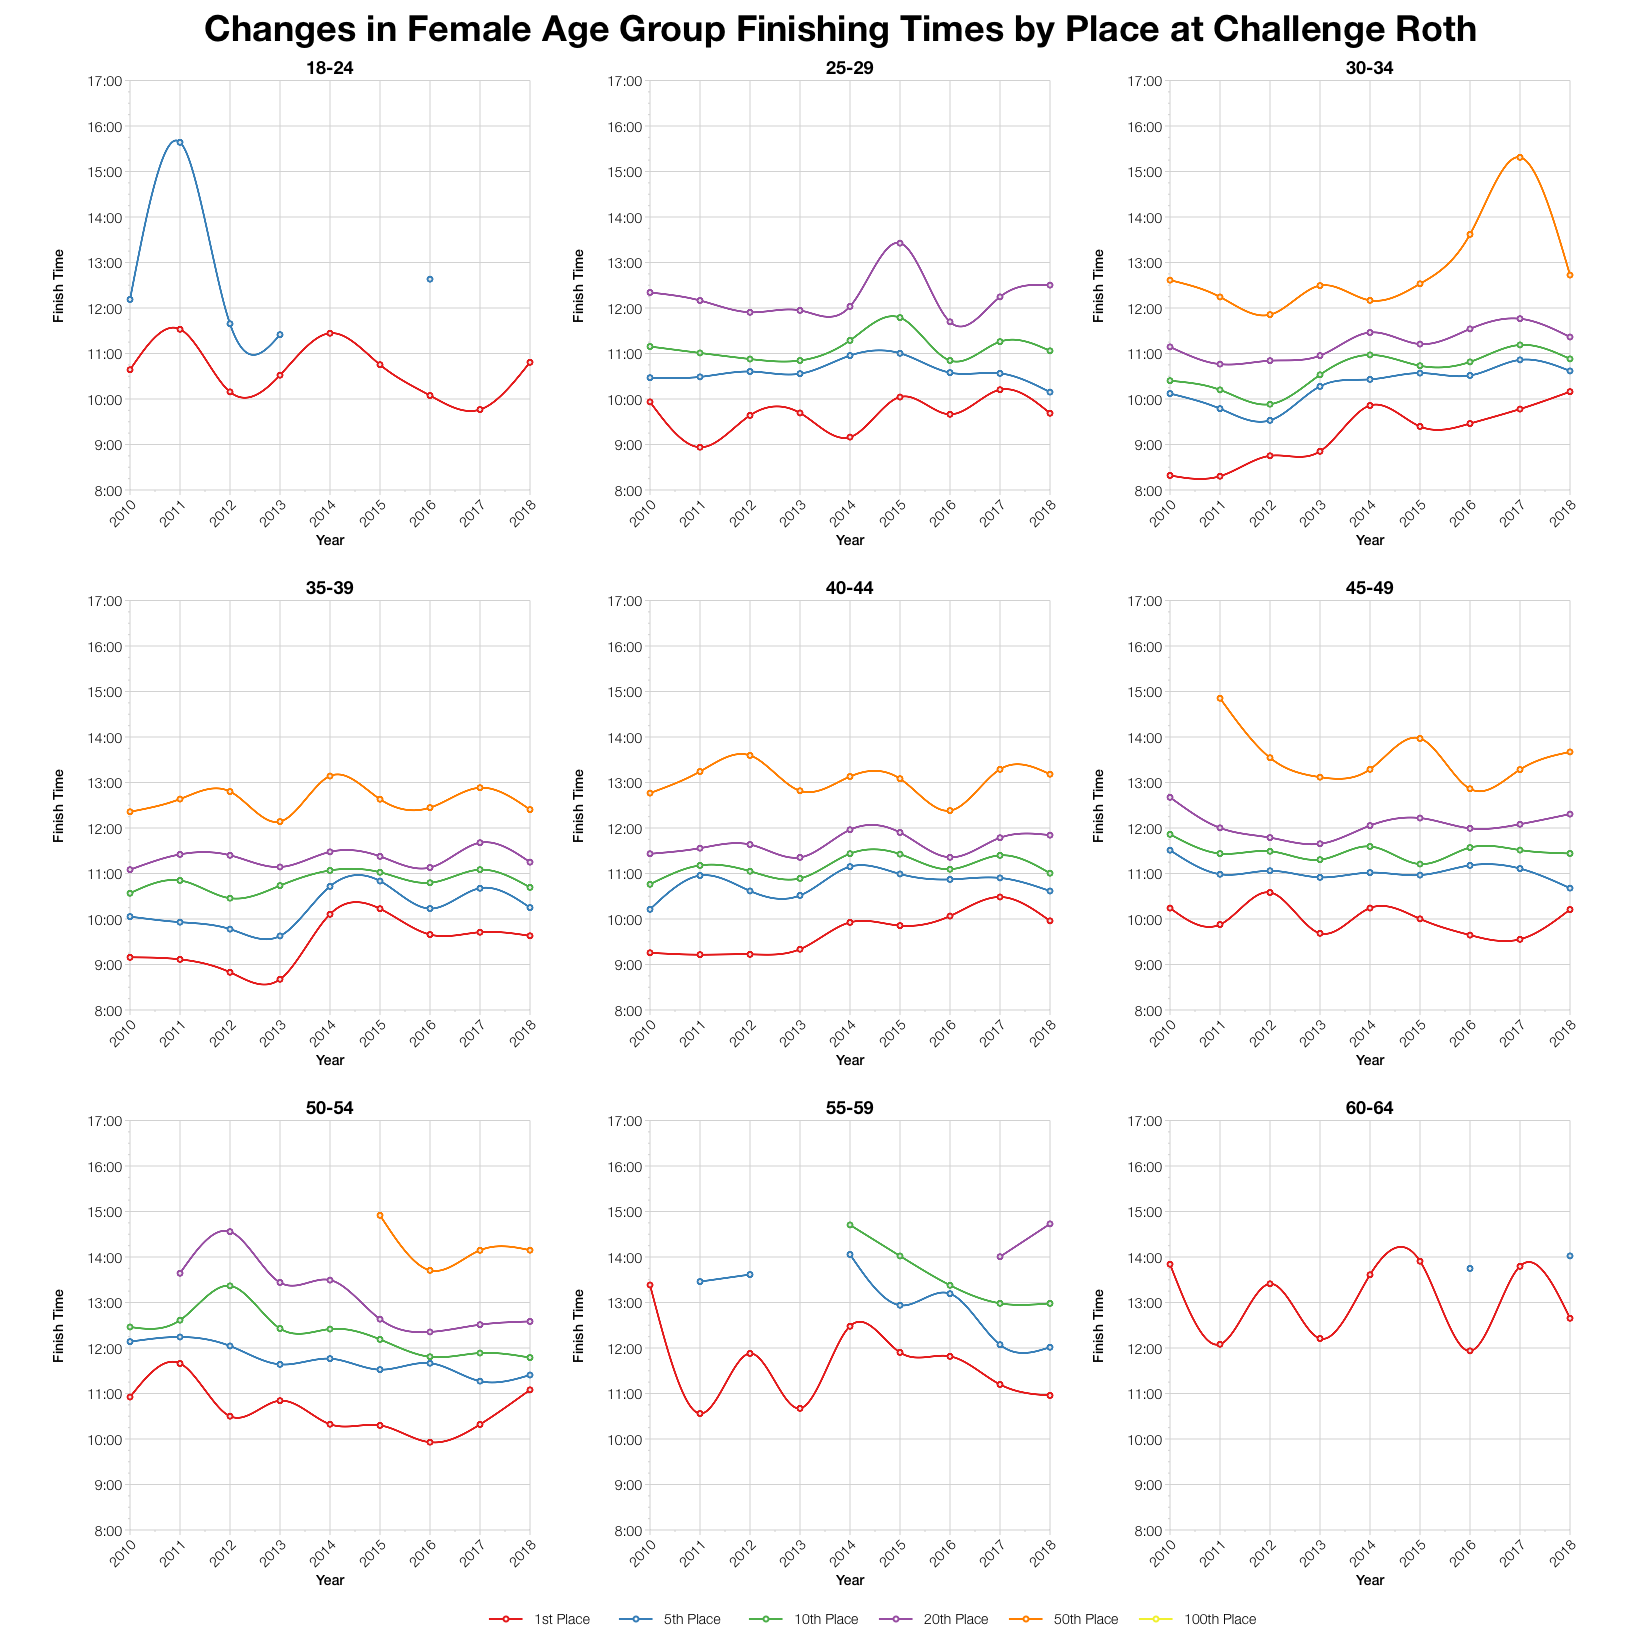
Prior to 2014 Roth’s results included professional in with age groupers, so the first thing you’ll note in the above charts is some very fast times (off the charts) in the 25-35 age range. Min more recent years the pros have been listed in their own categories. With that in mind we can still see that Roth has had quite a stable set of results over the years. This year follows that pattern.
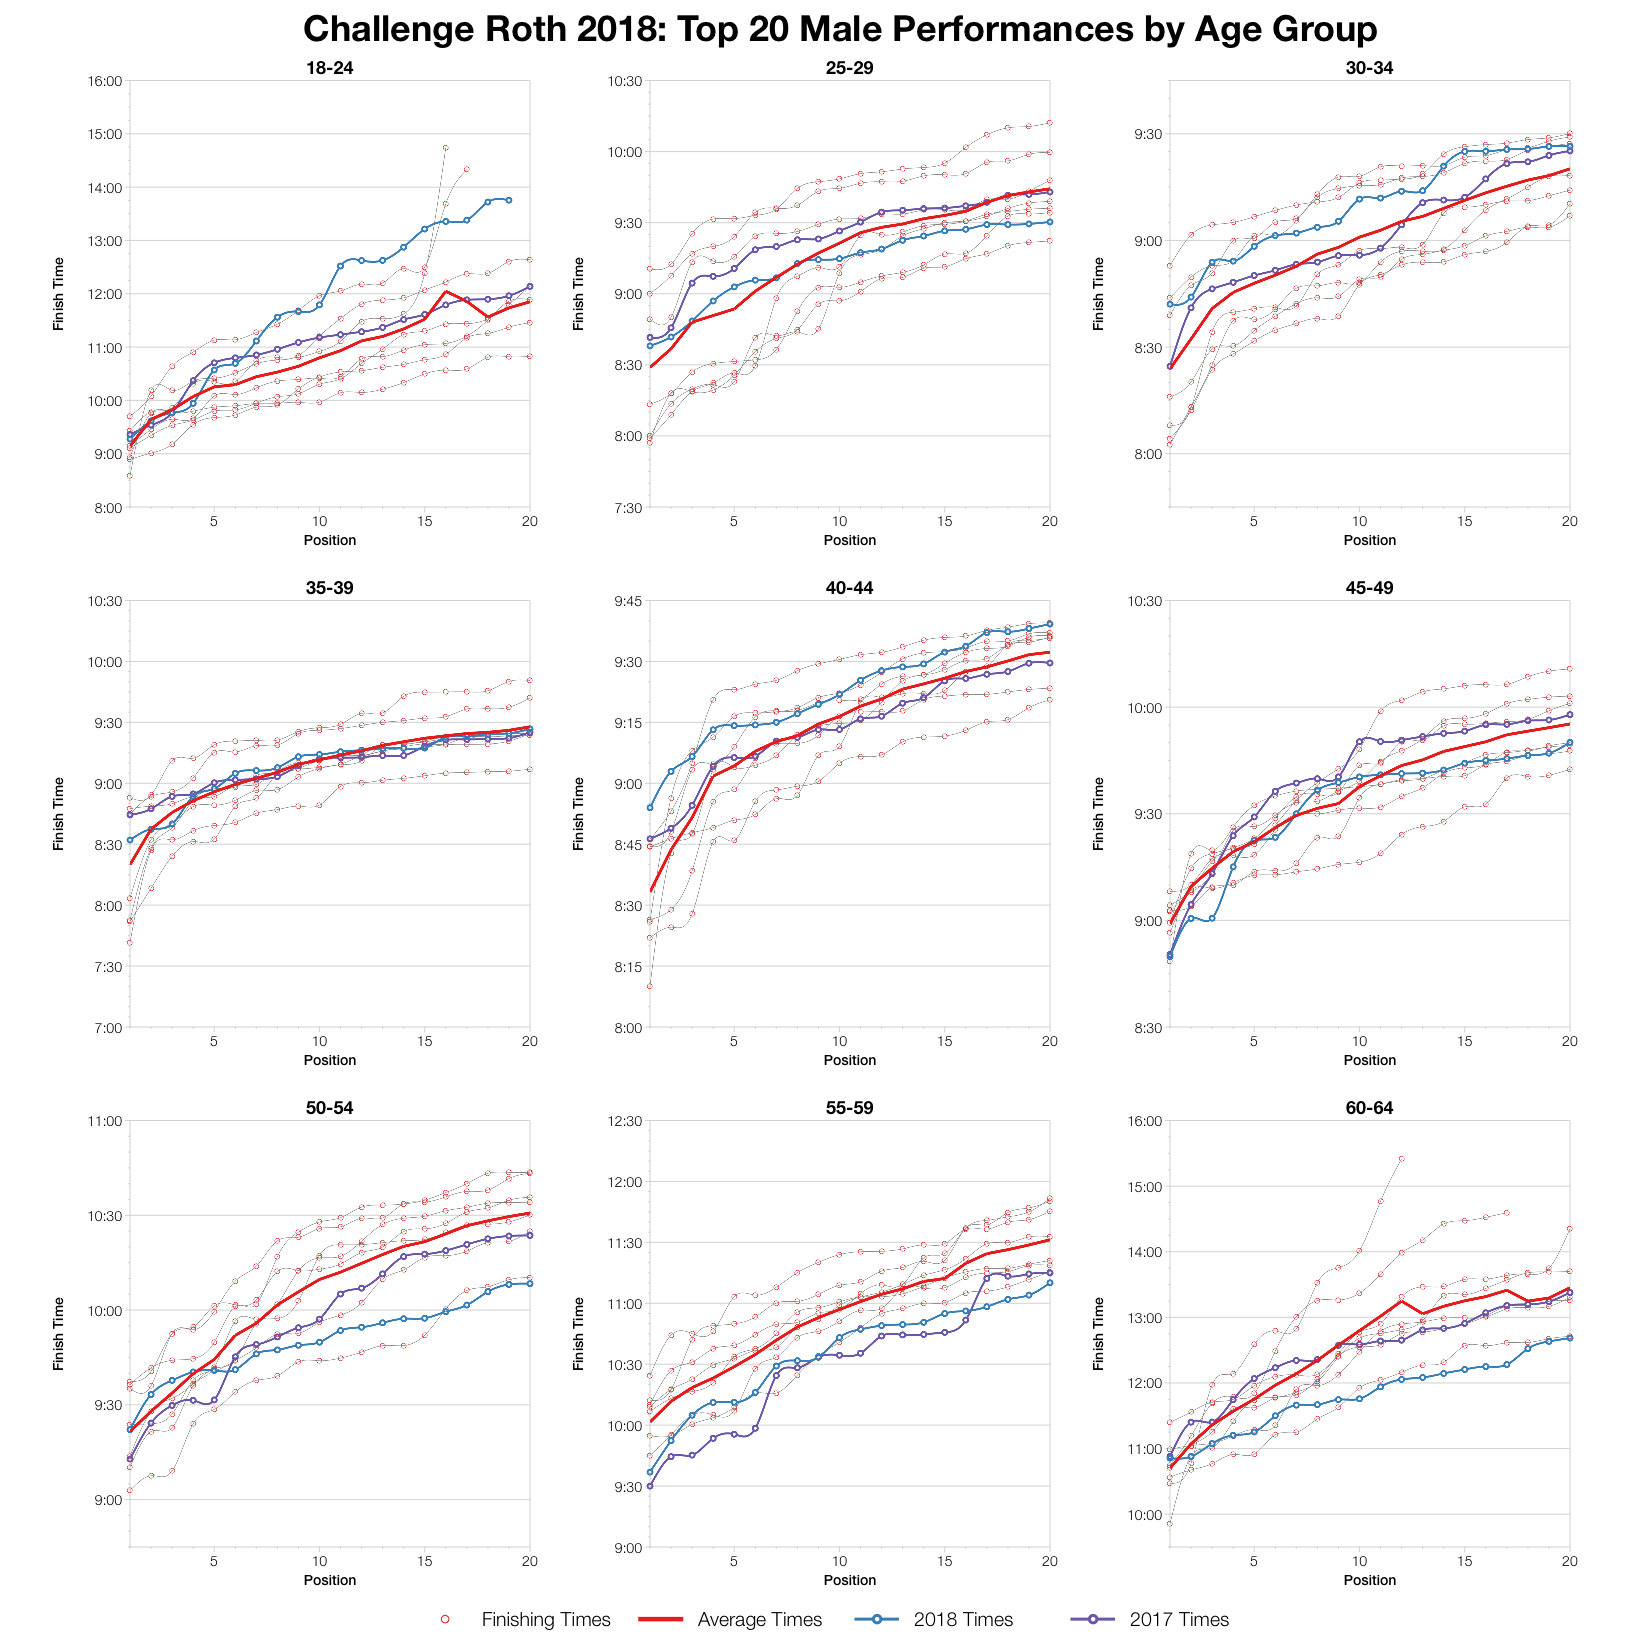
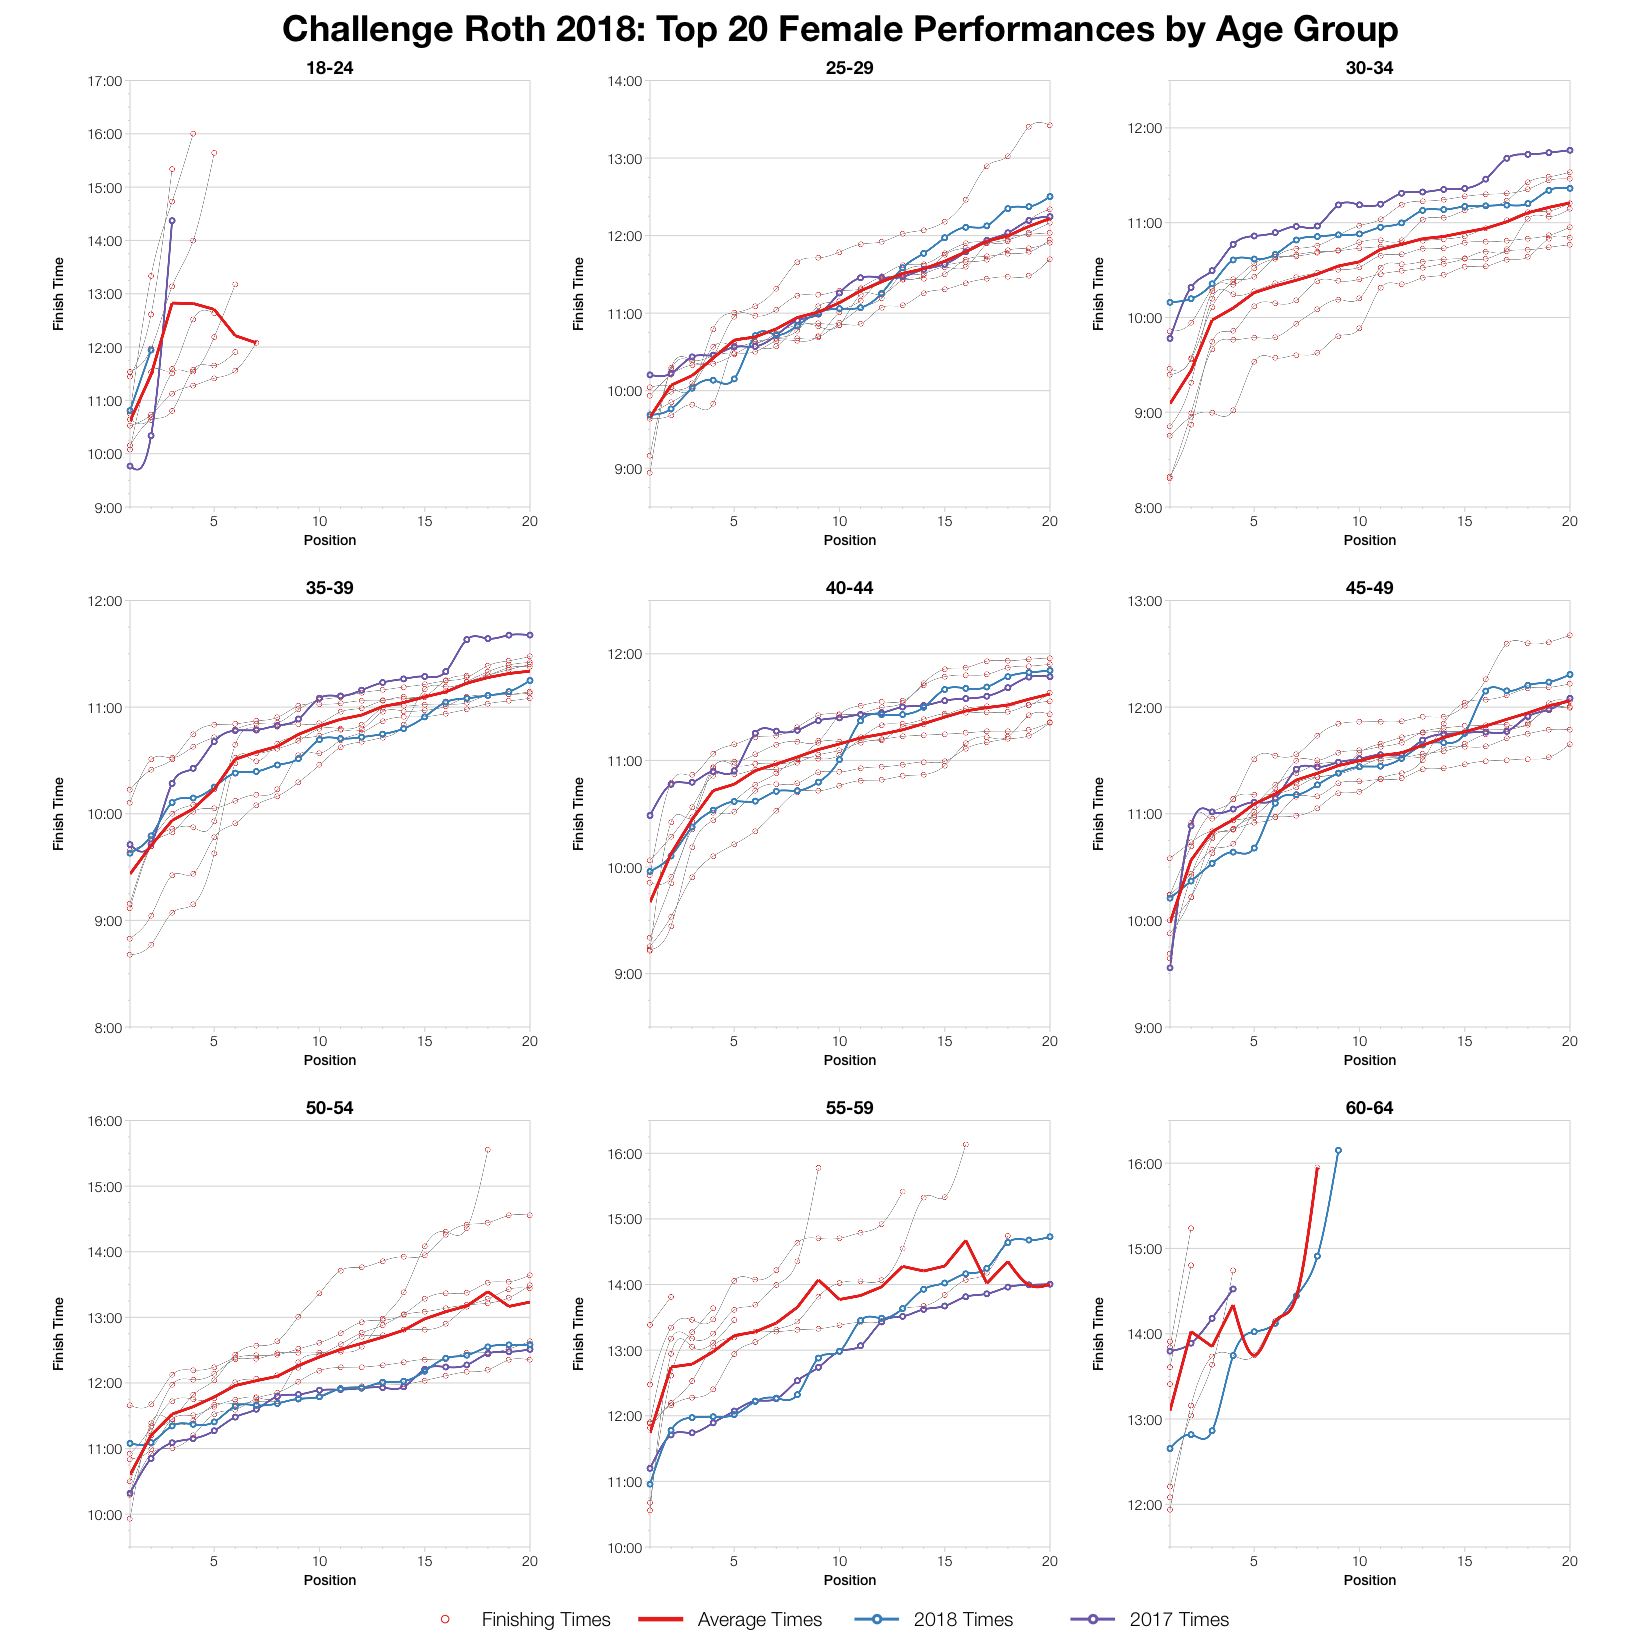
Finally the top twenty within each age group. Those pro times do skew things a little here so perhaps I need to start dropping those results from future analysis. Still the trend is around the existing average line with some variation between age groups.


