Ironman Wisconsin 2018: Age Group Results and Kona Qualification

Latest statistics for Ironman Wisconsin

The final analysis of the week is for Ironman Wisconsin. Wisconsin is a long standing race that draws a large field and as with most events offers 40 age group Kona slots. Flooding in the region impacted the race this year and resulted in some adjustments to the bike course.

Distribution of Finisher Splits at Ironman Wisconsin 2018 Compared with 2008-2017

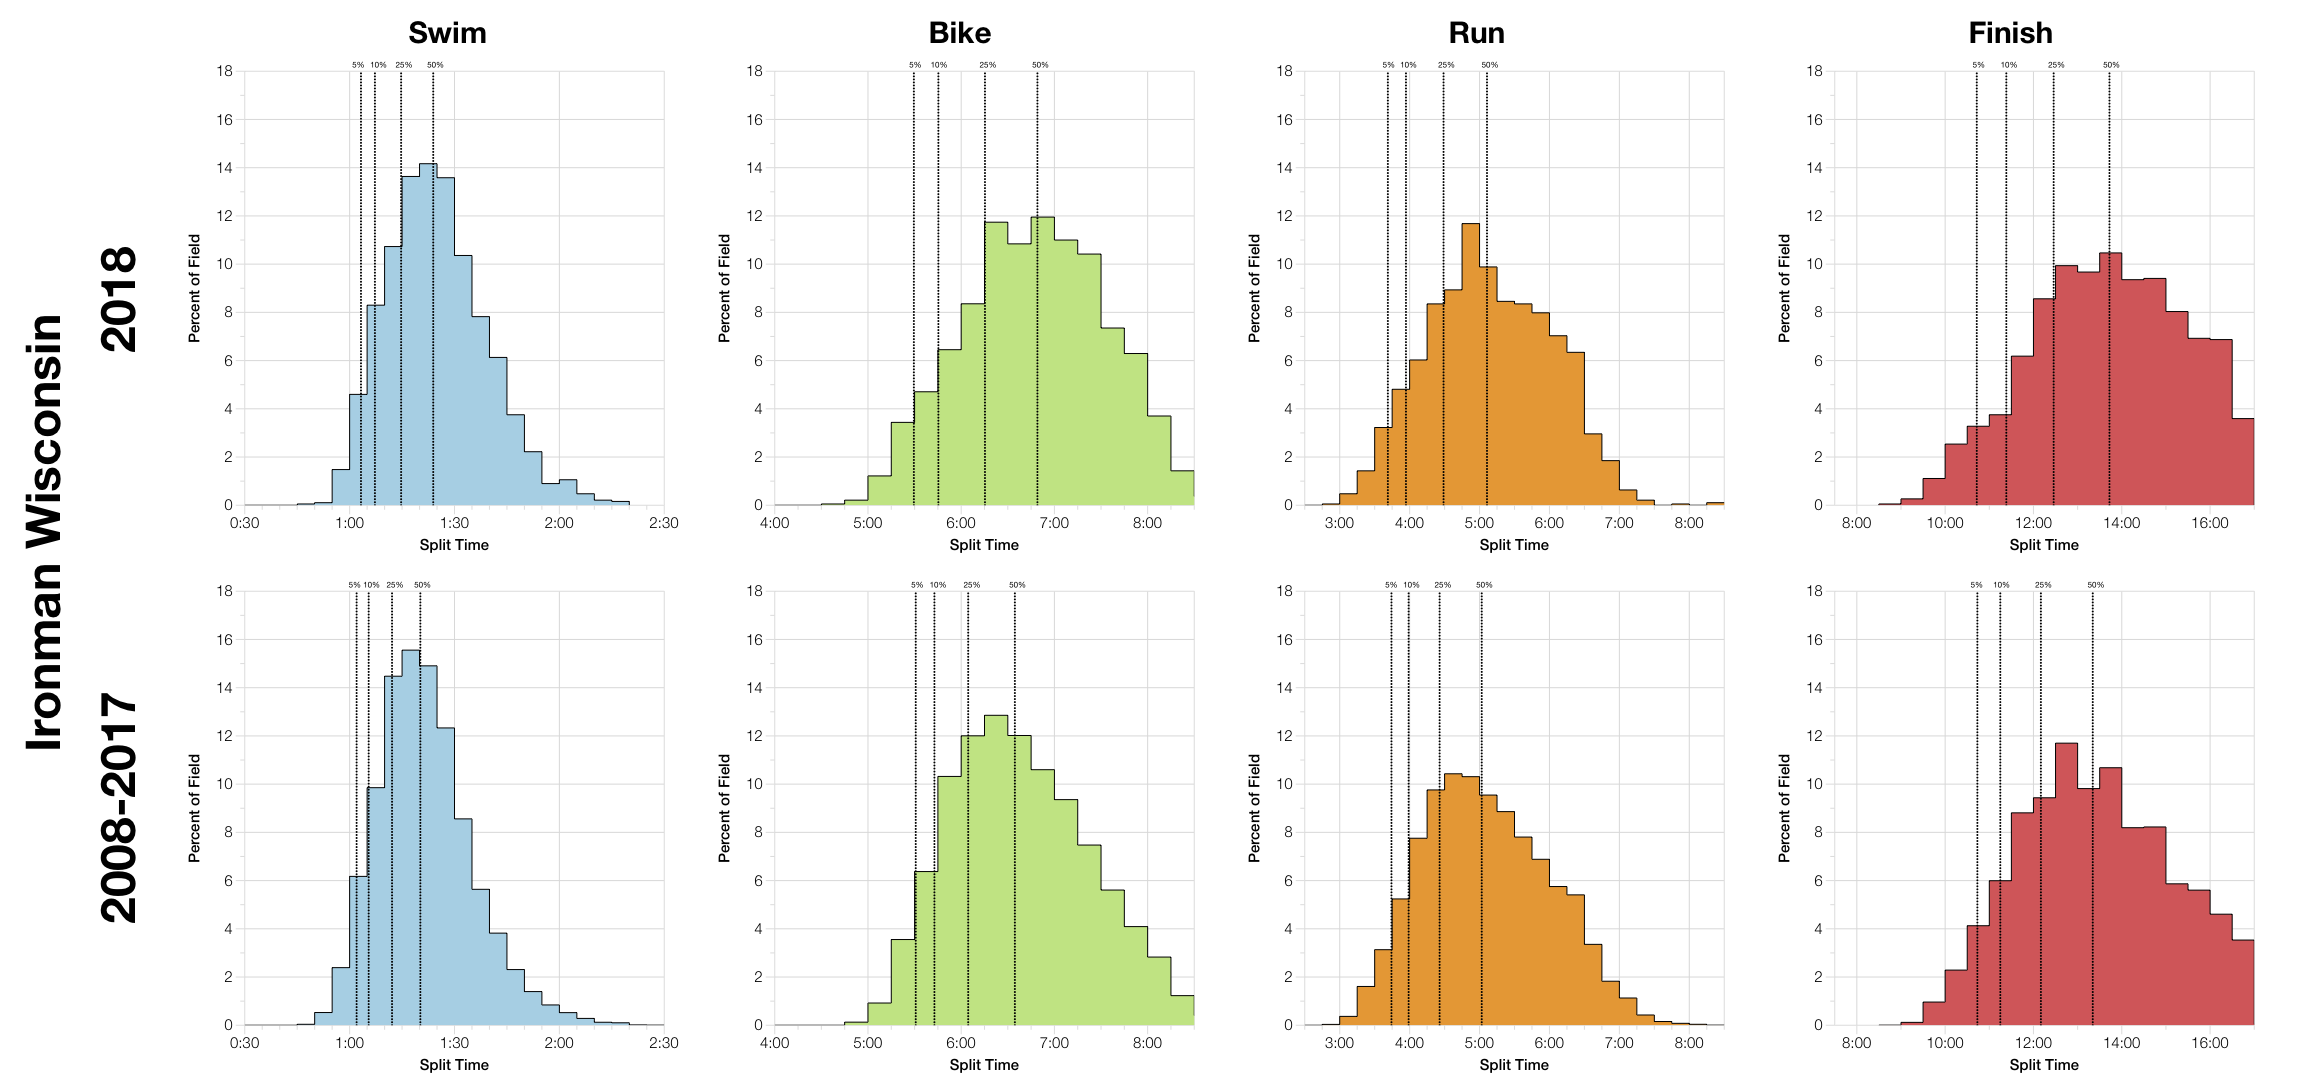
Comparing this year’s distributions with those of previous years it’s clear that 2018 trended a little slower and that this is mostly down to a slower bike distribution. Alongside the bike, the swim also trended slower. The overall impact is at the median, with no real difference in times for the top 5% of the field.

DNS and DNF Rates at Ironman Wisconsin
Year
Listed/Starting Athletes
Swim Finish
Swim DNS/DNF
Bike Finish
Bike DNF
Run Finish
Run DNF
Overall DNS/DNF
2008
2445
2206
9.8%
2139
3%
2082
2.7%
14.8%
2009
2699
2380
11.8%
2307
3.1%
2176
5.7%
19.4%
2010
2912
2522
13.4%
2481
1.6%
2397
3.4%
17.7%
2011
2797
2450
12.4%
2362
3.6%
2245
5%
19.7%
2012
2827
2449
13.4%
2388
2.5%
2337
2.1%
17.3%
2013
2543
2463
3.1%
2390
3%
2332
2.4%
8.3%
2014
2826
2478
12.3%
2391
3.5%
2320
3%
17.9%
2015
2990
2517
15.8%
2433
3.3%
2387
1.9%
20.2%
2016
2881
2395
16.9%
2283
4.7%
2206
3.4%
23.4%
2017
2490
2484
0.2%
2366
4.8%
2290
3.2%
7.8%
2018
2060
2055
0.2%
1981
3.6%
1905
3.8%
7.7%

The DNF rates for 2018 appear unremarkable – around the averages for the course, perhaps on the higher side for the run. This is bearing in mind that prior to 2017 DNS numbers are mixed into the swim and overall stats.

Median Splits by Age Group at Ironman Wisconsin 2018
Median Splits by Age Group at Ironman Wisconsin 2008-2017

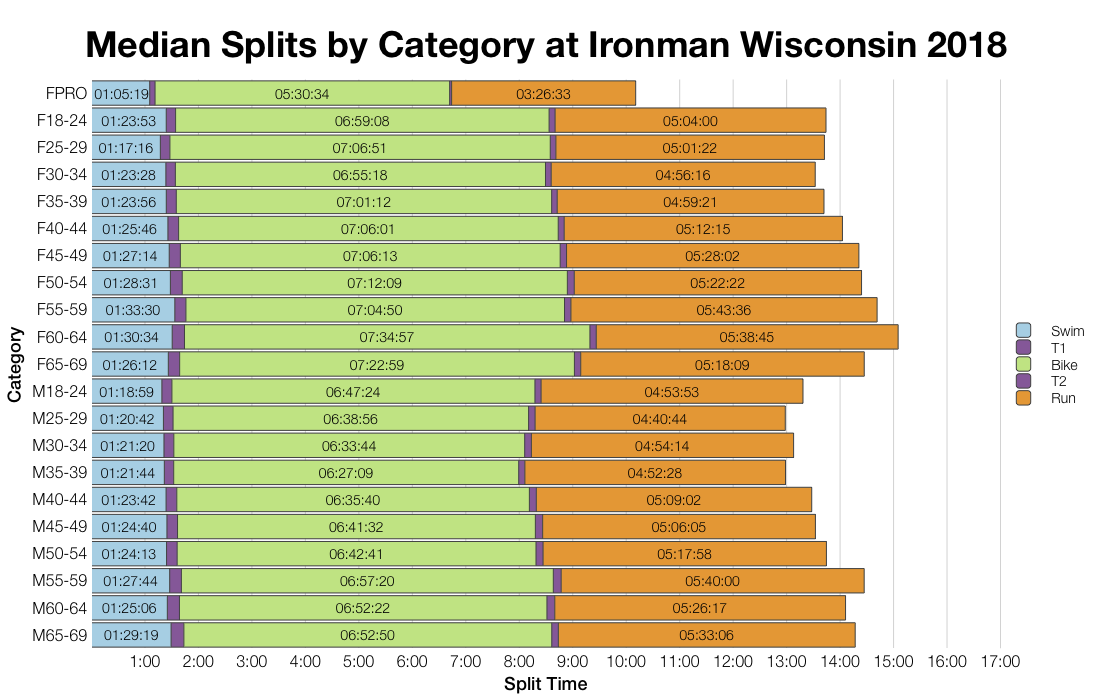
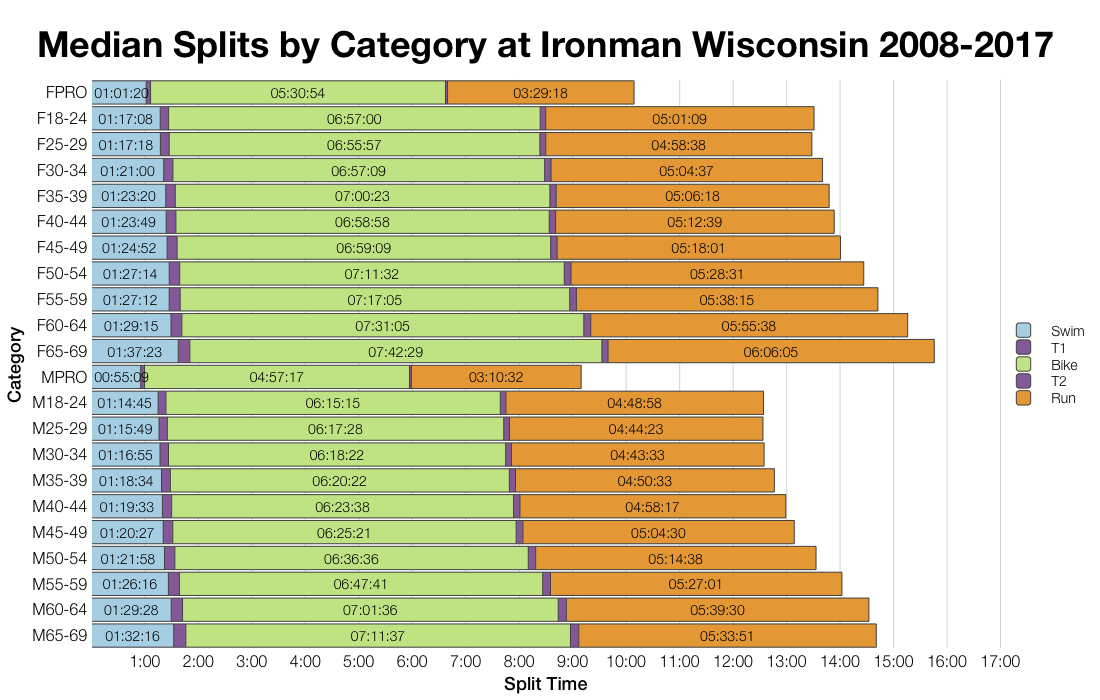
The medians mostly follow the pattern seen in the distributions. It’s the bike where differences are mostly found, although these aren’t that consistent across age groups. Median bike splits are slower for most male age groups, but it’s more varied among the women.

Top 10 Nationalities at Ironman Wisconsin
Country
Count
Percentage
United States
2204
91.6
Canada
57
2.4
Mexico
30
1.2
Germany
13
0.5
United Kingdom
11
0.5
Japan
8
0.3
Philippines
8
0.3
Australia
6
0.2
India
5
0.2
Ireland
4
0.2
Ironman Wisconsin 2018 Predicted Kona Qualifiers by Country
Country
Percentage of Slots
Percentage of Field
United States
90.0
91.6
Canada
5.0
2.4
United Kingdom
2.5
0.5
Japan
2.5
0.3

This is very clearly a North American race with over 90% of the field from the US or Canada. That’s where the Kona slots stay too.

Changes in Male Finishing Times by Position at Ironman Wisconsin
Changes in Female Finishing Times by Position at Ironman Wisconsin

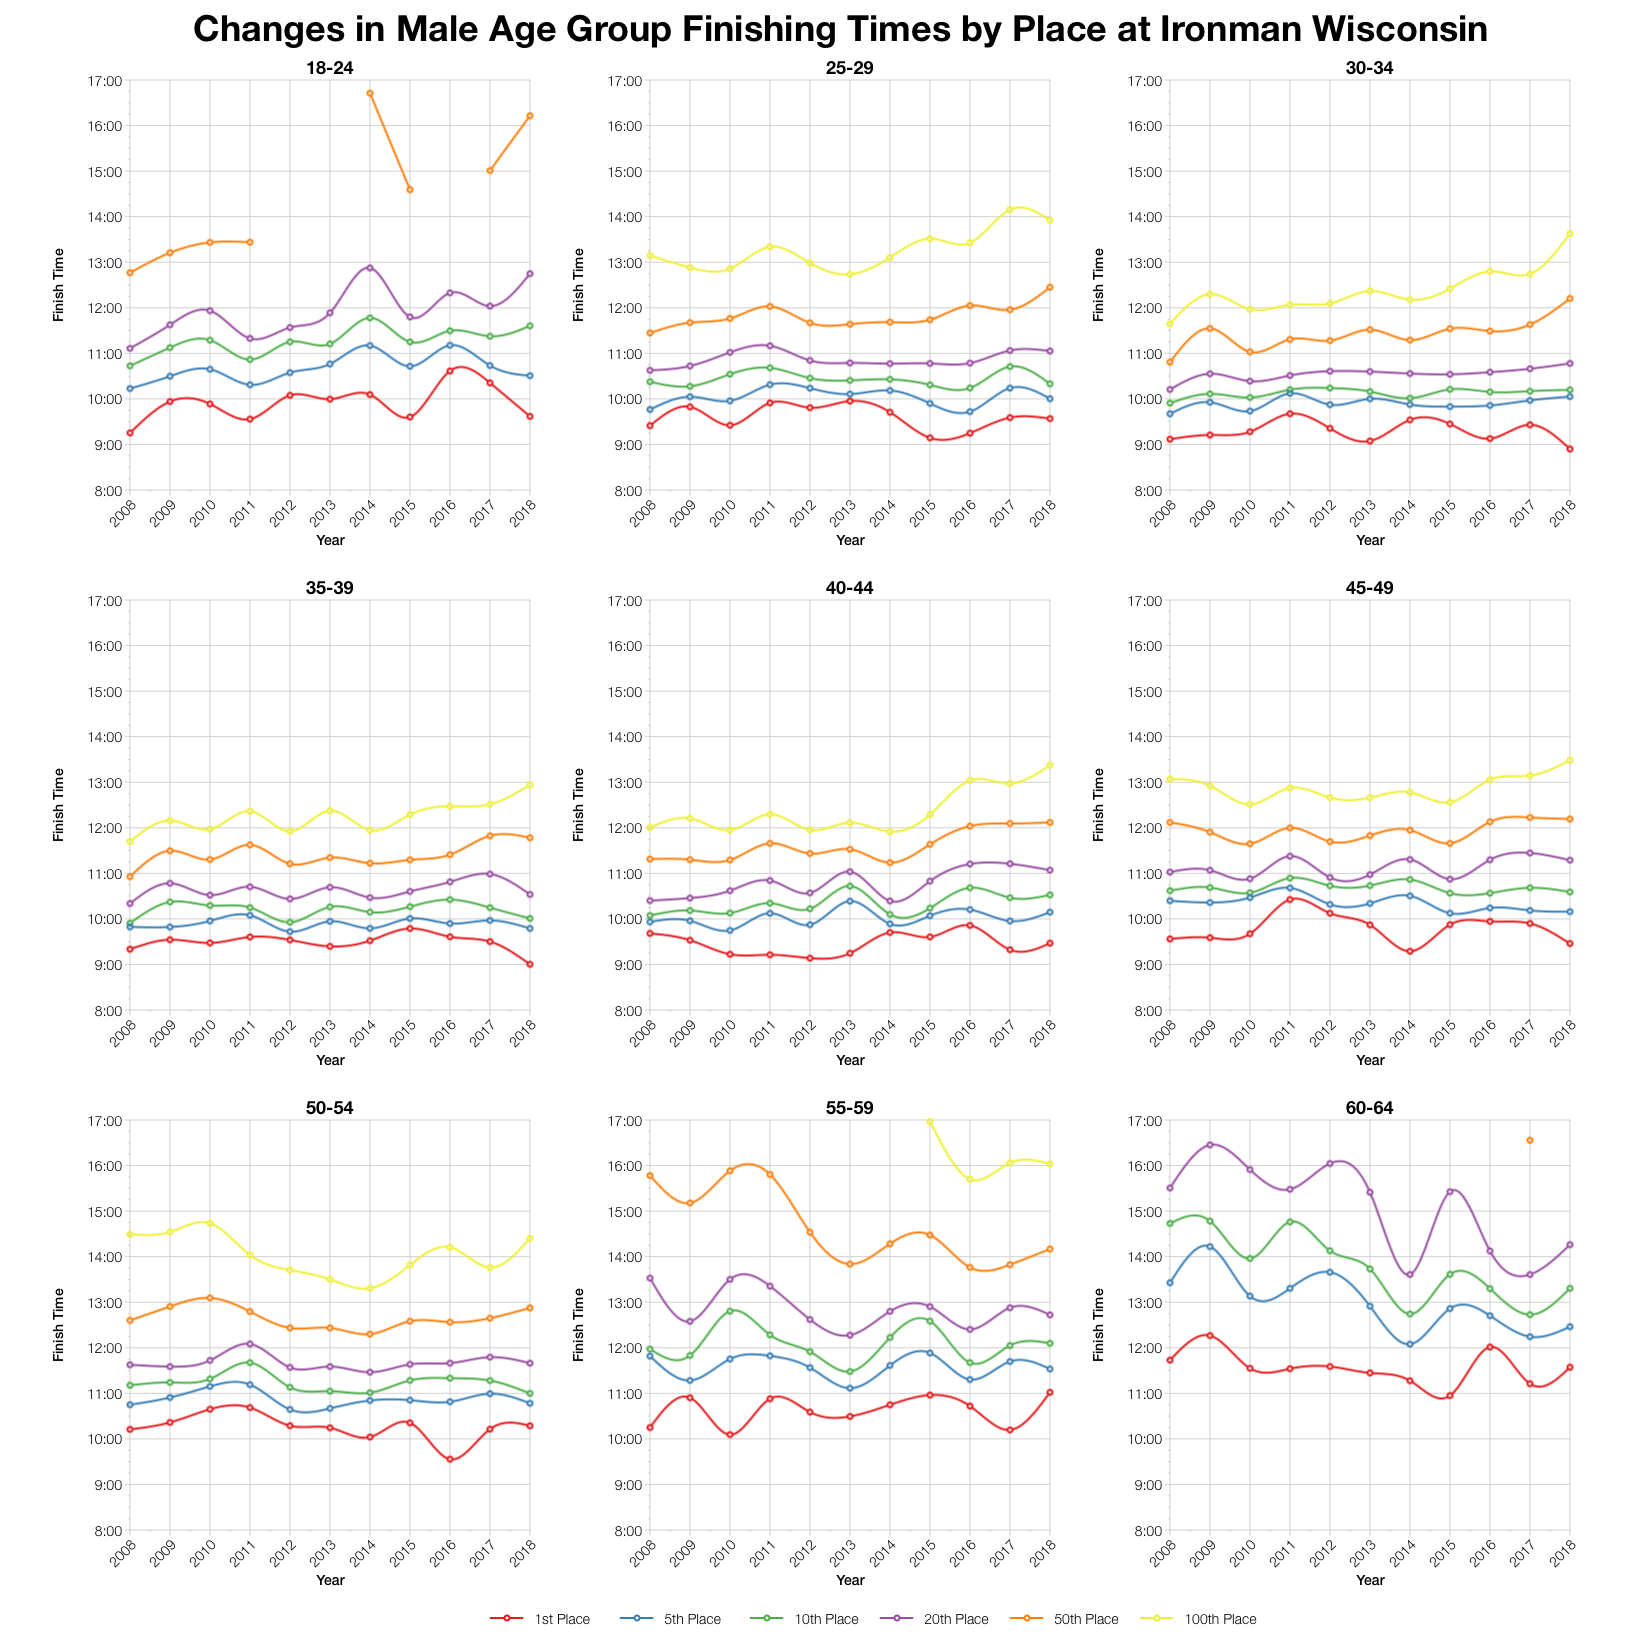
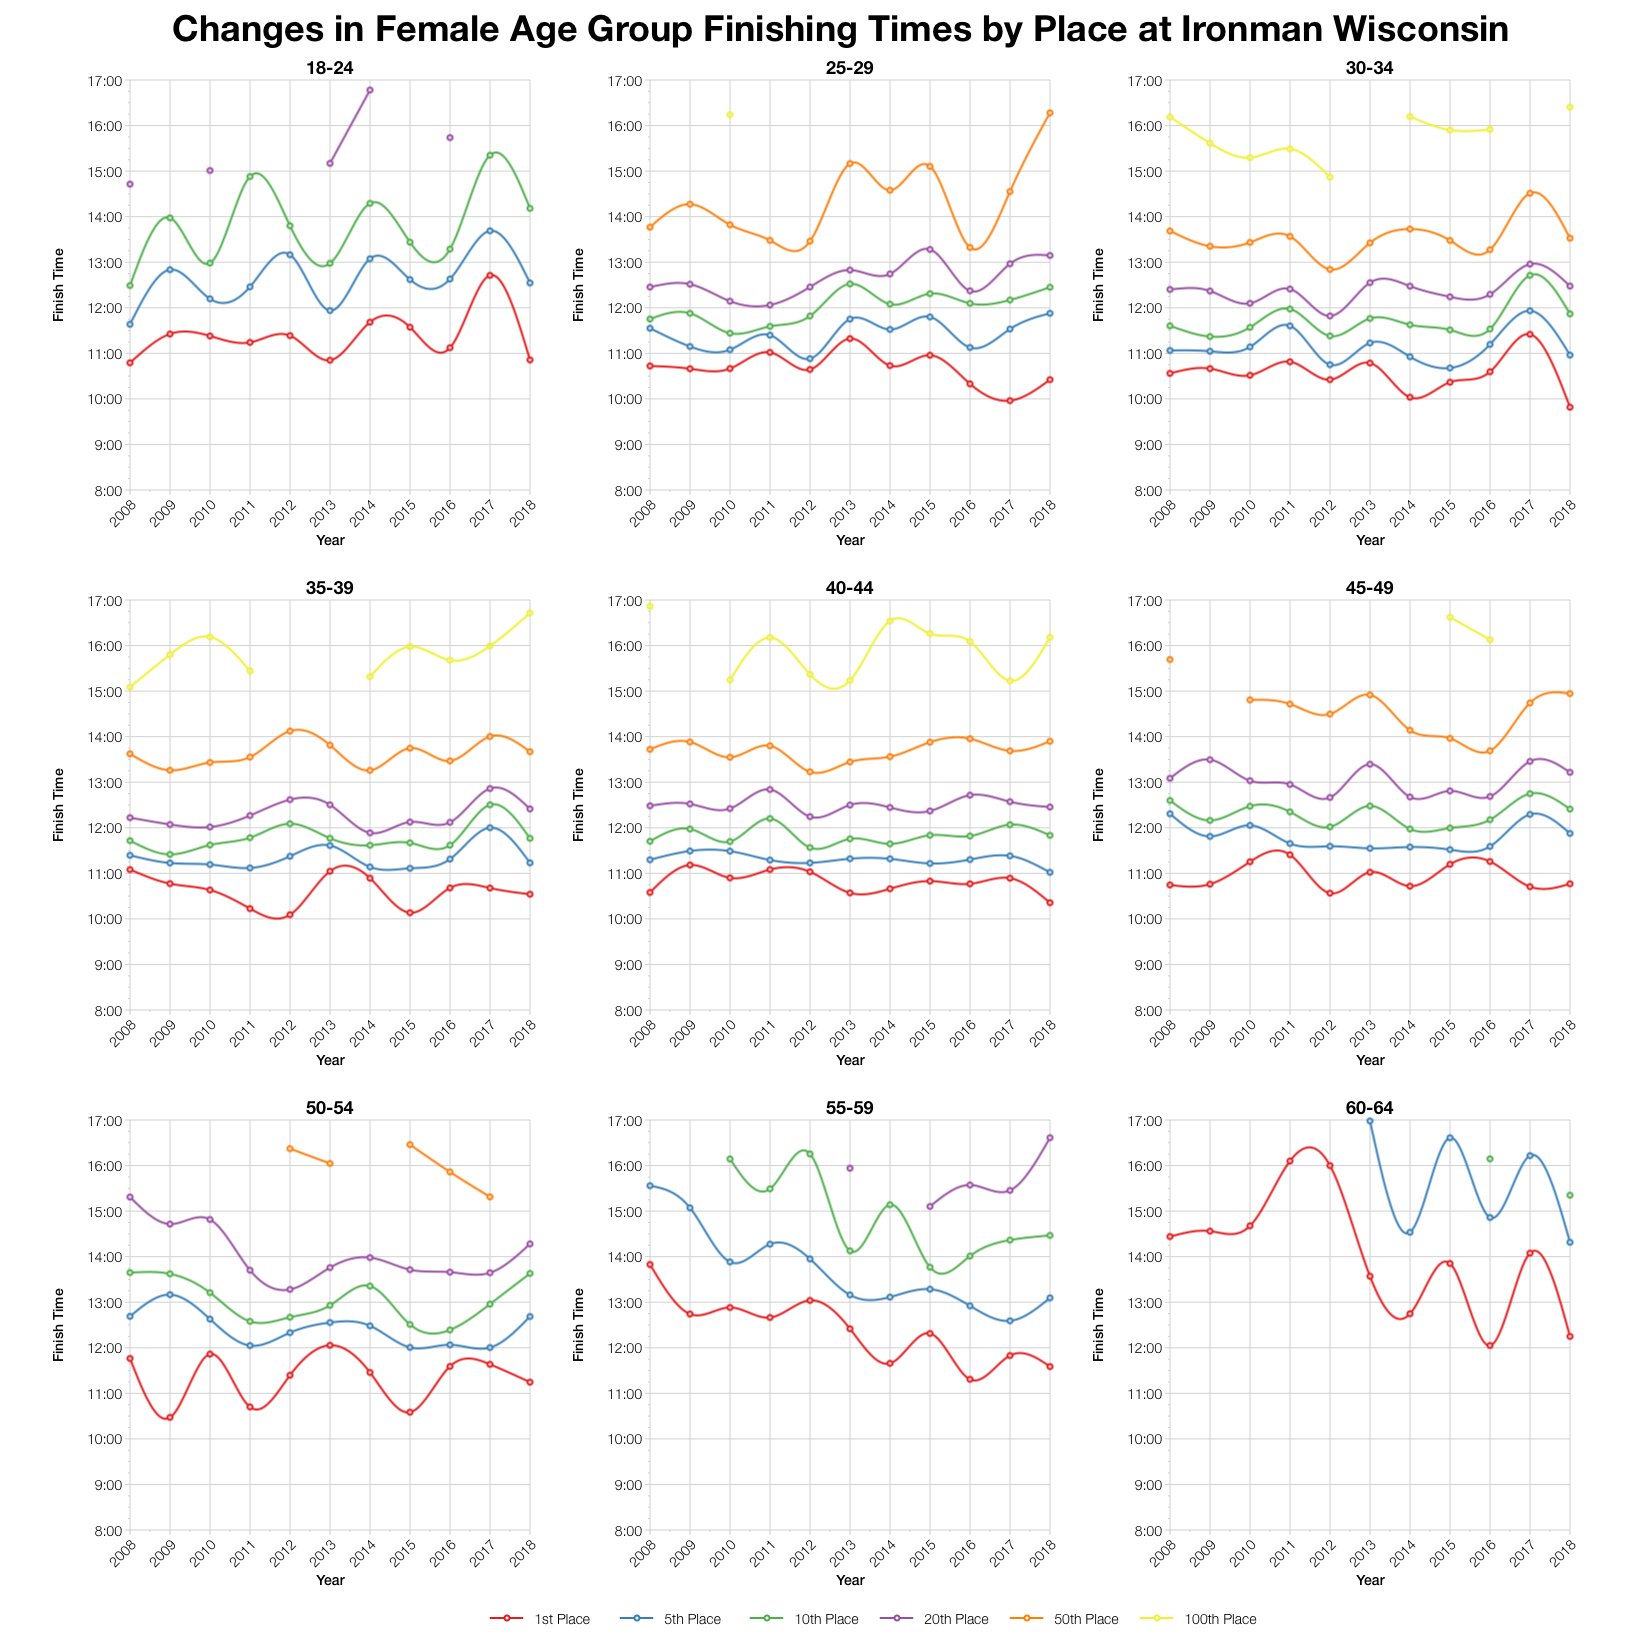
For those towards the front of their age group this year’s finish times often dropped. Those further back didn’t necessarily see such a positive change. There’s a spread in performance with those at the front showing good times for this course and those towards the middle or back trending slower. Enough to impact the median times and shape of the results distribution while seeing the Kona qualification race remain as competitive as usual.

Ironman Wisconsin 2018 Predicted Kona Qualification Times
Age Group
Slots
Winner
Average Kona Qualifier
Final Qualifier
M18-24
1
09:36:55
09:36:55
09:36:55
M25-29
3
09:34:03
09:43:00
09:53:08
M30-34
4
08:53:55
09:23:34
09:42:54
M35-39
4
09:00:11
09:31:30
09:44:00
M40-44
4
09:28:01
09:41:02
09:55:05
M45-49
4
09:27:32
09:48:43
09:59:45
M50-54
4
10:17:13
10:26:32
10:39:57
M55-59
2
11:01:22
11:01:53
11:02:24
M60-64
1
11:34:24
11:34:24
11:34:24
M65-69
1
11:57:29
11:57:29
11:57:29
M70-74
1
13:23:15
13:23:15
13:23:15
F18-24
1
10:51:20
10:51:20
10:51:20
F25-29
1
10:25:17
10:25:17
10:25:17
F30-34
1
09:49:01
09:49:01
09:49:01
F35-39
1
10:32:29
10:32:29
10:32:29
F40-44
1
10:21:18
10:21:18
10:21:18
F45-49
1
10:46:13
10:46:13
10:46:13
F50-54
1
11:14:43
11:14:43
11:14:43
F55-59
1
11:35:13
11:35:13
11:35:13
F60-64
1
12:14:58
12:14:58
12:14:58
F65-69
1
14:07:00
14:07:00
14:07:00
F70-74
1
14:57:24
14:57:24
14:57:24

Based on the start list I’ve estimated the Kona slot allocation and from that the automatic qualifying times. As I’ve noted in my other analyses this week I have updated the allocation algorithm as it’s become clear that Ironman have also change theirs. My allocation is close, but doesn’t precisely match Ironman at the moment and may vary slightly for some age groups. Roll down will also impact on final qualification times. You can compare with other races on my Kona qualification page.

Top Twenty Male Performances and Kona Qualification by Age Group at Ironman Wisconsin 2018
Top Twenty Female Performances and Kona Qualification by Age Group at Ironman Wisconsin 2018

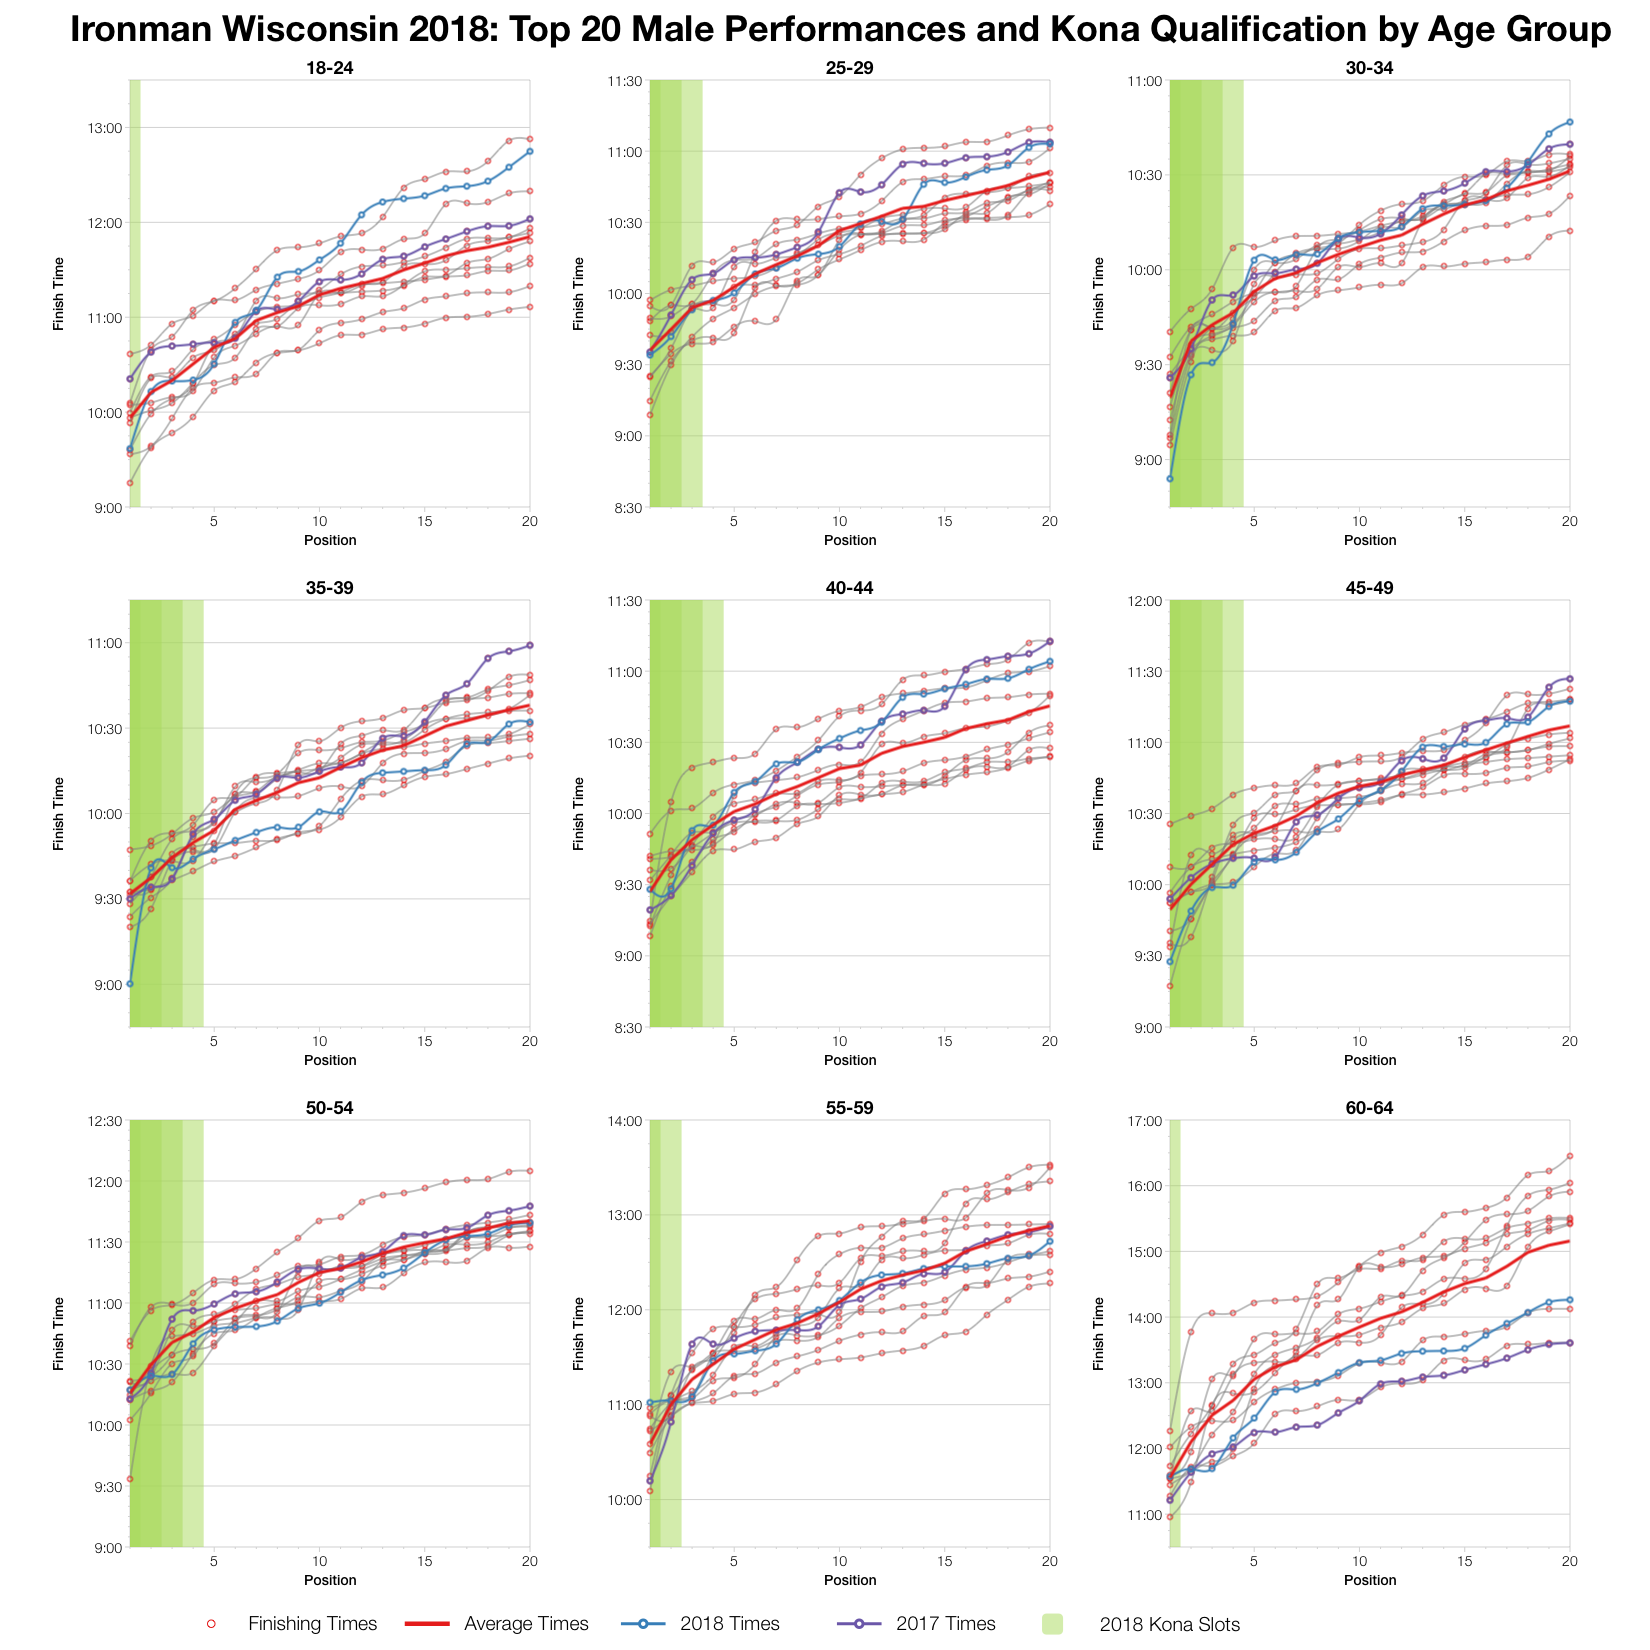
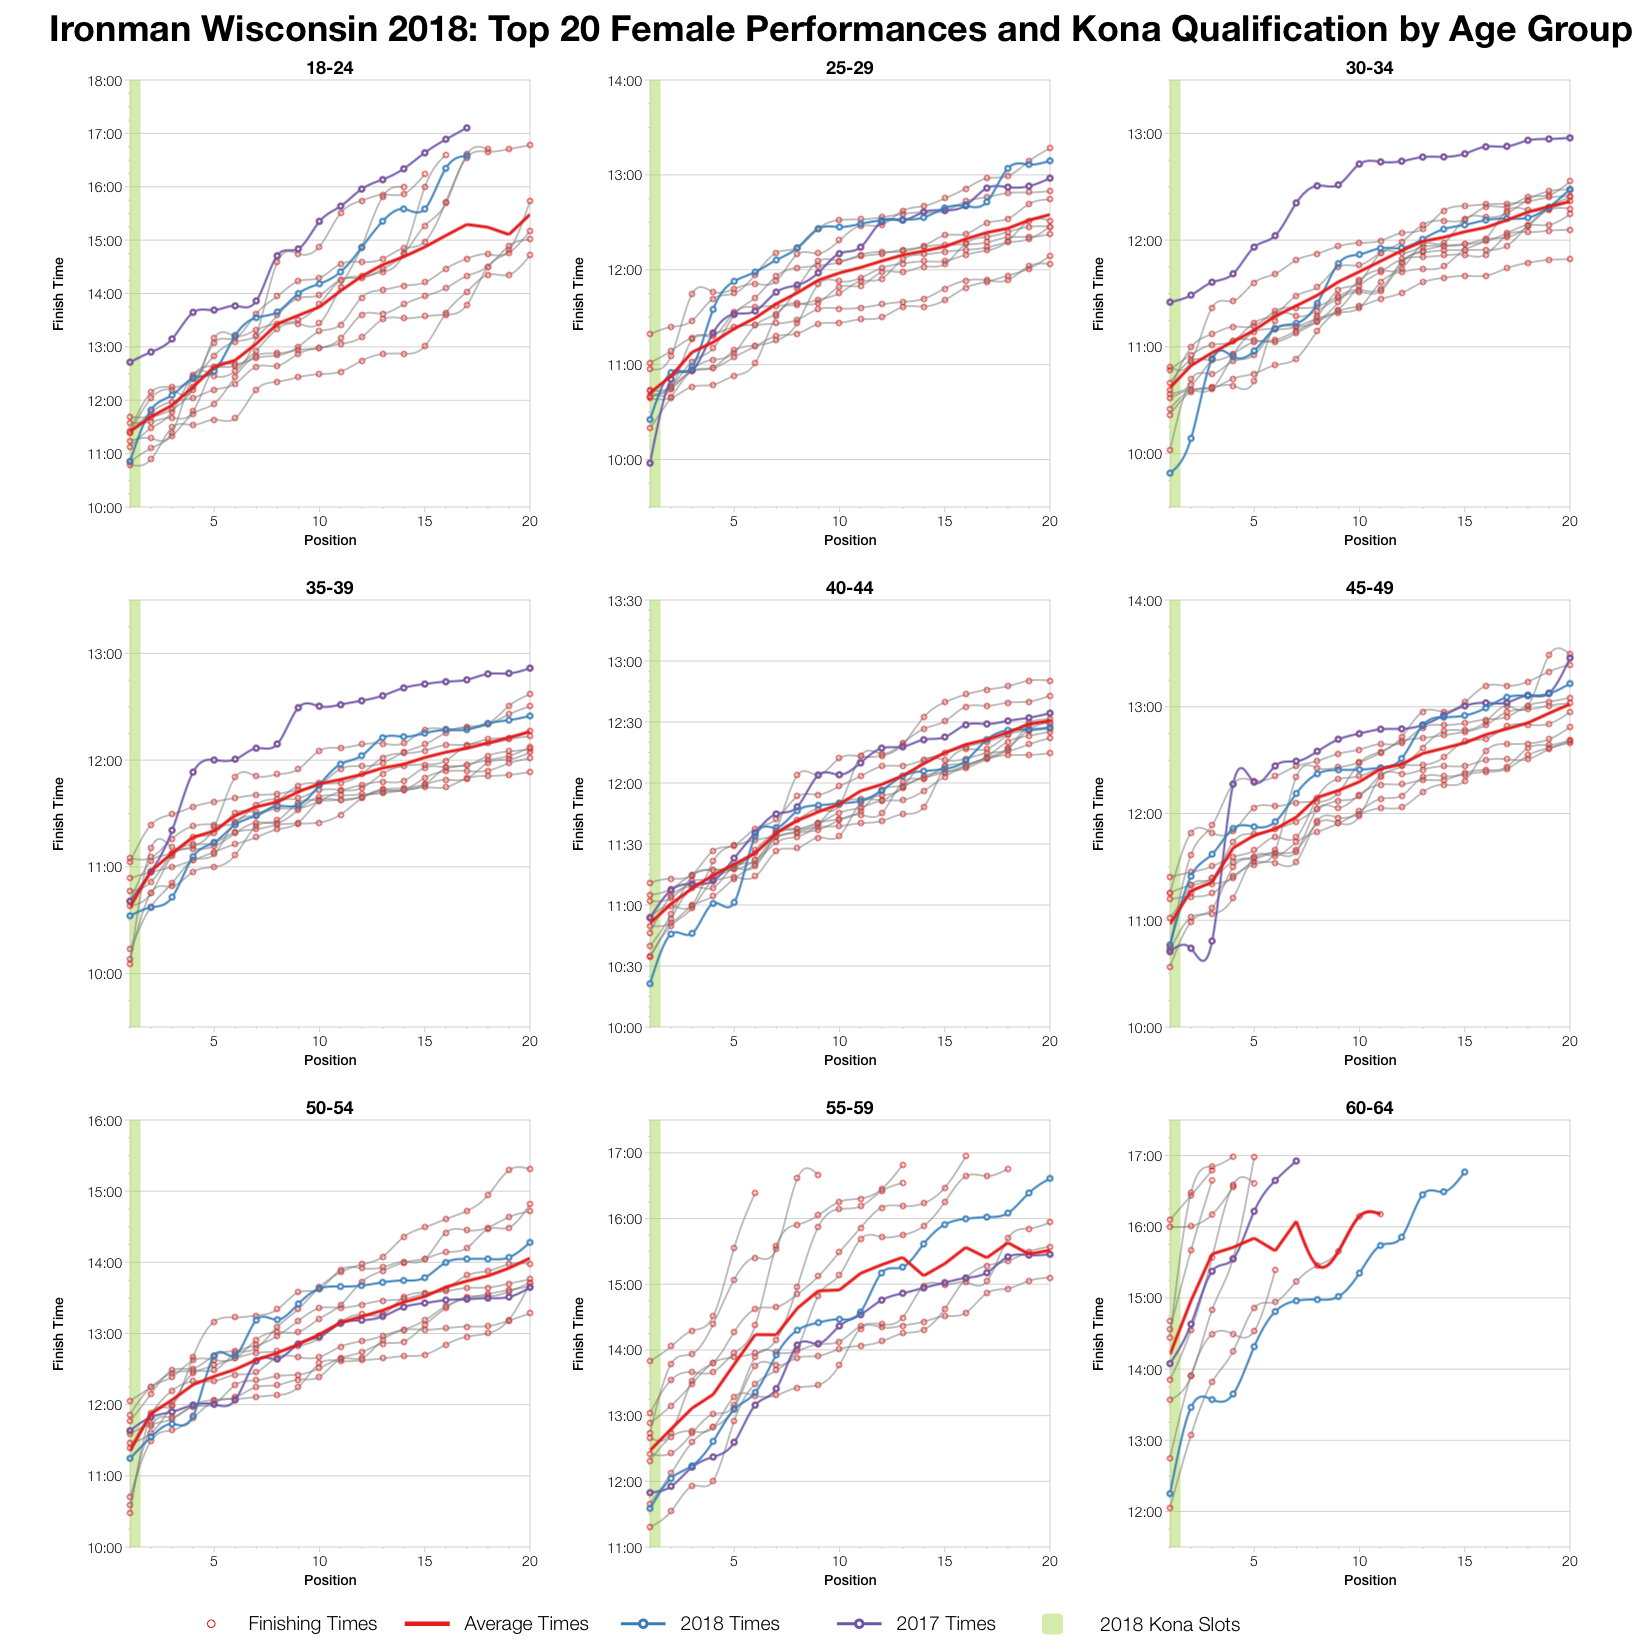
Wrapping things up with the top twenty in each age group we have an average set of results here. Times tend to trend around the averages through most of the top twenties. Many of the podium places are faster than average though and even the fastest for the course in some age groups. So a competitive qualifying year when the bulk of the field trended slightly slower.

You can access a spreadsheet of the full results from Ironman Wisconsin 2018 on my Google Drive.

Latest statistics for Ironman Wisconsin

Kona Qualification

Compare qualification times across the Ironman Calendar.

Kona Consultancy

Individual race analysis and guidance for Kona qualification.

Support the Stats

Support the continued development of these stats.

Comments