I’m going to take a quick detour from the usual Ironman analysis for an analysis of Ironman 70.3 Weymouth. Conditions were rough for this year’s race with winds and rain throughout the swim and bike. The rough sea conditions saw the swim shortened which impacts on the times we’re comparing for this year’s race.
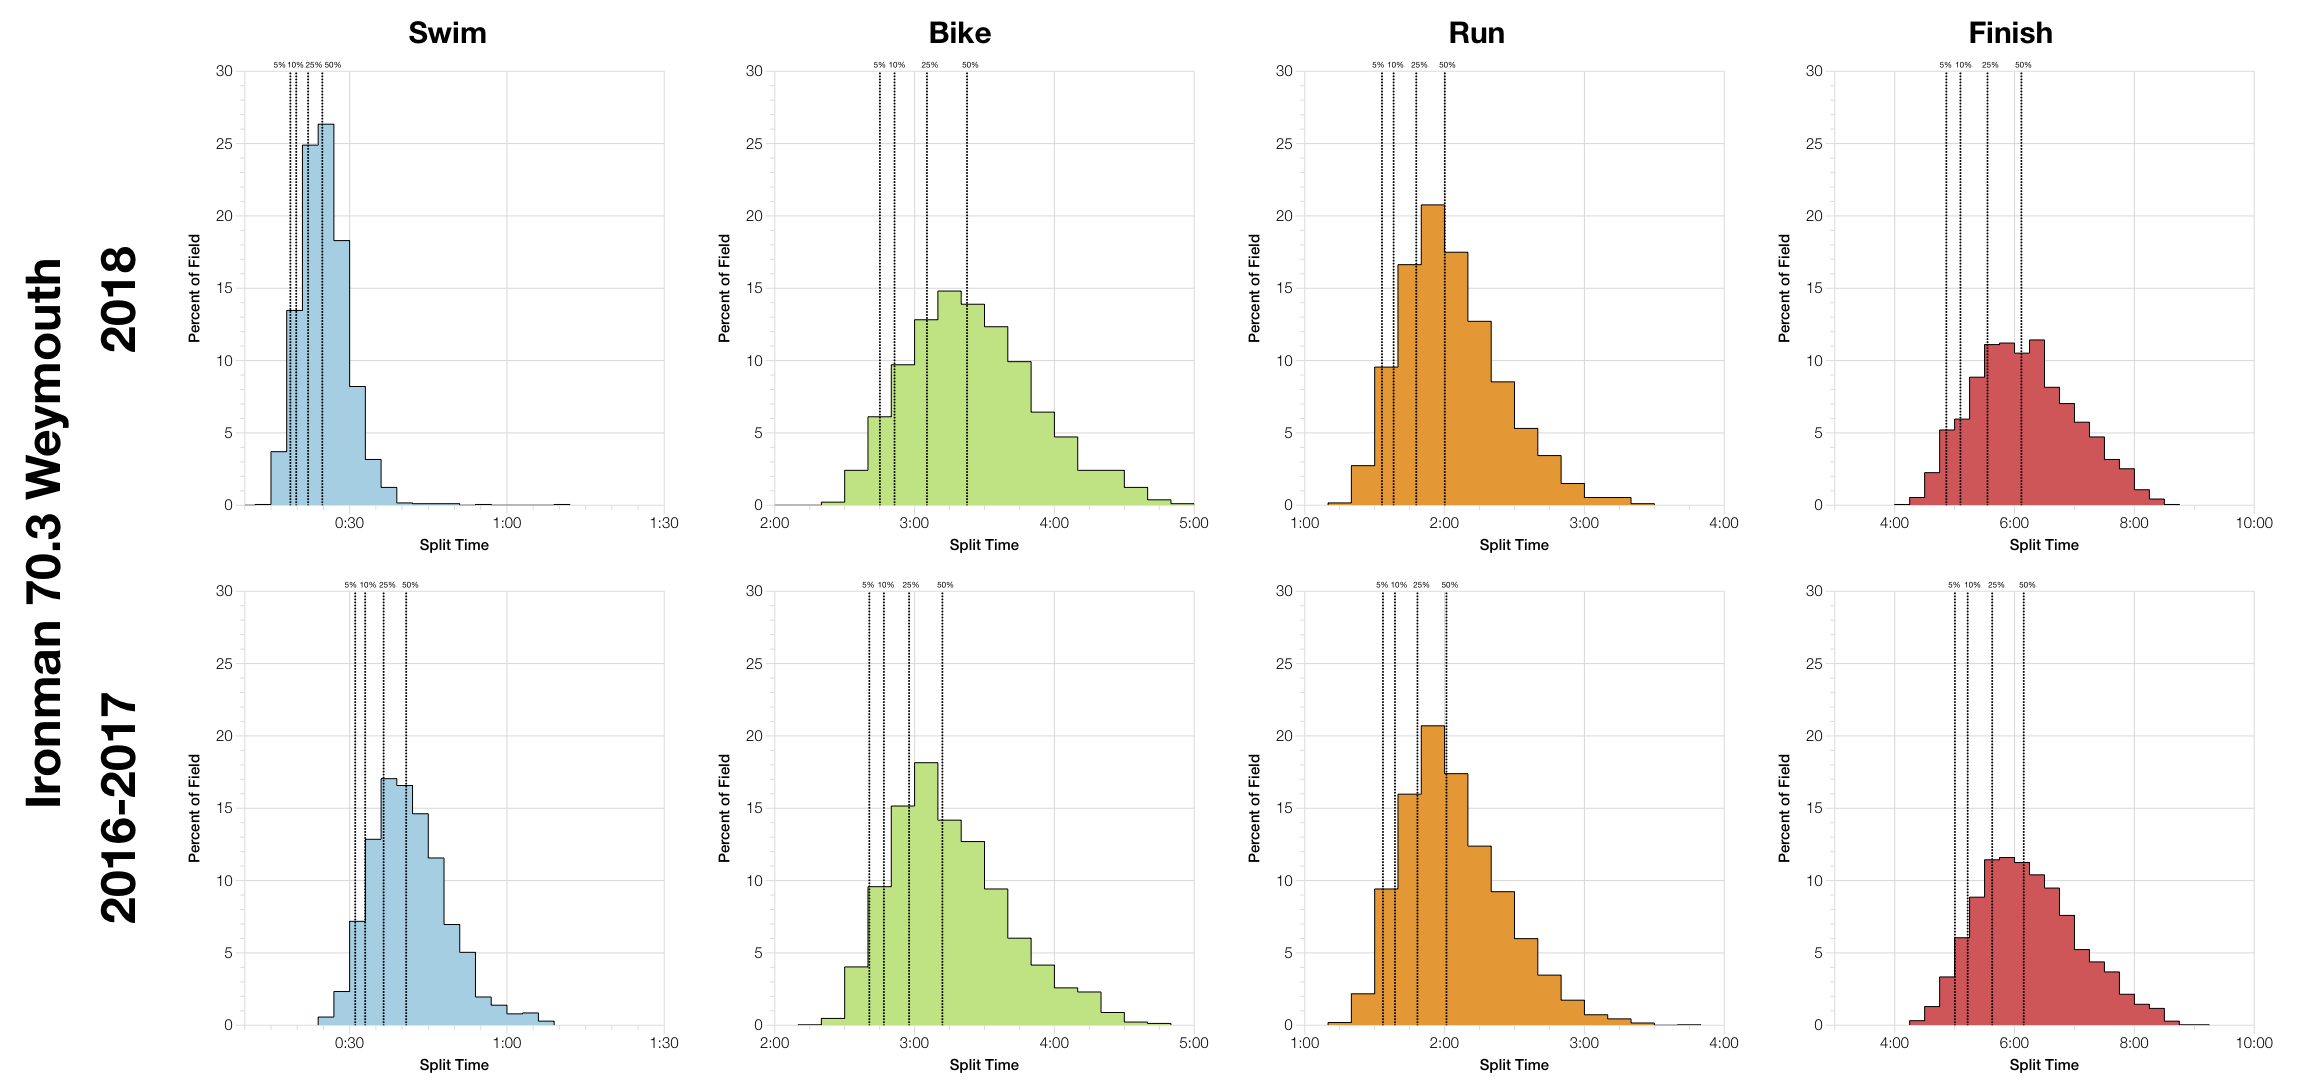
The distributions clearly show a shortened swim with much faster times as a consequence. This is followed by a slower bike in the rough conditions – about 10 minutes slower at the median. The race finished with a run that trends about the same as the previous two year. Overall this years race comes out much the same at the median and faster at the front. The shortened swim was enough to counter the slower bike and at the front of the race where conditions had less impact it meant times were often faster.
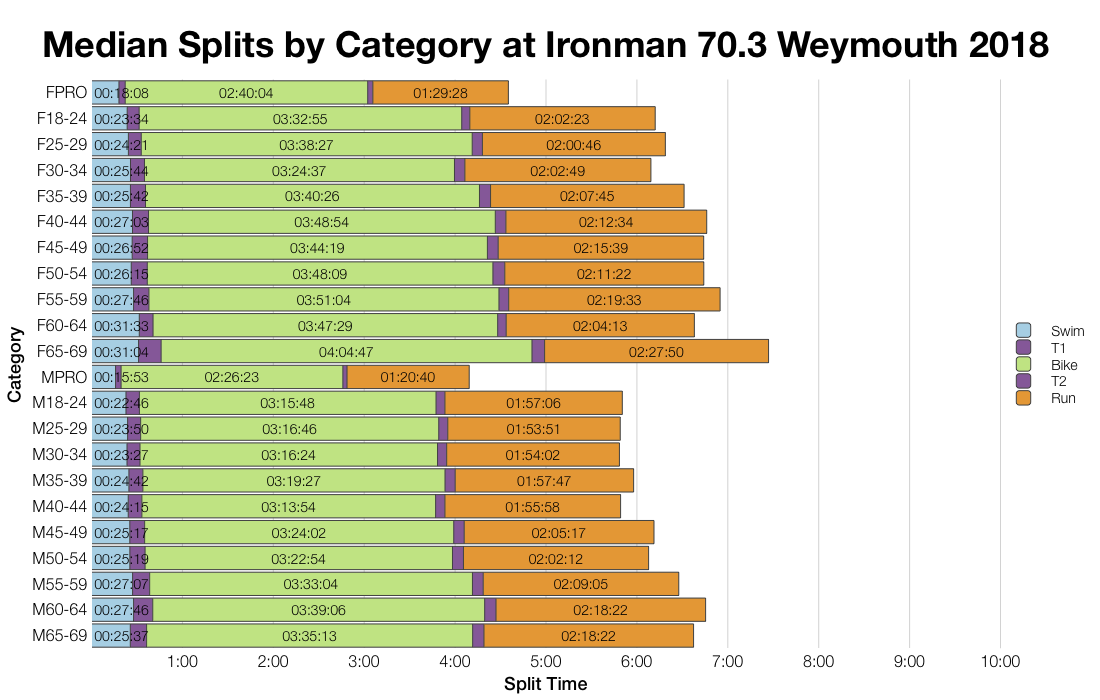
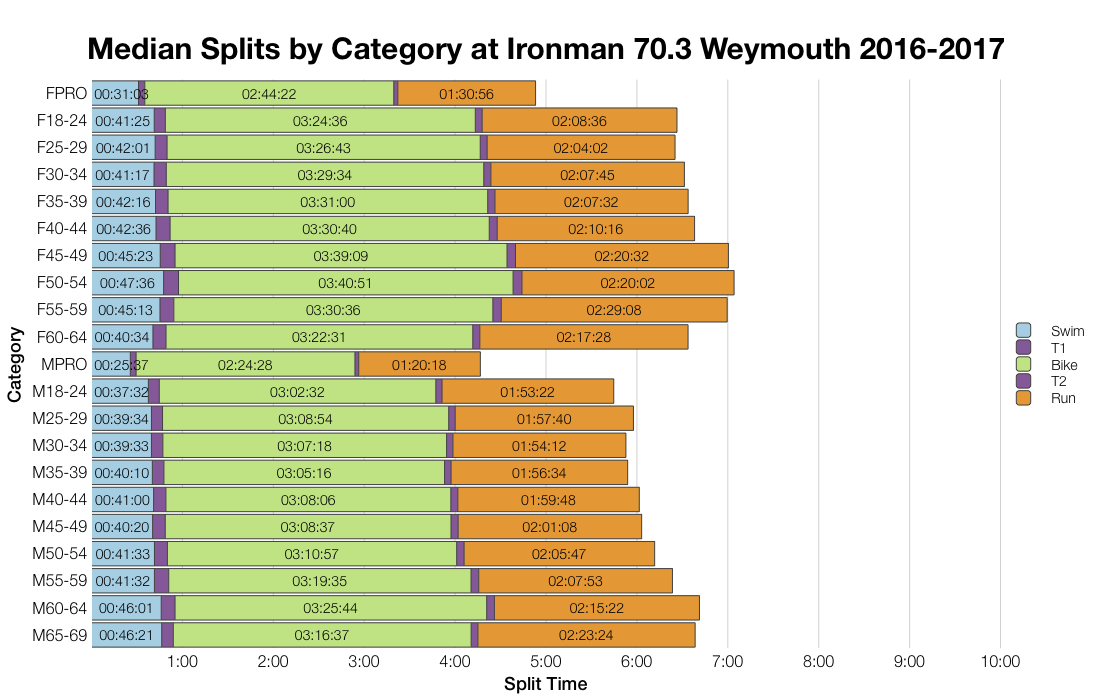
Medians show the same pattern – the swim is much faster and the bike slower – across the age groups.
The first year of stats incorporates DNS numbers, hence the really high percentage in the swims. Otherwise the key thing to note here is the doubling in DNFs on the bike this year. Conditions were rough and it saw a much higher drop out.
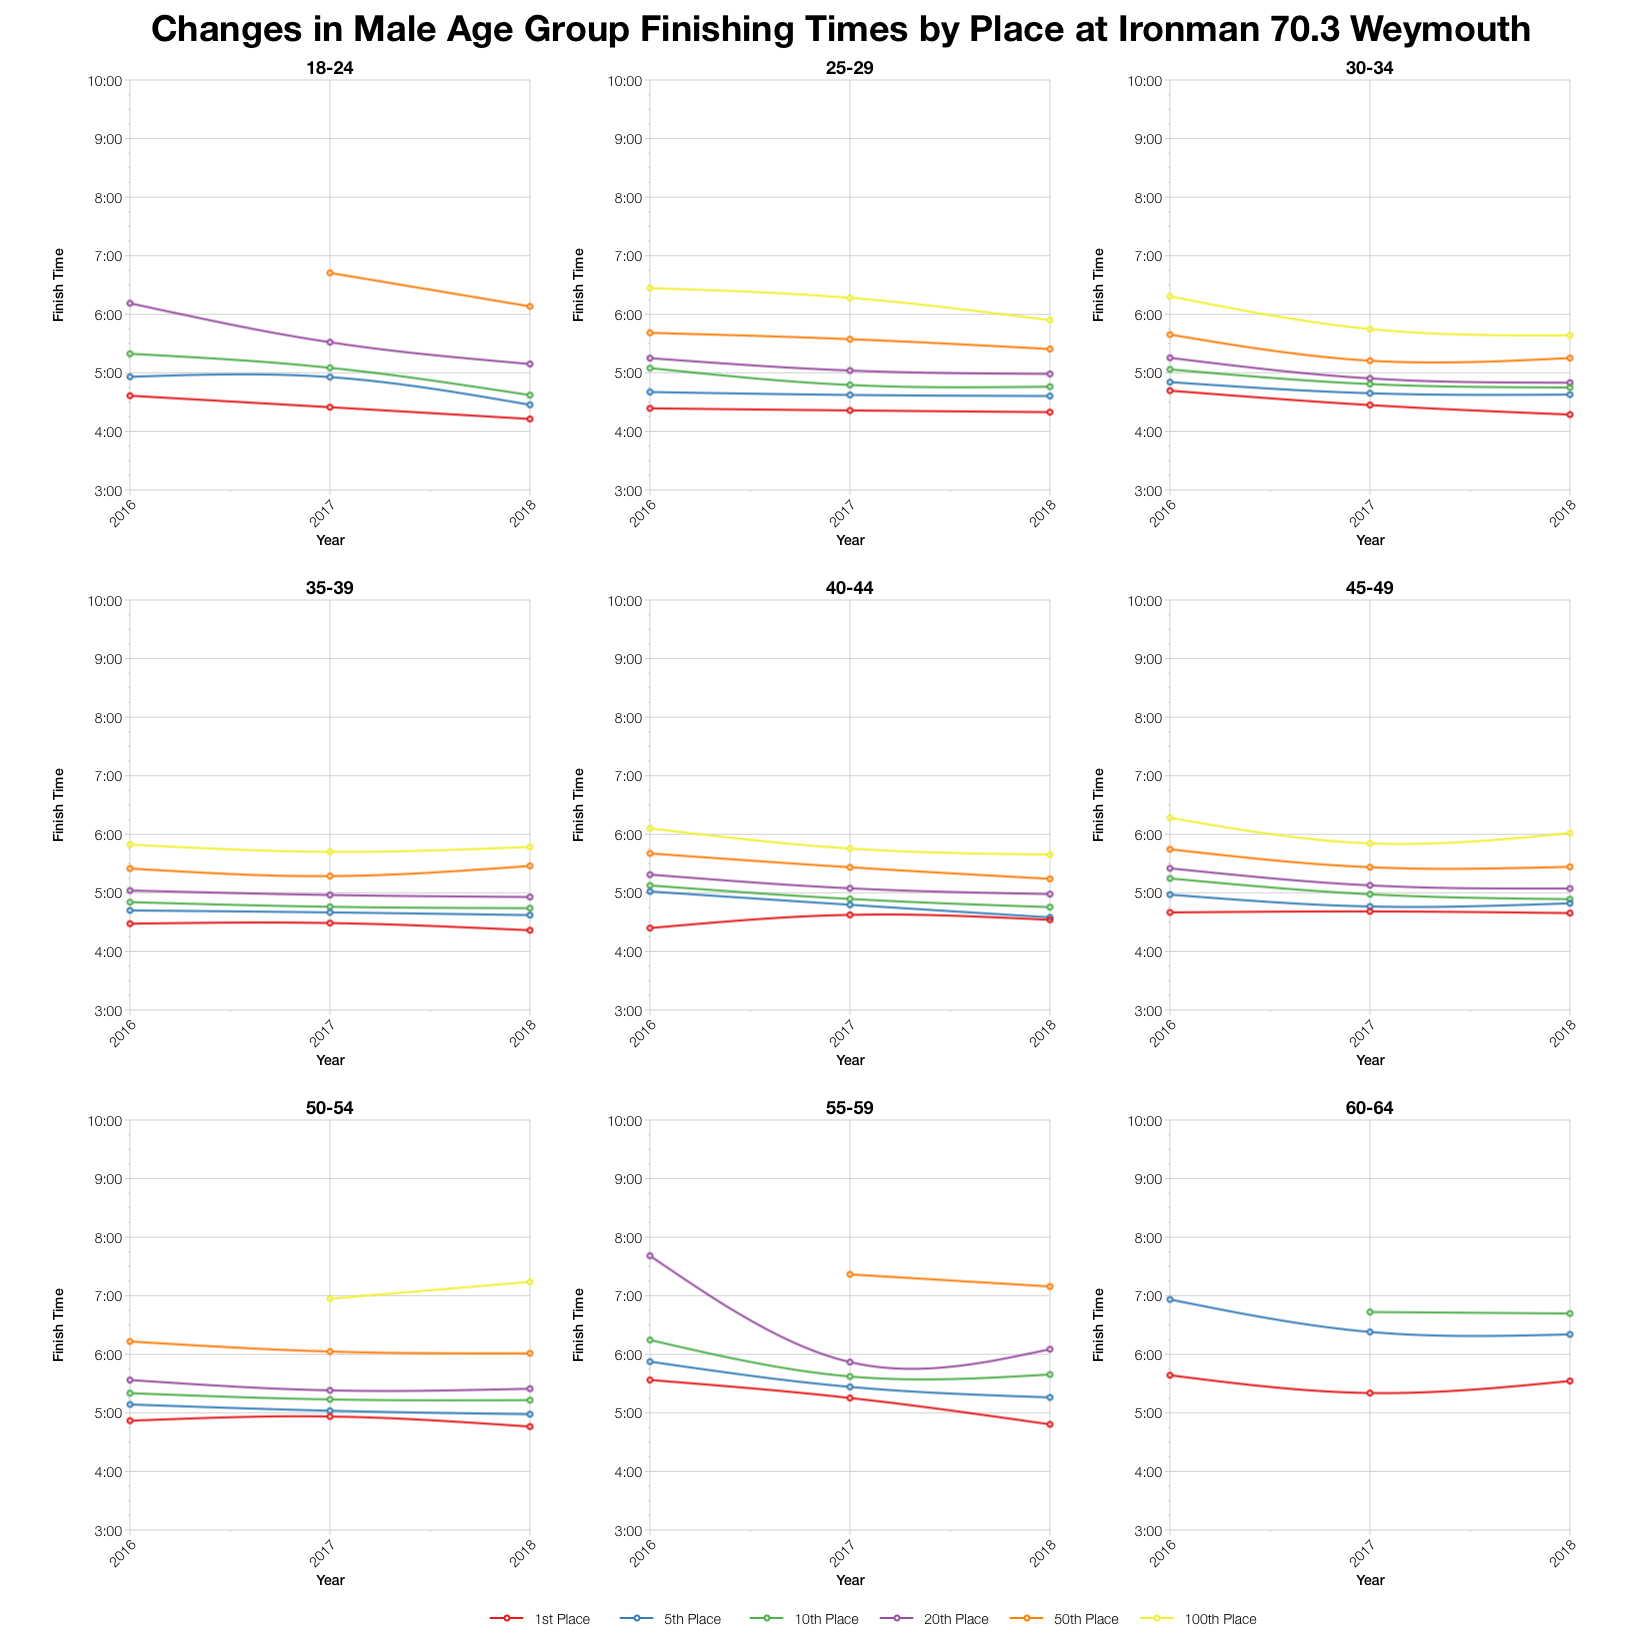
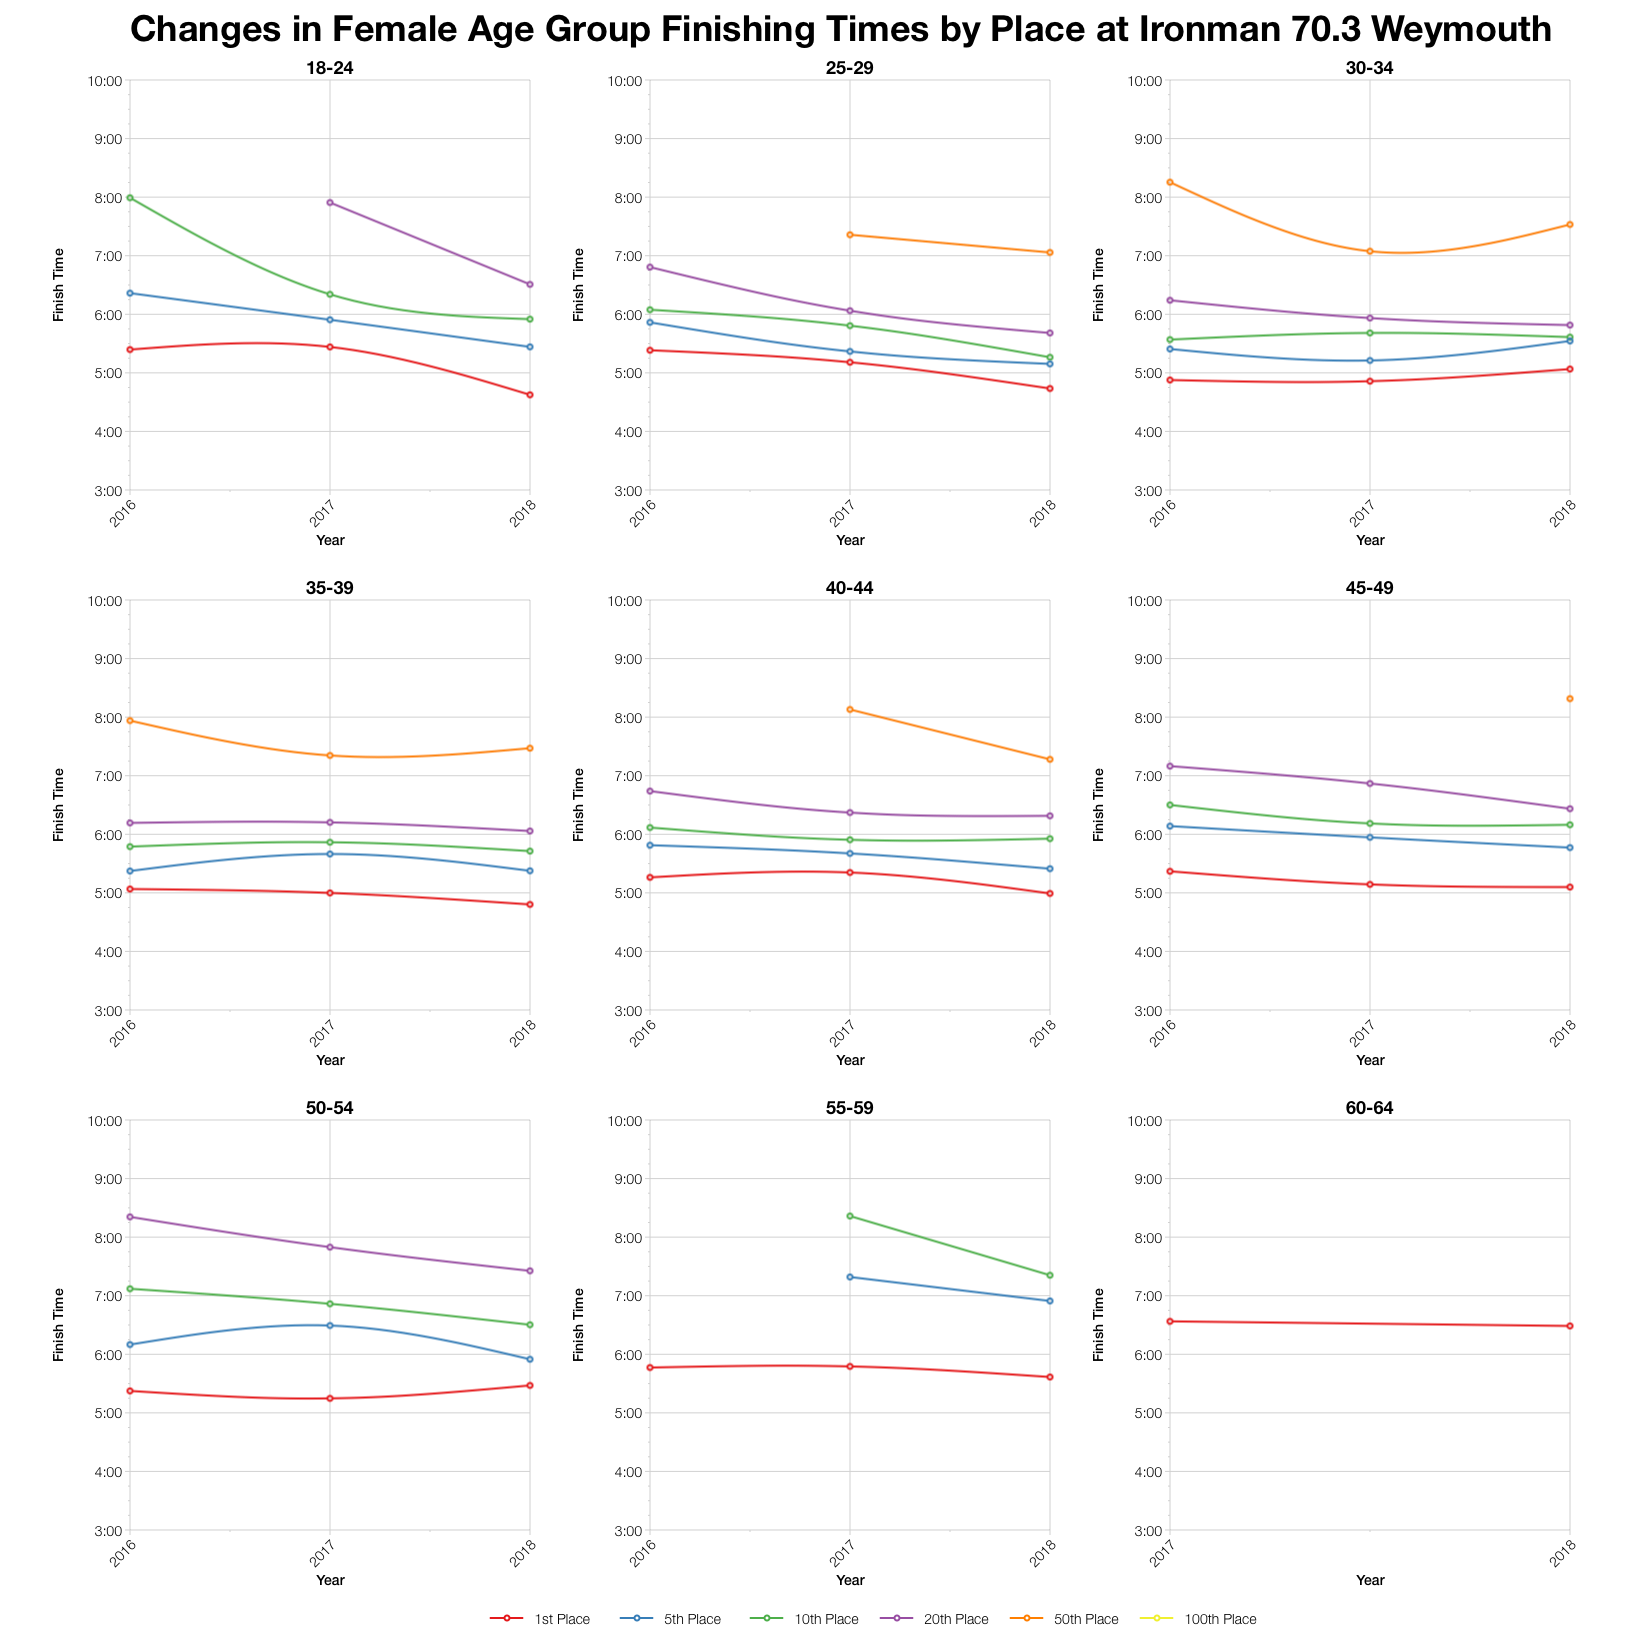
Checking times by position in age group and viewing the trends shows that the slowing in times is relatively small this year. It’s clear that the front of pack weren’t impacted by the weather and times naturally benefited from a shortened swim. Further back, things do start to slow, but not hugely for the places we’re looking at.
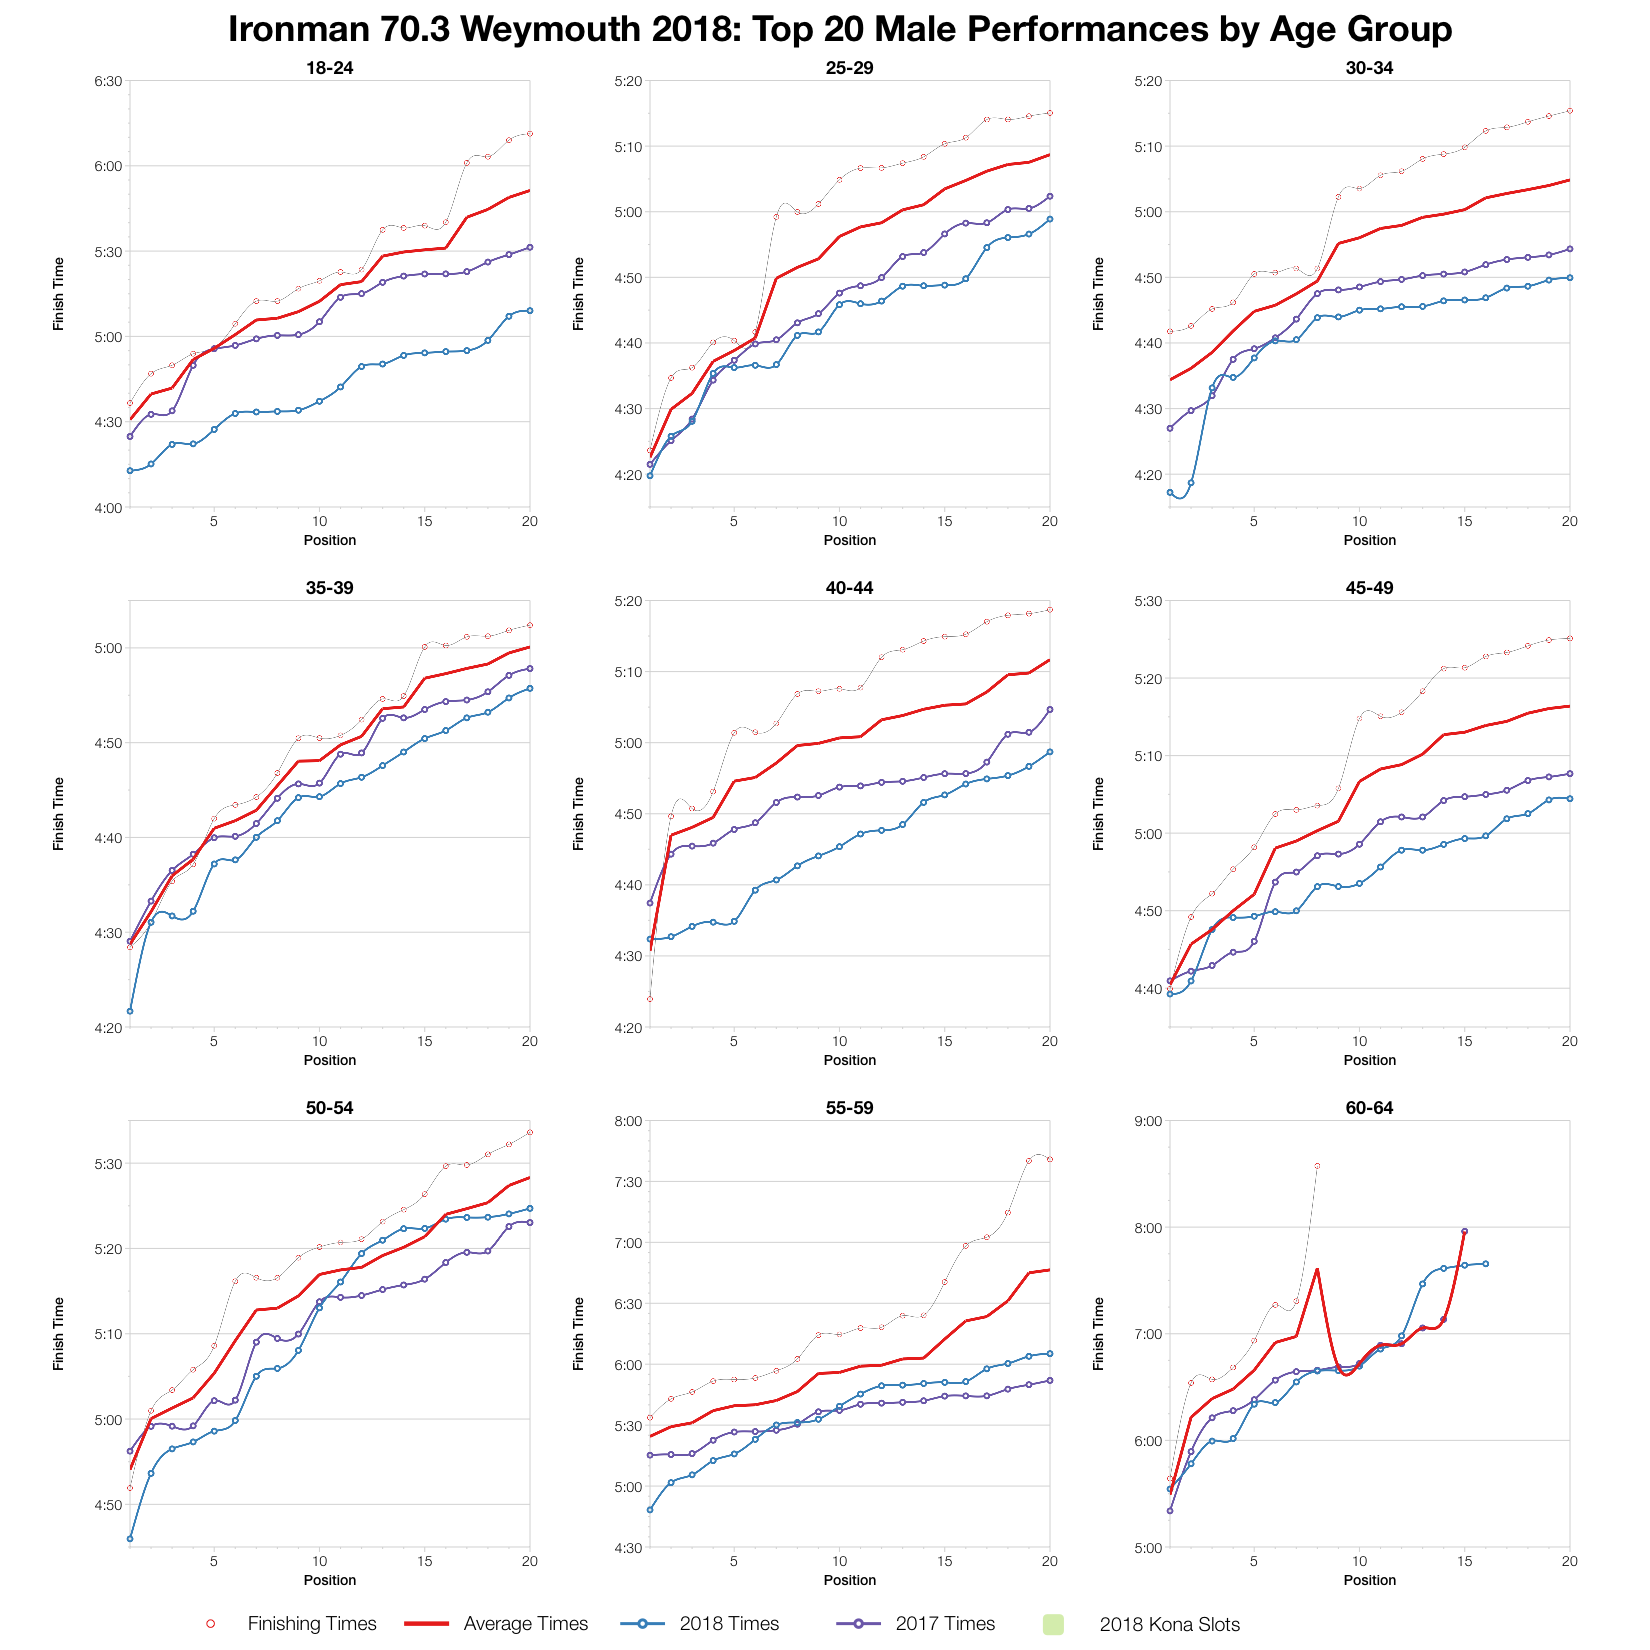
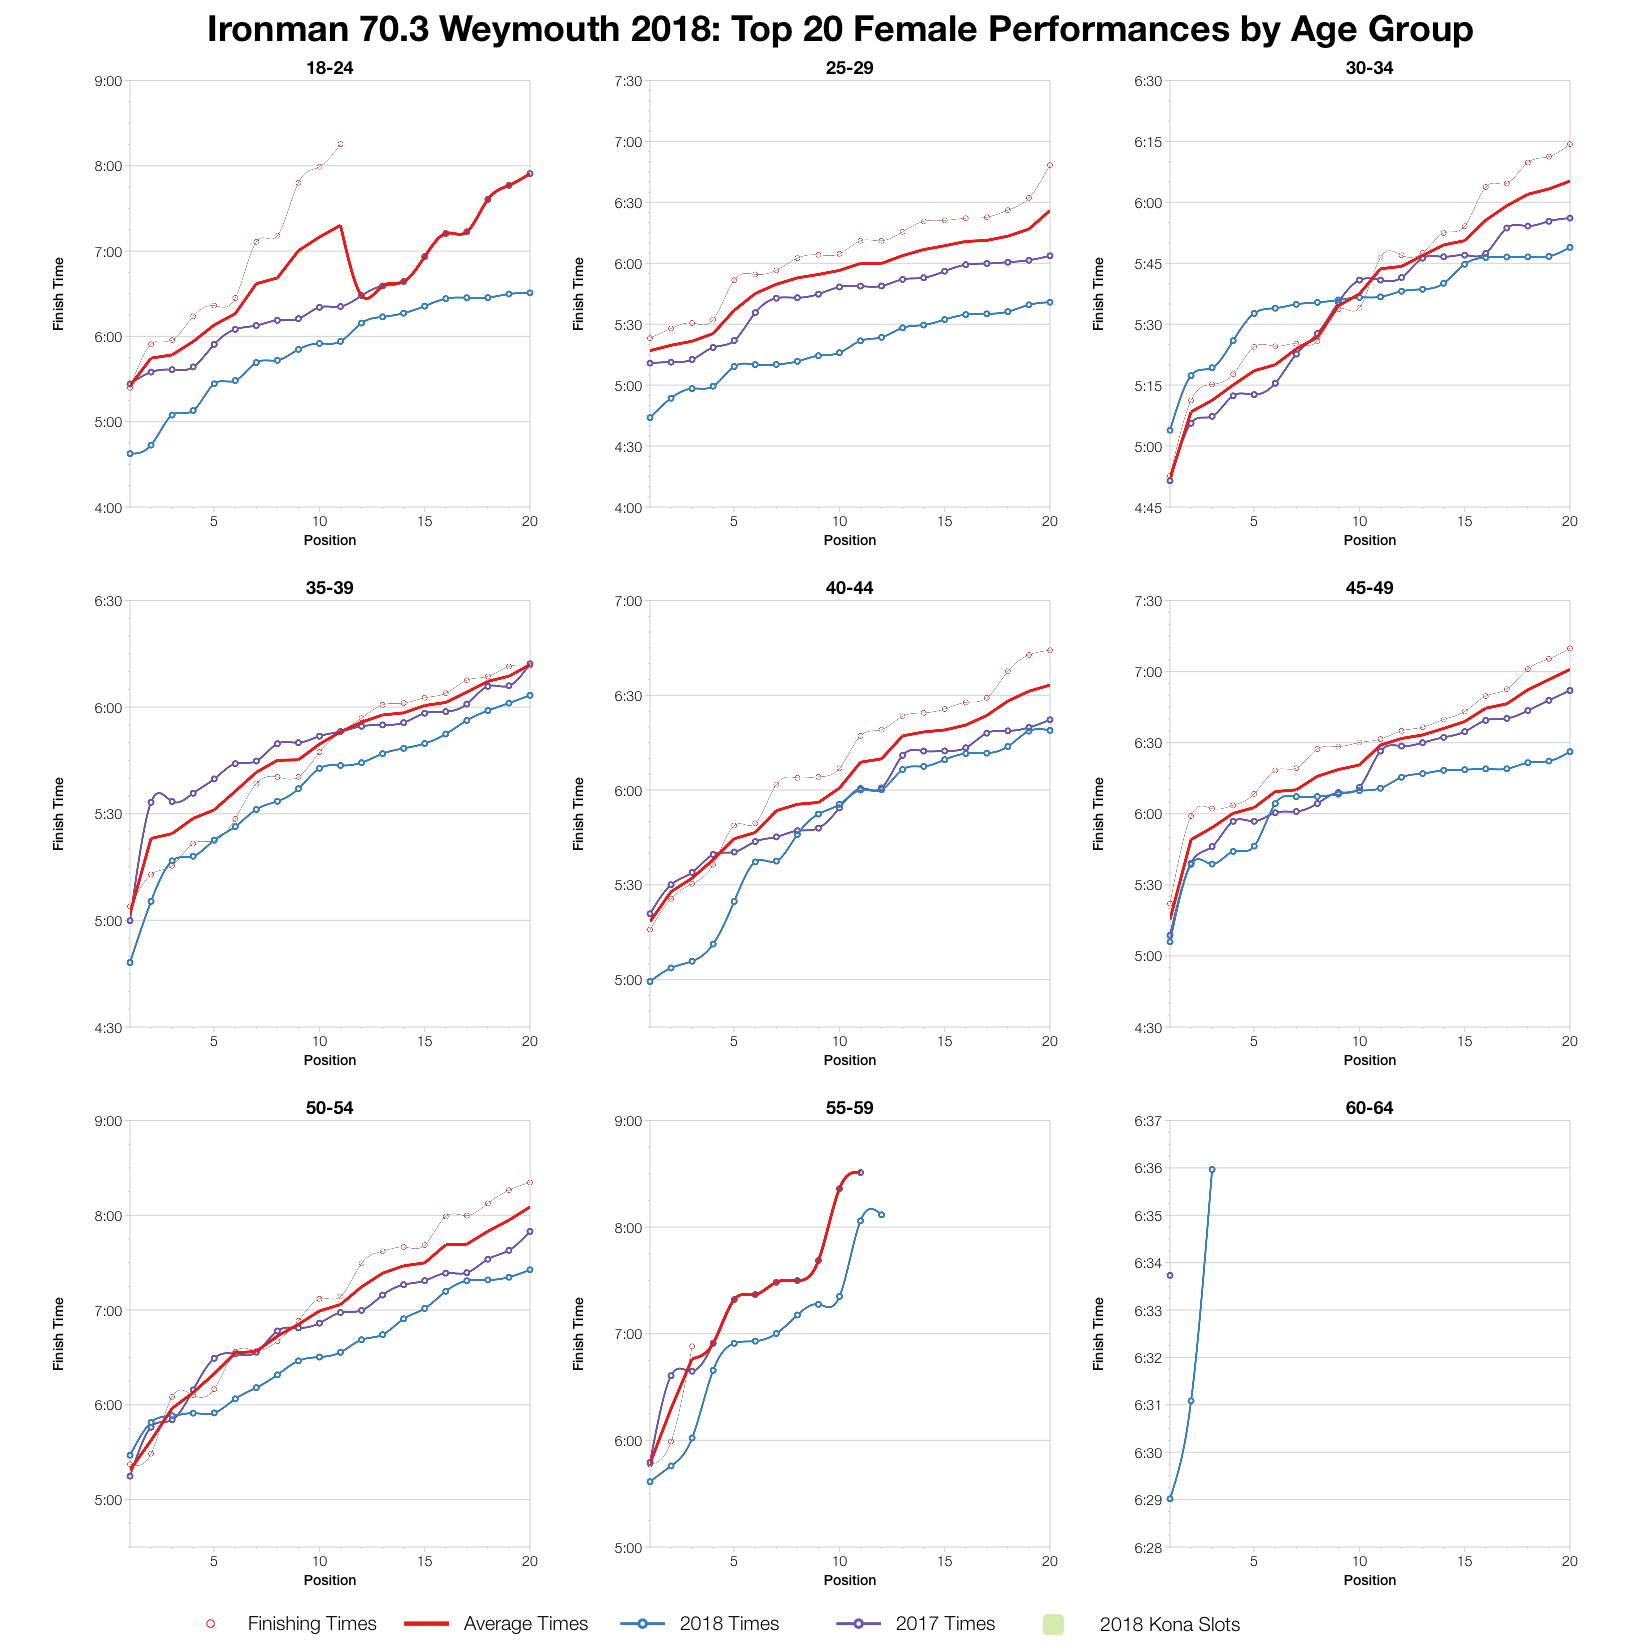
Top twenty age groups placings show this year’s race trends a little faster than last year for those up front. 2016 was slower than either of them pulling back the average times. So this years race would have been slower with a full length swim, but as it was came in faster at the front and average at the middle of the pack.
You can access a spreadsheet of the full results from Ironman 70.3 Weymouth 2018 on my Google Drive.

