Ironman Louisville 2018: Age Group Results and Kona Qualification

Latest statistics for Ironman Louisville

Somewhat overshadowed by the World Champs, the other Ironman race of the weekend was Ironman Louisville. It’s a large race with over 2,300 competitors and the standard 40 Kona slots for the 2019 Ironman World championship on offer. Conditions on race day resulted in a drastically shortened swim and were cold and wet enough to cause a higher than usual DNF rate.

Distribution of Finisher Splits at Ironman Louisville 2018 Compared with 2008-2017

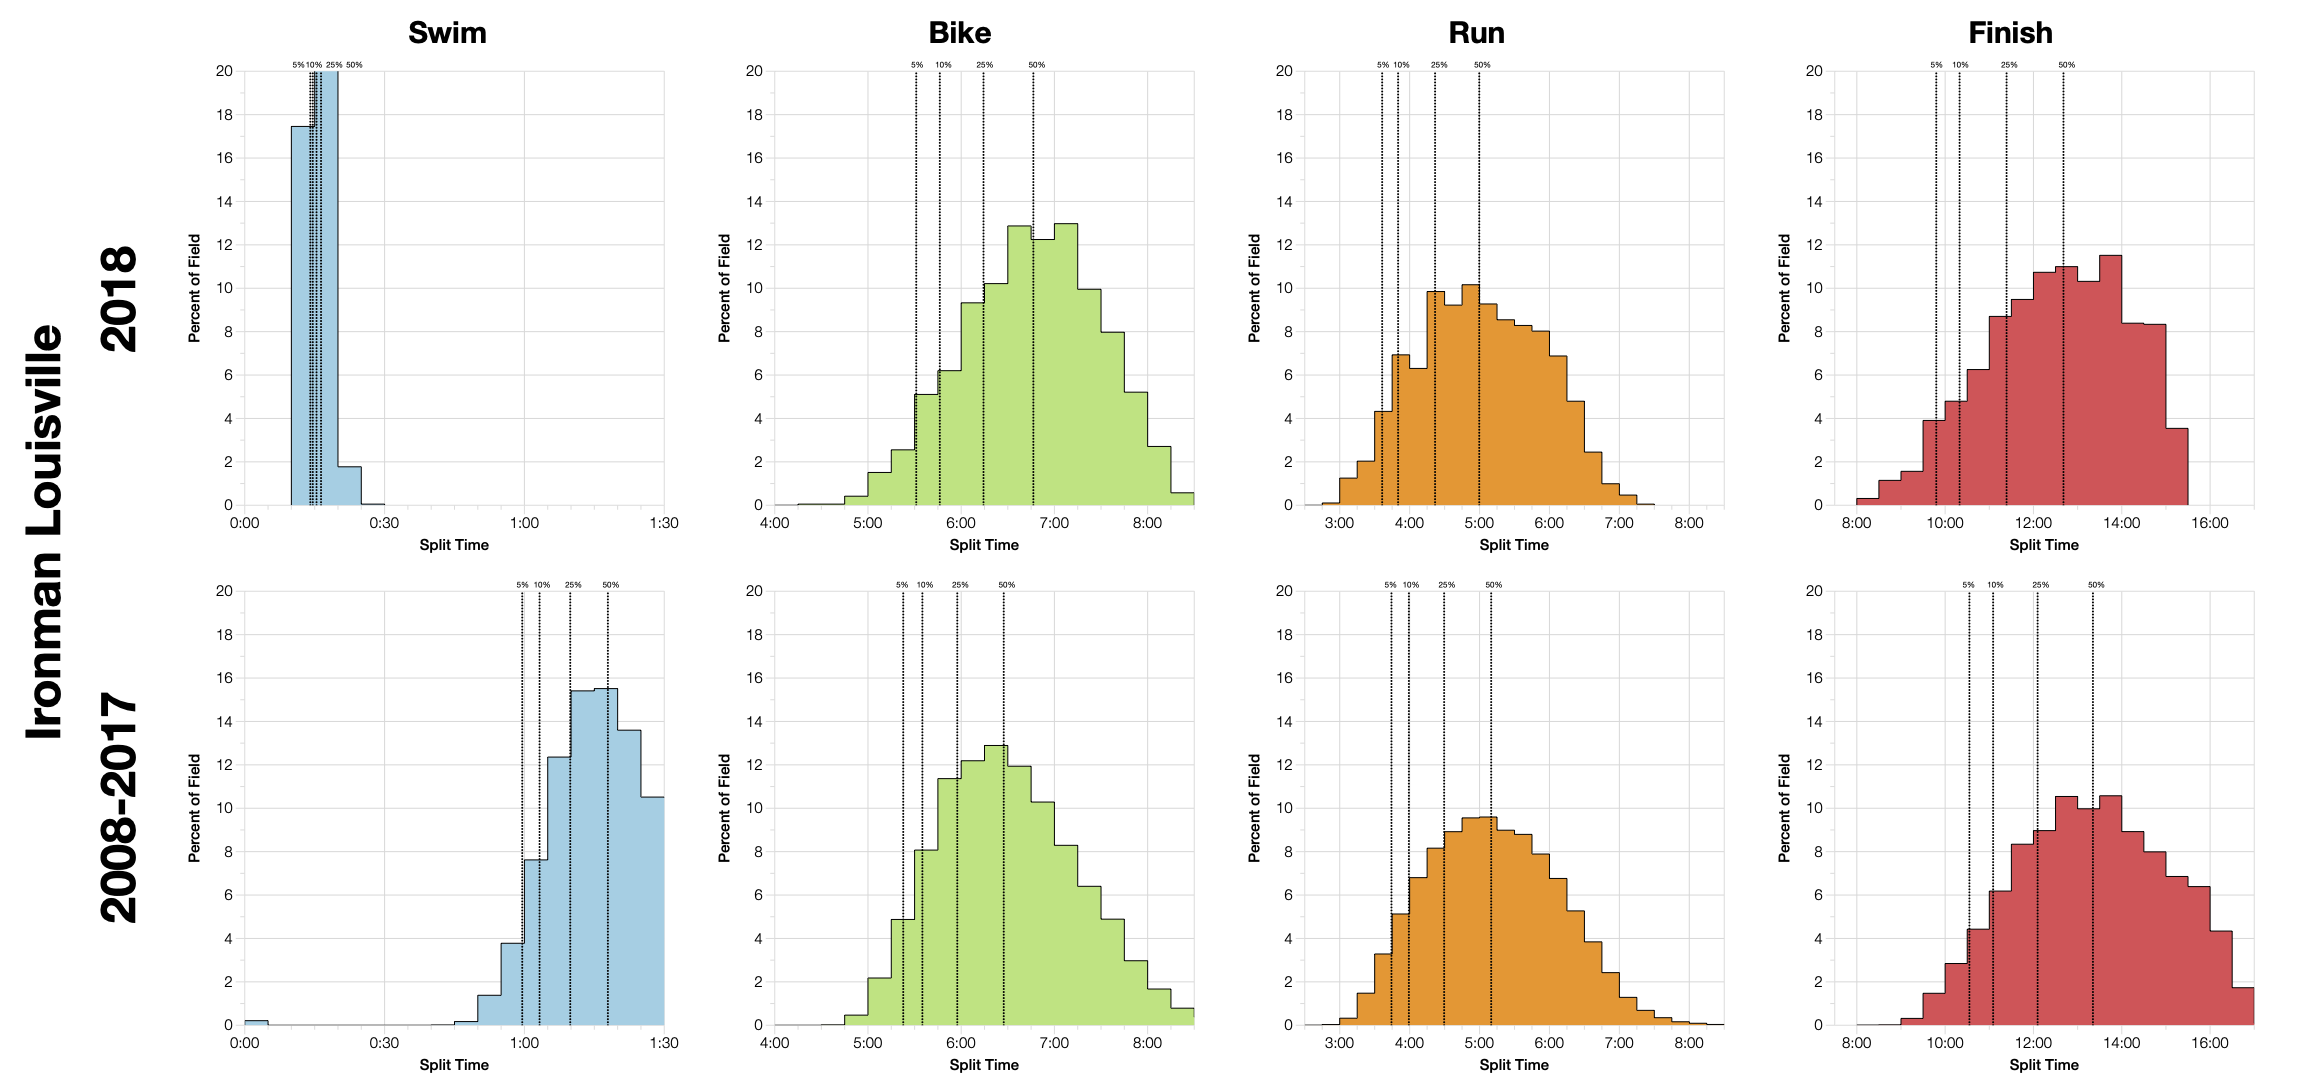
With such a shortened swim we can’t make any reasonable comparison with previous years for swim or overall times. We can make some comparison of bike and run though. Here we see much slower bike splits, presumably influenced by the cold, wet conditions. The run trends slightly faster – the conditions having less impact and the field thinned of many competitors by that stage. The huge chunk of time saved on the short swim means overall times will all come in much faster.

DNS and DNF Rates at Ironman Louisville
Year
Listed Athletes
Swim Finish
Swim DNS/DNF
Bike Finish
Bike DNF
Run Finish
Run DNF
Overall DNS/DNF
2011
2865
2434
15%
2371
2.6%
2276
4%
20.6%
2012
3014
2563
15%
2405
6.2%
2222
7.6%
26%
2013
2600
2540
2.3%
2482
2.3%
2343
5.6%
9.7%
2014
2387
2068
13.4%
1994
3.6%
1867
6.4%
21.7%
2015
2573
2527
1.8%
2464
2.5%
2365
4%
8.1%
2016
2652
2617
1.3%
2566
1.9%
2427
5.4%
8.4%
2017
2414
2396
0.7%
2316
3.3%
2253
2.7%
6.7%
2018
2366
2353
0.5%
2093
11%
1940
7.3%
17.9%

The cold and wet conditions pushed the DNF rates up at this year’s race. I should first note that prior to 2015 the Ironman results sets often made it hard to distinguish a DNS from a swim DNF so those numbers may be artificially high by incorporating DNS too. If you compare with the last 3 years though the DNF rate is more than double the usual level with a large 11% dropping out on the bike. This isn’t the most extreme DNF rate seen at Ironman, but we don’t normally see numbers like this without unusual circumstances.

Median Splits by Age Group at Ironman Louisville 2018
Median Splits by Age Group at Ironman Louisville 2008-2017

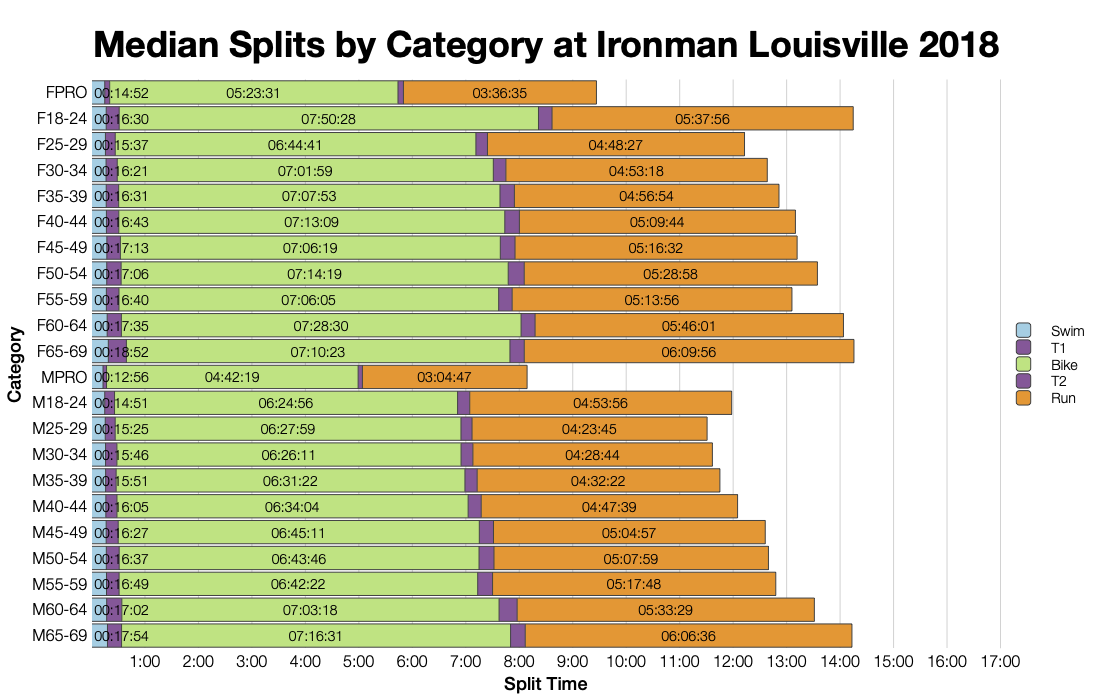
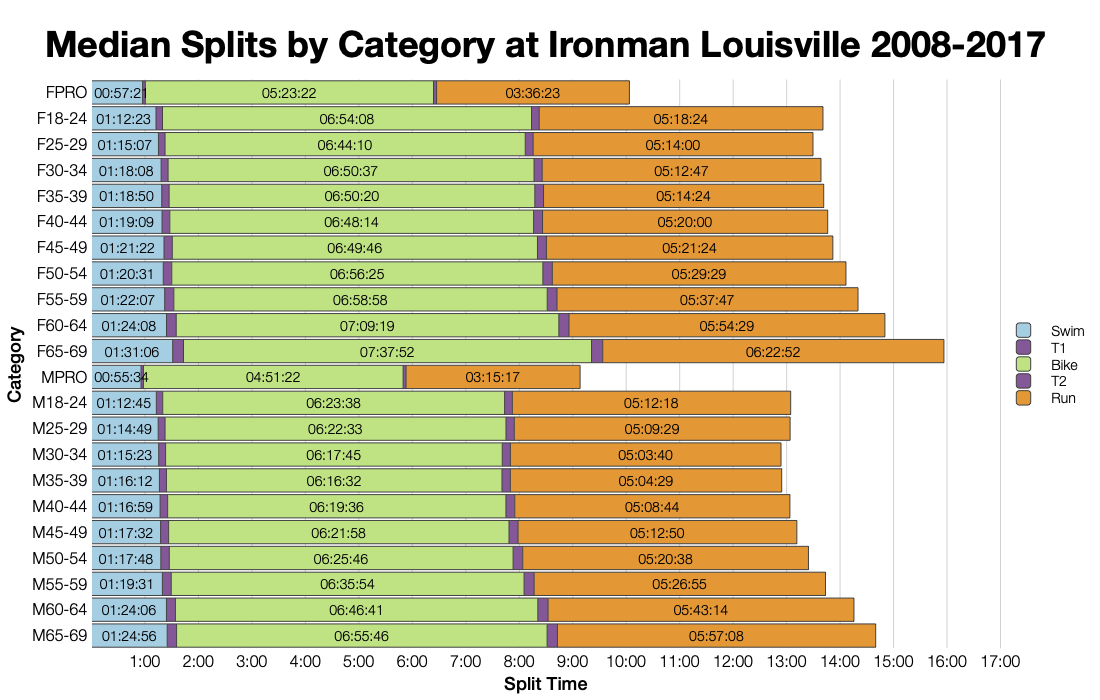
We can again make a cursory comparison of bike and run and see that they tend to follow the trends shown in the distributions. Slower bike medians and generally faster run medians.

Top 10 Nationalities at Ironman Louisville
Country
Count
Percentage
United States
2490
89.3
Canada
98
3.5
United Kingdom
22
0.8
Mexico
18
0.6
Panama
11
0.4
Japan
9
0.3
Germany
9
0.3
Brazil
8
0.3
Ireland
8
0.3
Australia
8
0.3
Ironman Louisville 2018 Predicted Kona Qualifiers by Country
Country
Percentage of Slots
Percentage of Field
United States
67.5
89.3
Canada
12.5
3.5
Finland
5.0
0.1
United Kingdom
5.0
0.8
Poland
2.5
0.1
Venezuela
2.5
0.1
Norway
2.5
0.1
Isle of Man
2.5
0.0

This is predominantly a North American race with a scattering of other nationalities in the mix. Overall the slots stay in the US, but a good proportion go elsewhere.

Changes in Male Finishing Times by Position at Ironman Louisville
Changes in Female Finishing Times by Position at Ironman Louisville

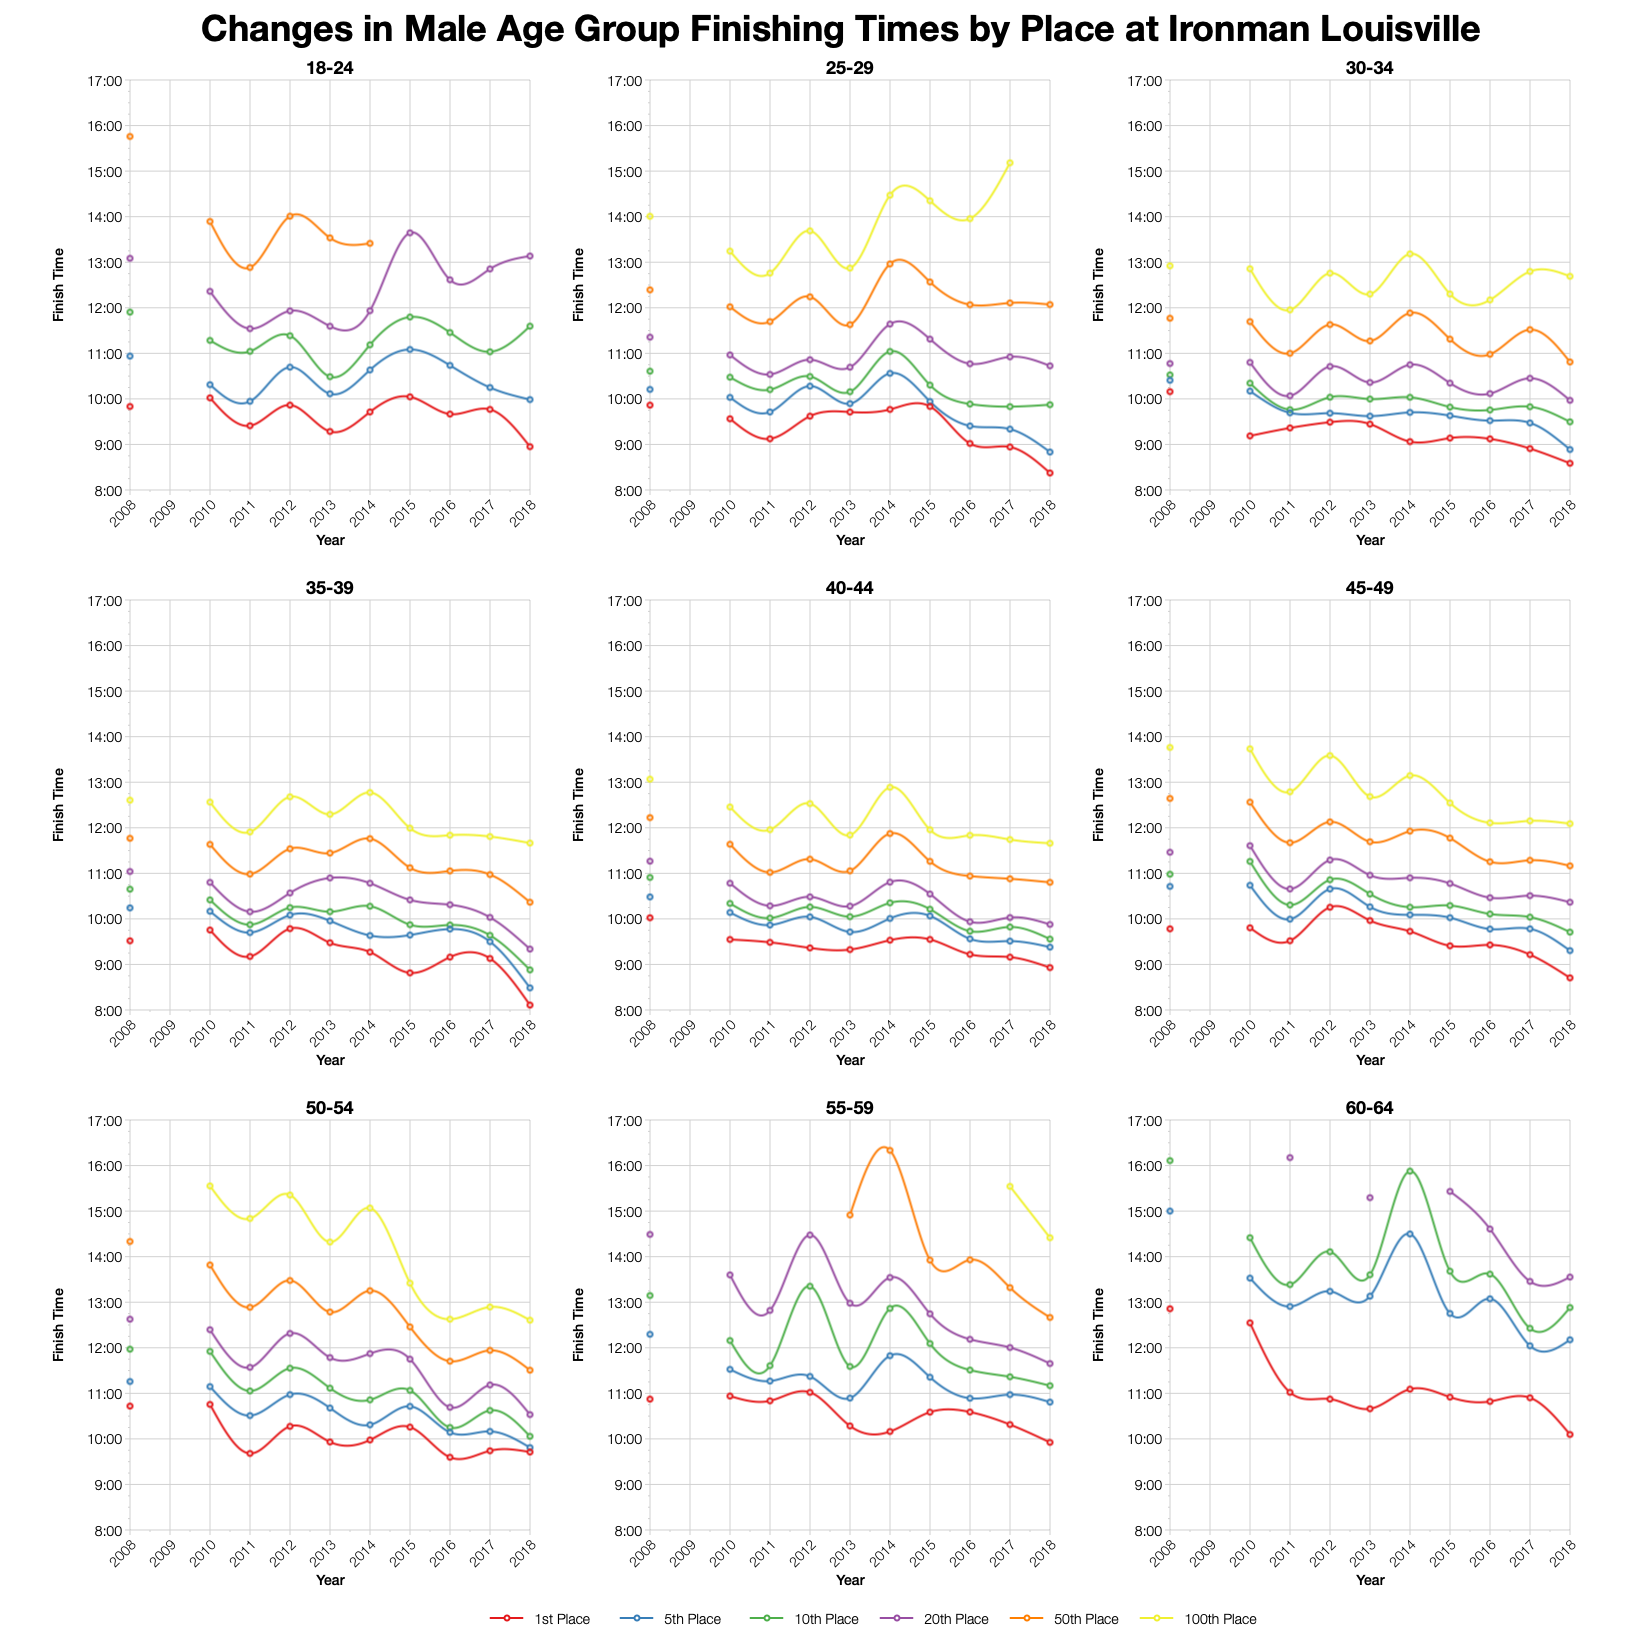
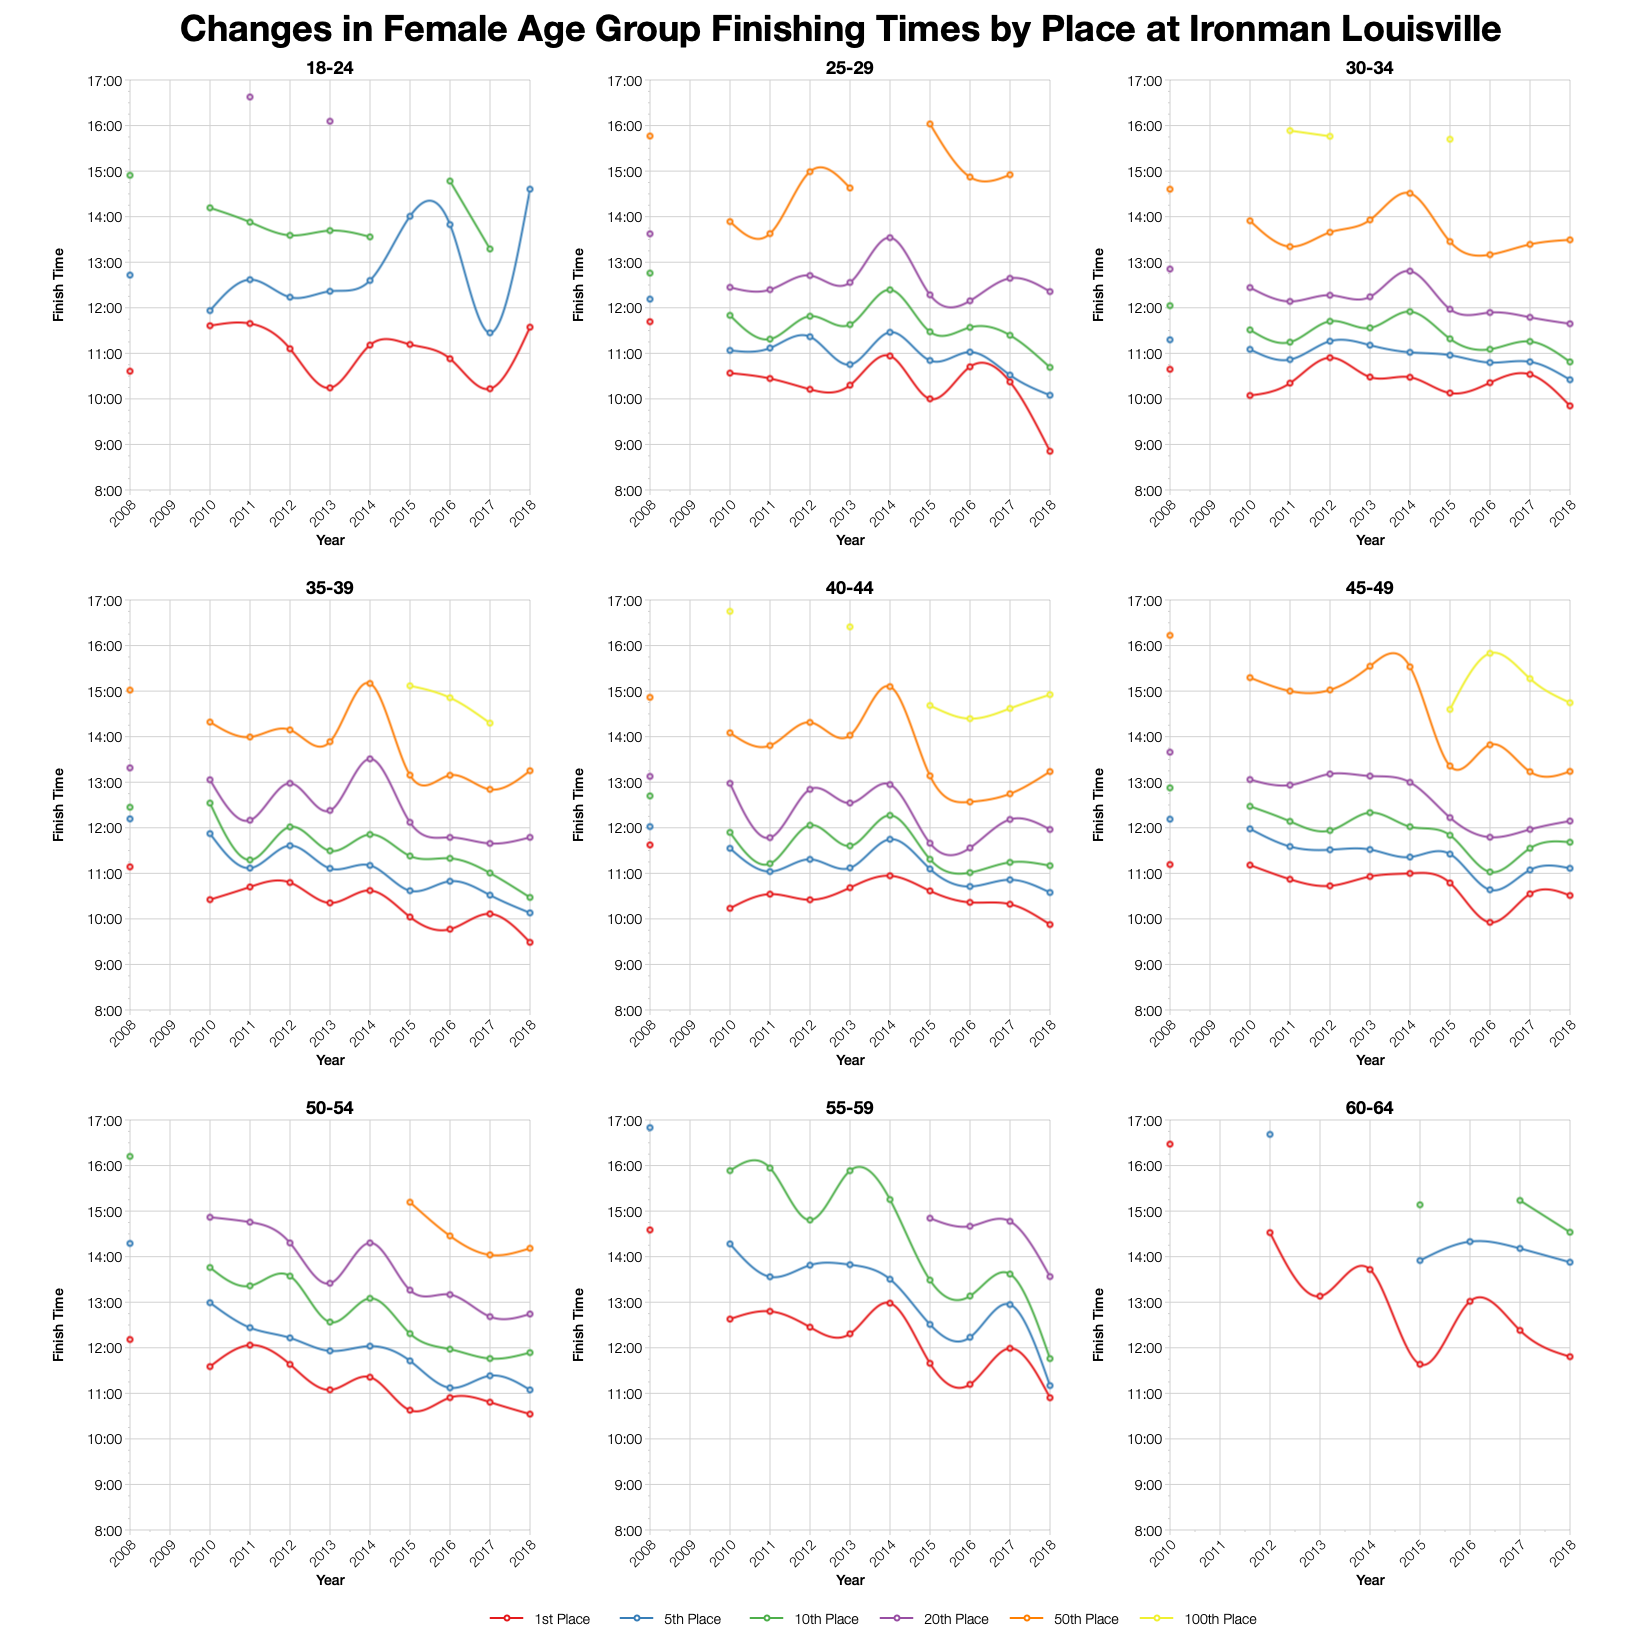
The charts of age group times by position for Louisville are some of the most variable I’ve seen. this race has seen a lot of fluctuation in performances over the years. Again, this year will stick out thanks to the shortened swim.

Ironman Louisville 2018 Predicted Kona Qualification Times
Age Group
Slots
Winner
Average Kona Qualifier
Final Qualifier
M18-24
1
08:57:03
08:57:03
08:57:03
M25-29
1
08:22:24
08:22:24
08:22:24
M30-34
3
08:35:10
08:44:21
08:50:28
M35-39
4
08:06:28
08:20:04
08:28:10
M40-44
4
08:55:49
09:06:20
09:20:38
M45-49
5
08:42:19
09:01:29
09:18:12
M50-54
4
09:42:42
09:44:26
09:47:01
M55-59
2
09:55:23
09:59:36
10:03:50
M60-64
1
10:05:46
10:05:46
10:05:46
M65-69
1
12:53:21
12:53:21
12:53:21
M70-74
1
13:01:19
13:01:19
13:01:19
F18-24
1
11:34:26
11:34:26
11:34:26
F25-29
1
08:51:01
08:51:01
08:51:01
F30-34
1
09:50:47
09:50:47
09:50:47
F35-39
1
09:29:05
09:29:05
09:29:05
F40-44
2
09:52:32
10:06:00
10:19:28
F45-49
3
10:30:47
10:34:27
10:41:21
F50-54
1
10:32:38
10:32:38
10:32:38
F55-59
1
10:54:11
10:54:11
10:54:11
F60-64
1
11:48:15
11:48:15
11:48:15
F65-69
1
14:15:33
14:15:33
14:15:33

Based on the start numbers I’ve estimated the Kona slot allocation (as mentioned in previous analysis the final numbers may vary as my current method is not an exact match) and from that the qualification times before taking roll downs into account. You can compare this with other races on my Kona qualification page.

Top Twenty Male Performances and Kona Qualification by Age Group at Ironman Louisville 2018
Top Twenty Female Performances and Kona Qualification by Age Group at Ironman Louisville 2018

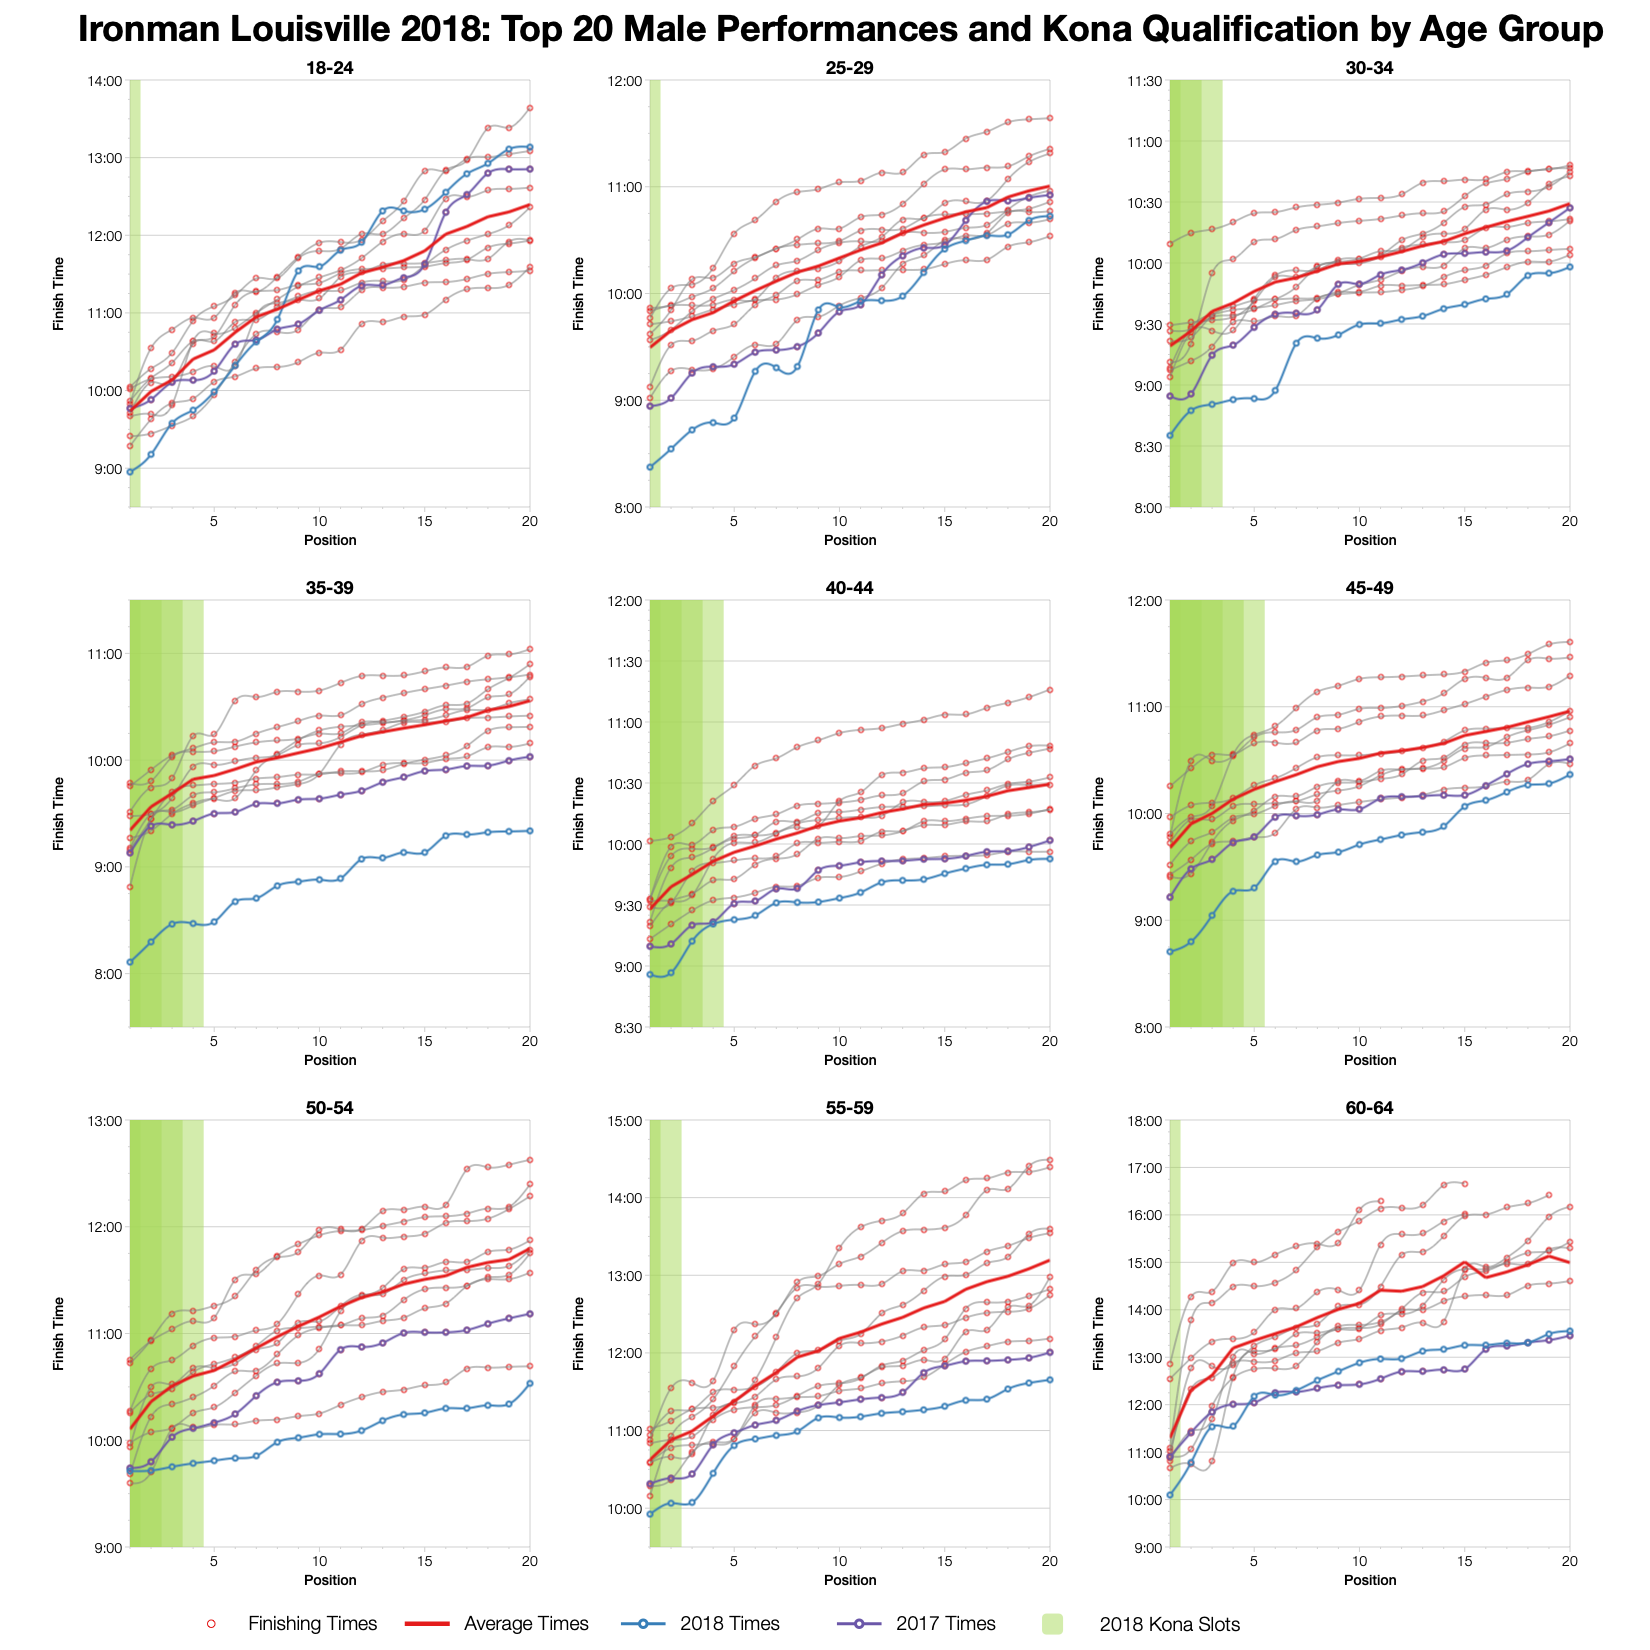
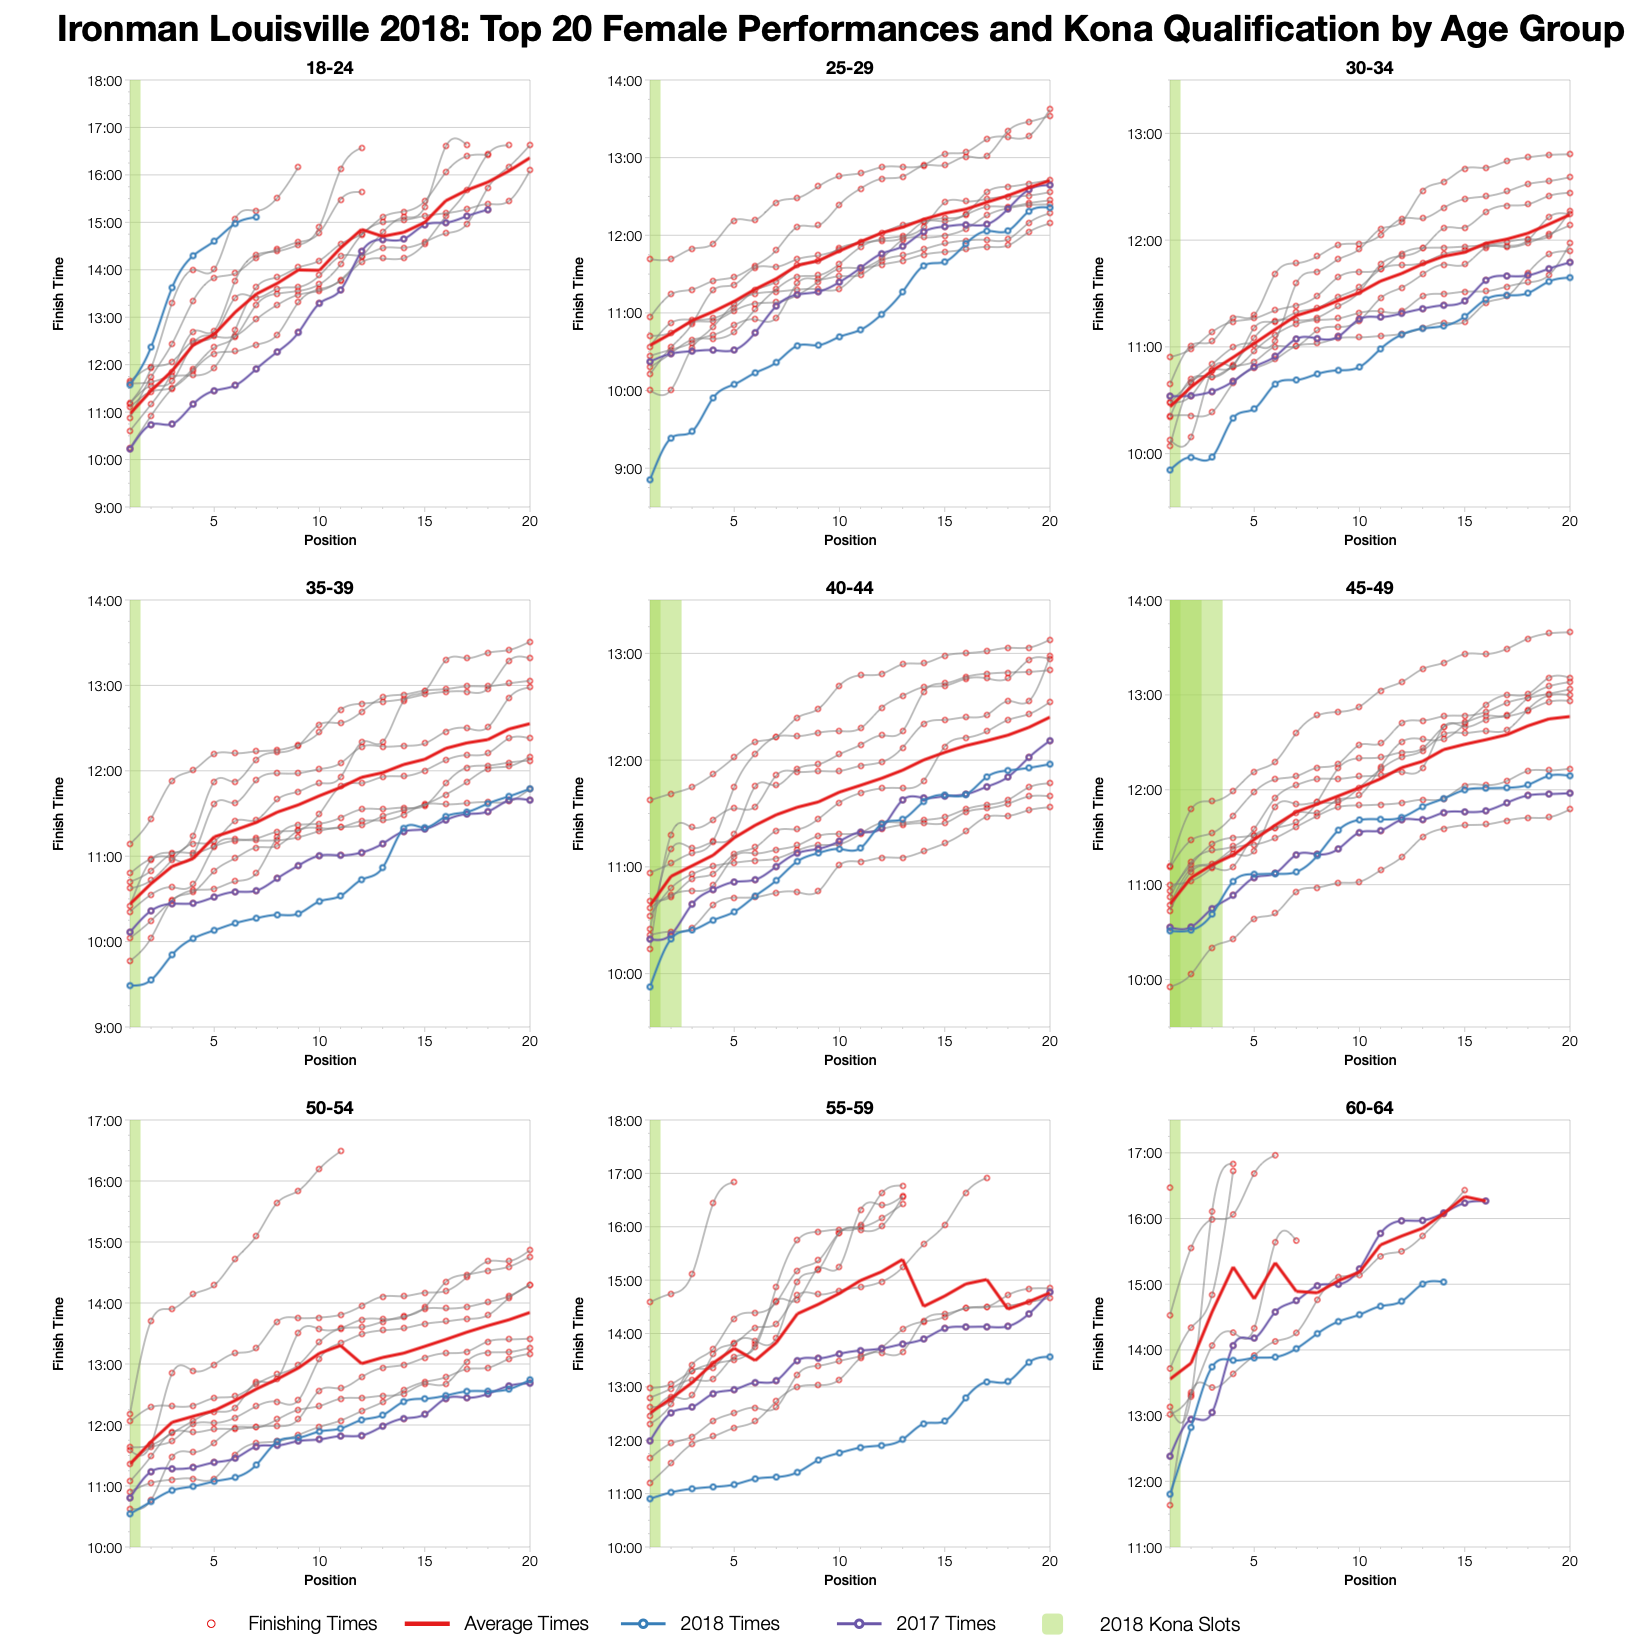
Finally the age group top tenets times which are naturally much faster than the averages for almost every age group. This can all be explained by the shortened swim. The youngest age groups don’t appear to have faired as well in the cold with F18-24 being slower than average and M18-24 closer than most.

You can access a spreadsheet of the full results from Ironman Louisville 2018 on my Google Drive.

Latest statistics for Ironman Louisville

Kona Qualification

Compare qualification times across the Ironman Calendar.

Kona Consultancy

Individual race analysis and guidance for Kona qualification.

Support the Stats

Support the continued development of these stats.

Comments