Ironman Florida 2018: Age Group Results and Kona Qualification

Latest statistics for Ironman Florida

In the aftermath of Hurricane Michael the only way Ironman Florida could proceed was by a change of date and venue. Although the race remained on the same weekend in Florida athlete numbers were significantly affected. The DNS rate for Florida was just short of 40%. For the 1800 athletes who made it to the start line, the standard 40 Kona slots were on offer.

An entirely new course and such reduced competitor numbers obviously gives a very different pattern of results. This year’s race trends much slower than usual.

Distribution of Finisher Splits at Ironman Florida 2018 Compared with 2008-2017

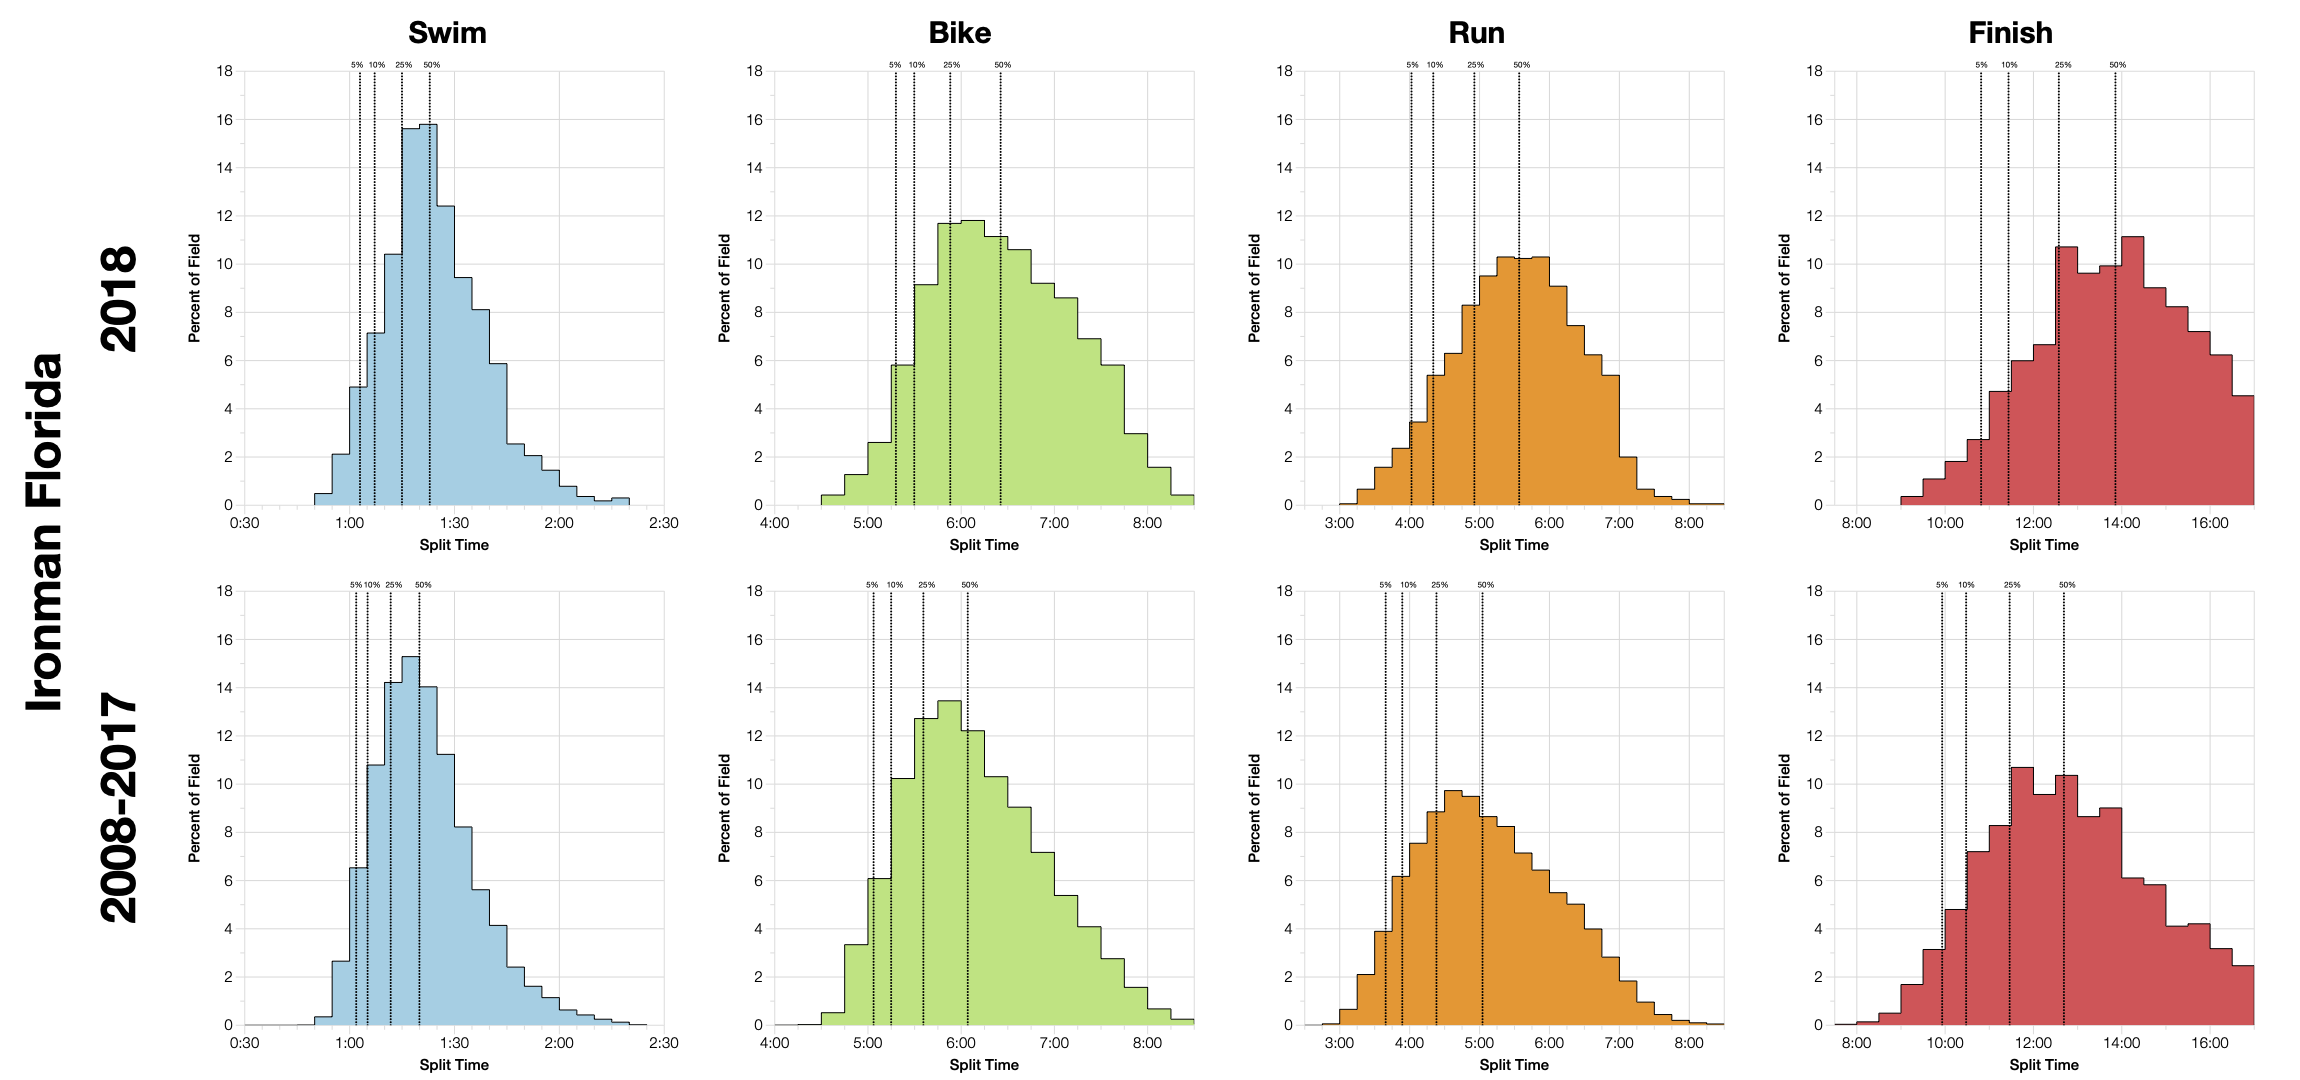
From swim to run this year’s race trends slower than the regular course. It’s roughly 30 minutes slower at the median for both bike and run, and over an hour slower at the median for the overall times. This difference remains true through to the front of the field suggesting course and conditions were generally slower.

DNS and DNF Rates at Ironman Florida
Year
Listed Athletes
Swim Finish
Swim DNS/DNF
Bike Finish
Bike DNF
Run Finish
Run DNF
Overall DNS/DNF
2008
2606
2177
16.5%
2177
2184
16.2%
2009
2880
2292
20.4%
2292
2312
19.7%
2010
2854
2289
19.8%
2289
2299
19.4%
2011
2921
2437
16.6%
2393
1.8%
2353
1.7%
19.4%
2012
3061
2553
16.6%
2505
1.9%
2424
3.2%
20.7%
2013
2885
2807
2.7%
2755
1.9%
2697
2.1%
6.4%
2014
2680
100%
2366
11.7%
2015
2980
2399
19.5%
2311
3.7%
2193
5.1%
26.4%
2016
2245
2148
4.3%
2107
1.9%
2004
4.9%
10.7%
2017
2375
2356
0.8%
2281
3.2%
2182
4.3%
8.1%
2018
1877
1832
2.4%
1769
3.4%
1652
6.6%
12%

As you’d expect, there’s a large drop in athlete numbers with the last minute relocation. DNF numbers are at the high end for Florida too, particularly on the run. Heavy rain was a factor for those who were on the course for longer and may have pushed the rate up as well as slowed times.

Median Splits by Age Group at Ironman Florida 2018
Median Splits by Age Group at Ironman Florida 2008-2017

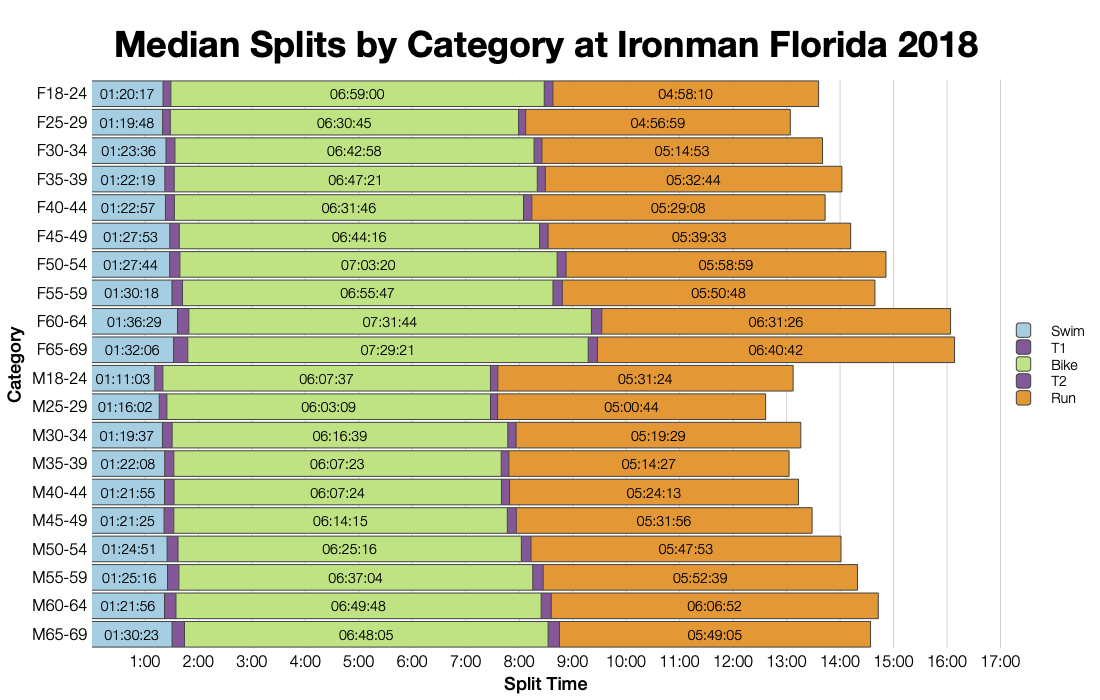
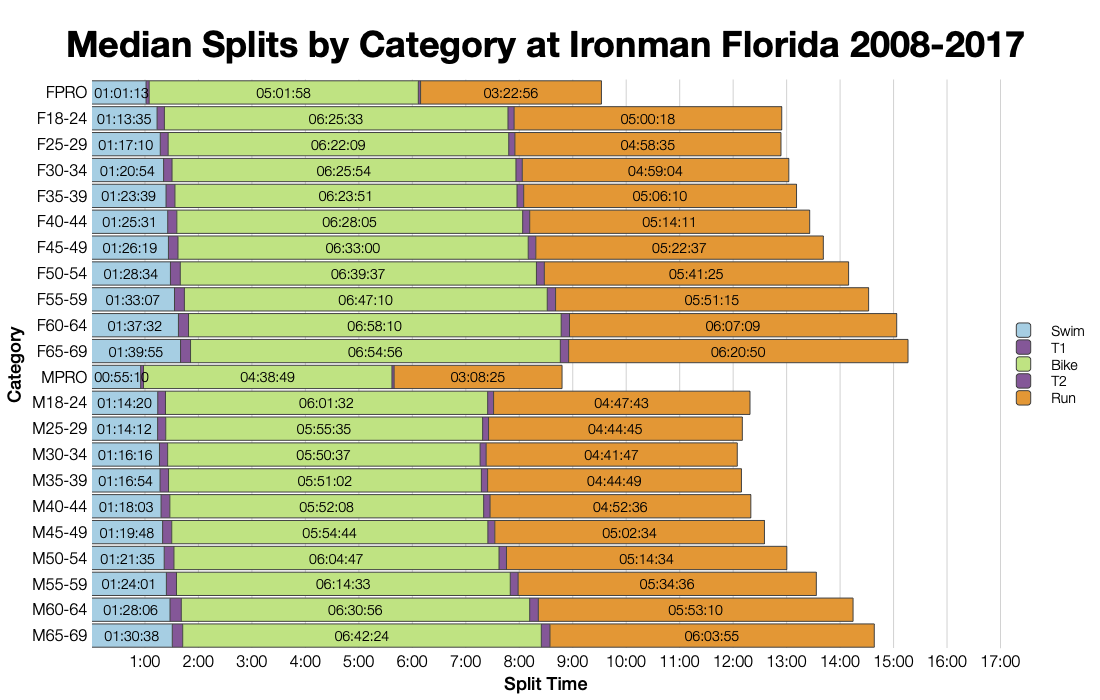
As we saw in the distribution charts the medians were much slower across the board. This remains true across all age groups. While they vary in degree every age group was slower in bike and run.

Top 10 Nationalities at Ironman Florida
Country
Count
Percentage
United States
1373
73.1
Canada
86
4.6
Brazil
36
1.9
United Kingdom
29
1.5
Puerto Rico
25
1.3
Germany
24
1.3
Mexico
23
1.2
Colombia
17
0.9
Sweden
15
0.8
Spain
14
0.7
Ironman Florida 2018 Predicted Kona Qualifiers by Country
Country
Percentage of Slots
Percentage of Field
United States
52.5
75.6
Canada
7.5
4.4
Brazil
7.5
1.6
Denmark
5.0
0.6
Germany
5.0
1.2
Switzerland
2.5
0.2
Sweden
2.5
0.5
United Kingdom
2.5
1.6
Poland
2.5
0.5
Belgium
2.5
0.1
Kazakhstan
2.5
0.2
Czech Republic
2.5
0.1

About 75% of the field came from the US, numbers from elsewhere remained relatively consistent probably due to the levels of commitment to the trip. About half the slots remained in the US.

Changes in Male Finishing Times by Position at Ironman Florida
Changes in Female Finishing Times by Position at Ironman Florida

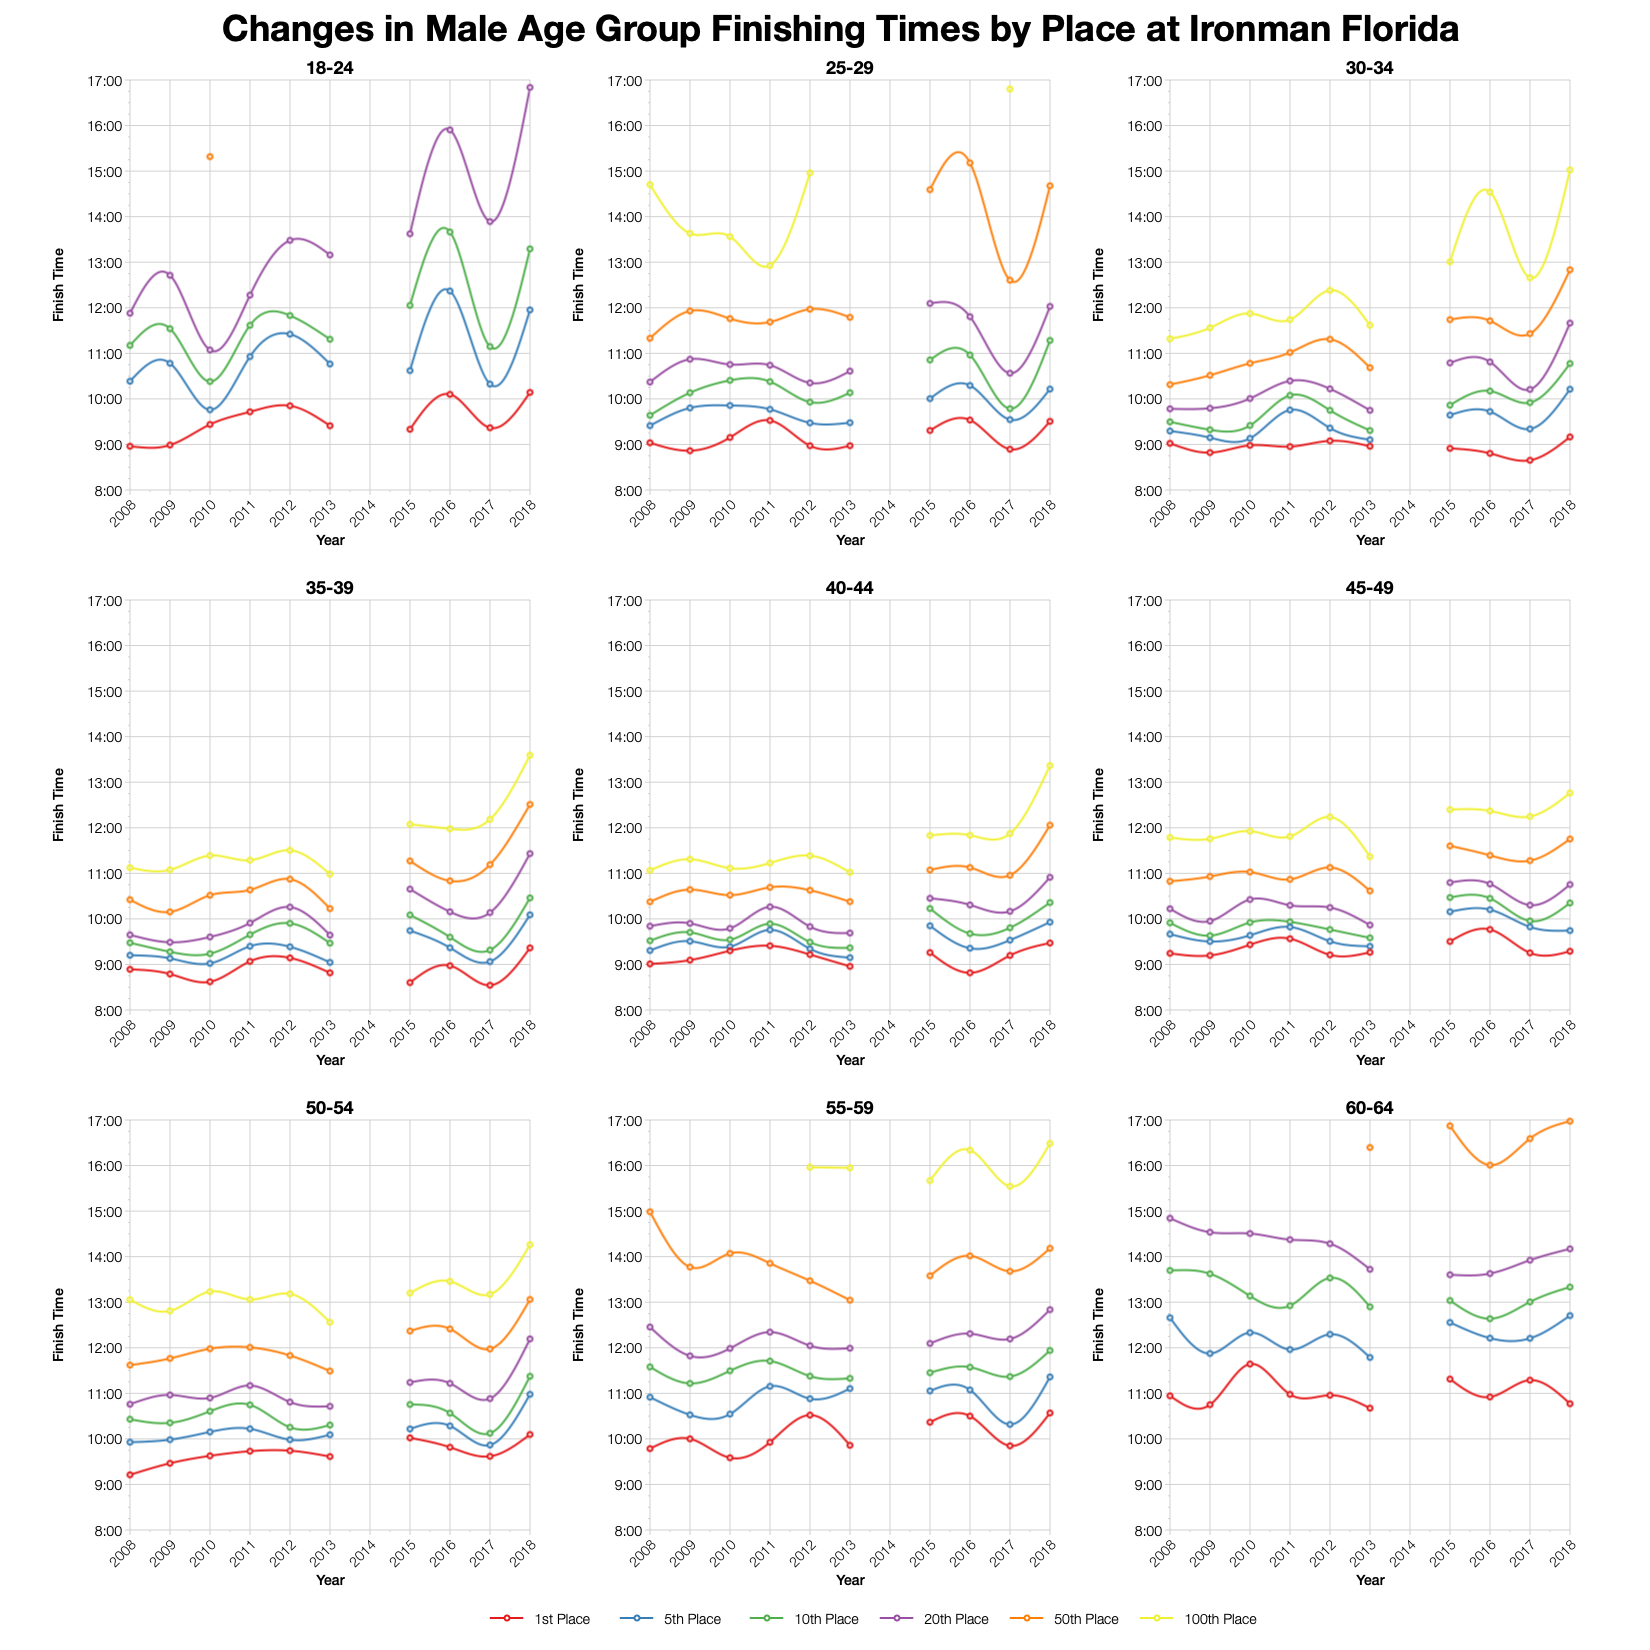
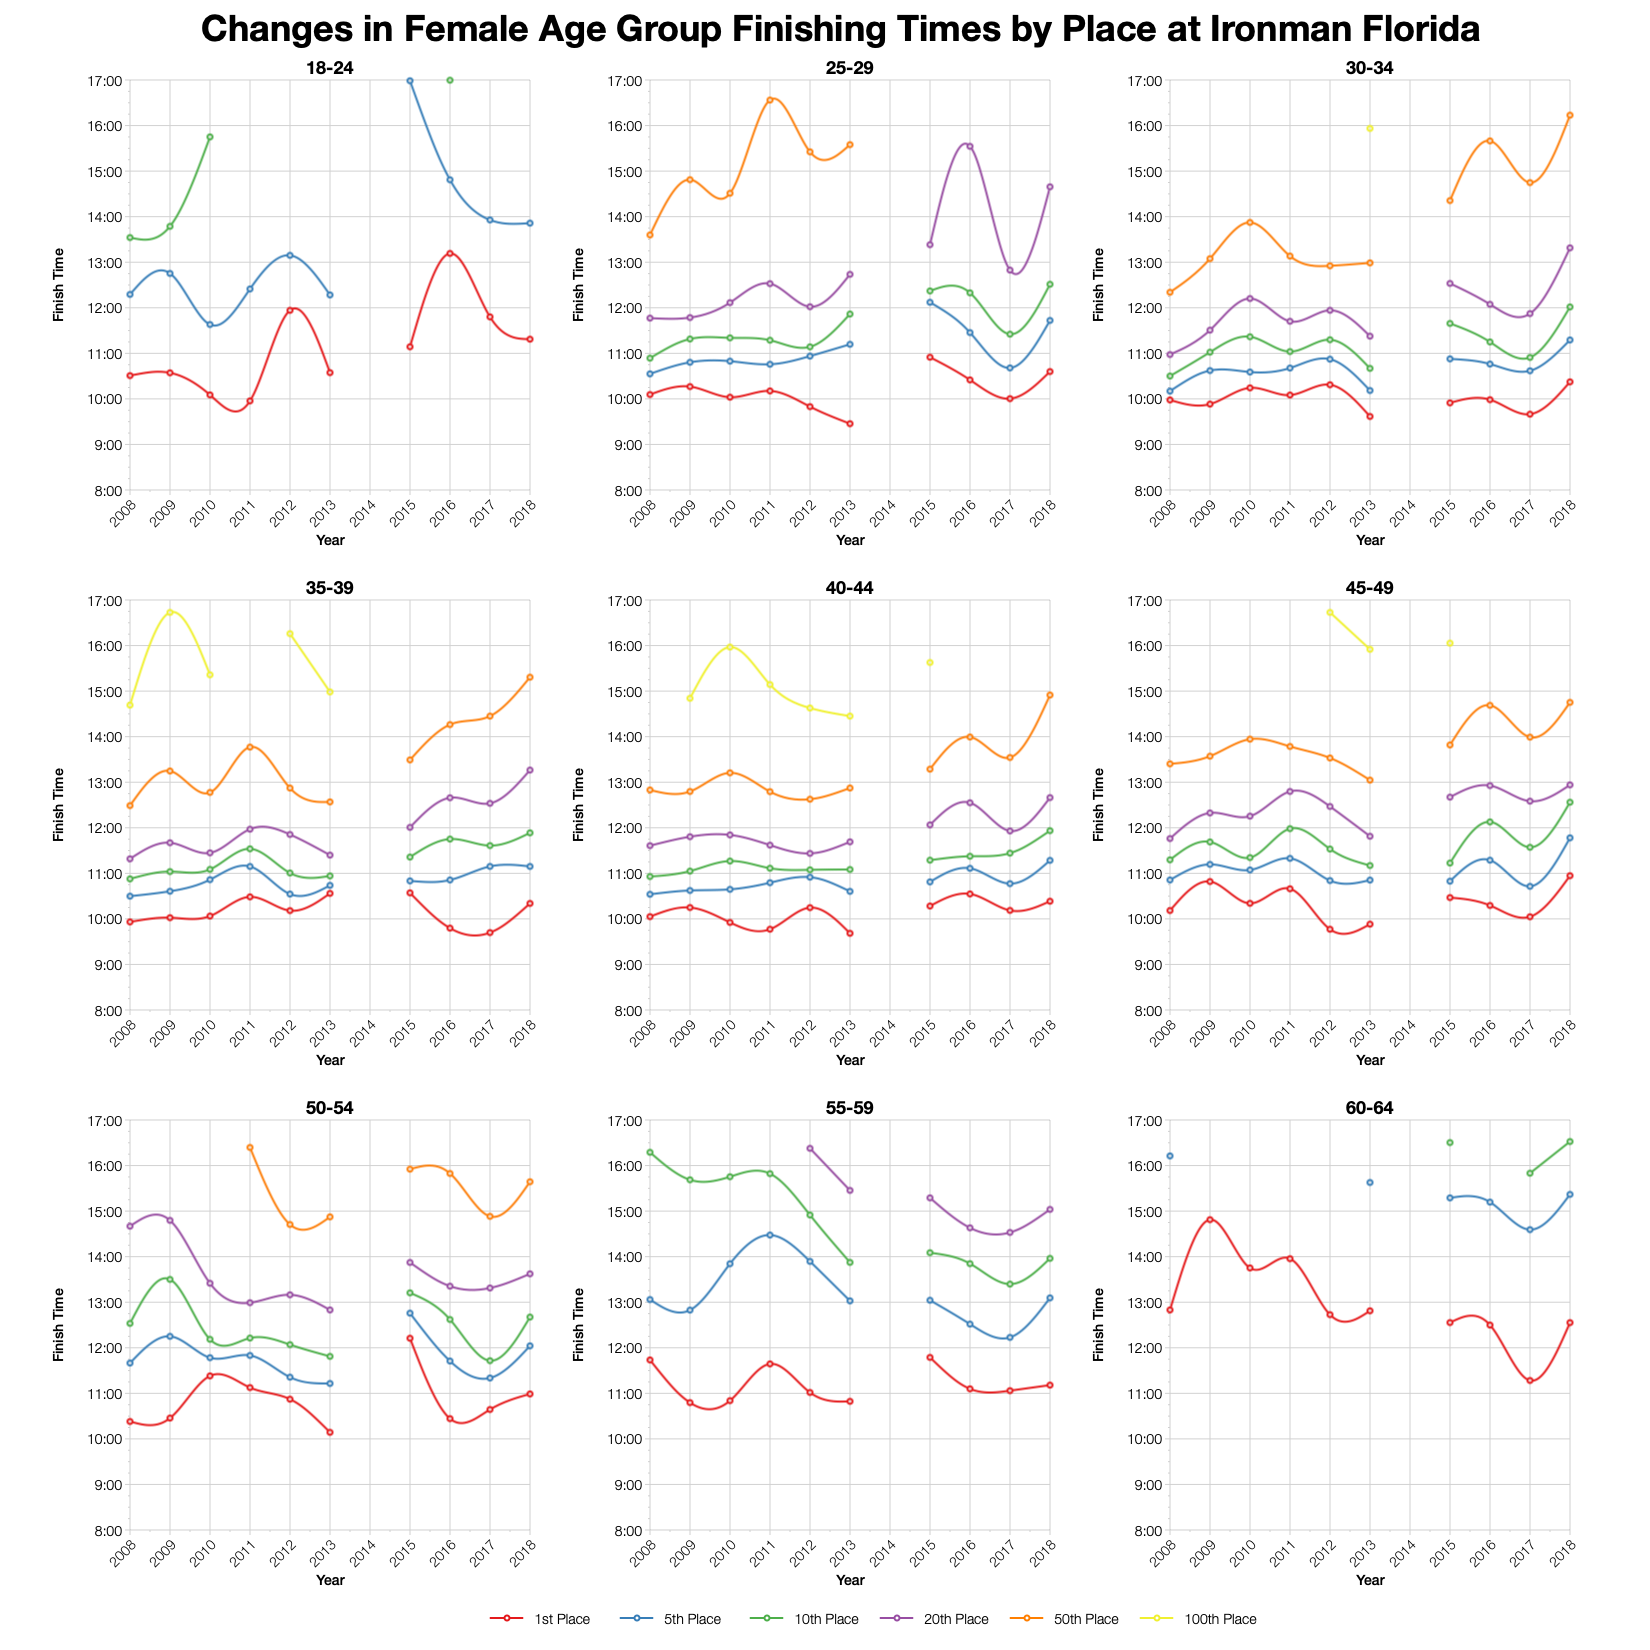
Tracking times for specific age group places shows how this year’s event was consistently slower. In some of the smaller age groups the 2016 times are roughly comparable with this year, but for most the shift is clear. The 2014 race has been excluded due to its missing swim.

Ironman Florida 2018 Predicted Kona Qualification Times
Age Group
Slots
Winner
Average Kona Qualifier
Final Qualifier
M18-24
1
10:08:31
10:08:31
10:08:31
M25-29
1
09:30:24
09:30:24
09:30:24
M30-34
2
09:09:52
09:11:16
09:12:40
M35-39
3
09:21:46
09:29:19
09:38:33
M40-44
4
09:28:14
09:35:34
09:50:40
M45-49
5
09:17:20
09:37:49
09:44:35
M50-54
4
10:05:47
10:30:21
10:51:51
M55-59
2
10:34:06
10:39:52
10:45:39
M60-64
1
10:46:18
10:46:18
10:46:18
M65-69
1
12:16:13
12:16:13
12:16:13
M70-74
1
15:39:46
15:39:46
15:39:46
F18-24
1
11:18:37
11:18:37
11:18:37
F25-29
1
10:35:59
10:35:59
10:35:59
F30-34
1
10:22:25
10:22:25
10:22:25
F35-39
1
10:20:22
10:20:22
10:20:22
F40-44
2
10:23:15
10:43:06
11:02:57
F45-49
2
10:56:52
11:15:36
11:34:21
F50-54
2
10:59:11
11:03:33
11:07:56
F55-59
1
11:10:48
11:10:48
11:10:48
F60-64
1
12:33:07
12:33:07
12:33:07
F65-69
1
14:47:17
14:47:17
14:47:17

I’ve used the official allocation of Kona slots and calculated the automatic qualification times for each age group from these. Roll downs would affect the final times. You can compare this with other Ironman races on my Kona qualification page.

Top Twenty Male Performances and Kona Qualification by Age Group at Ironman Florida 2018
Top Twenty Female Performances and Kona Qualification by Age Group at Ironman Florida 2018

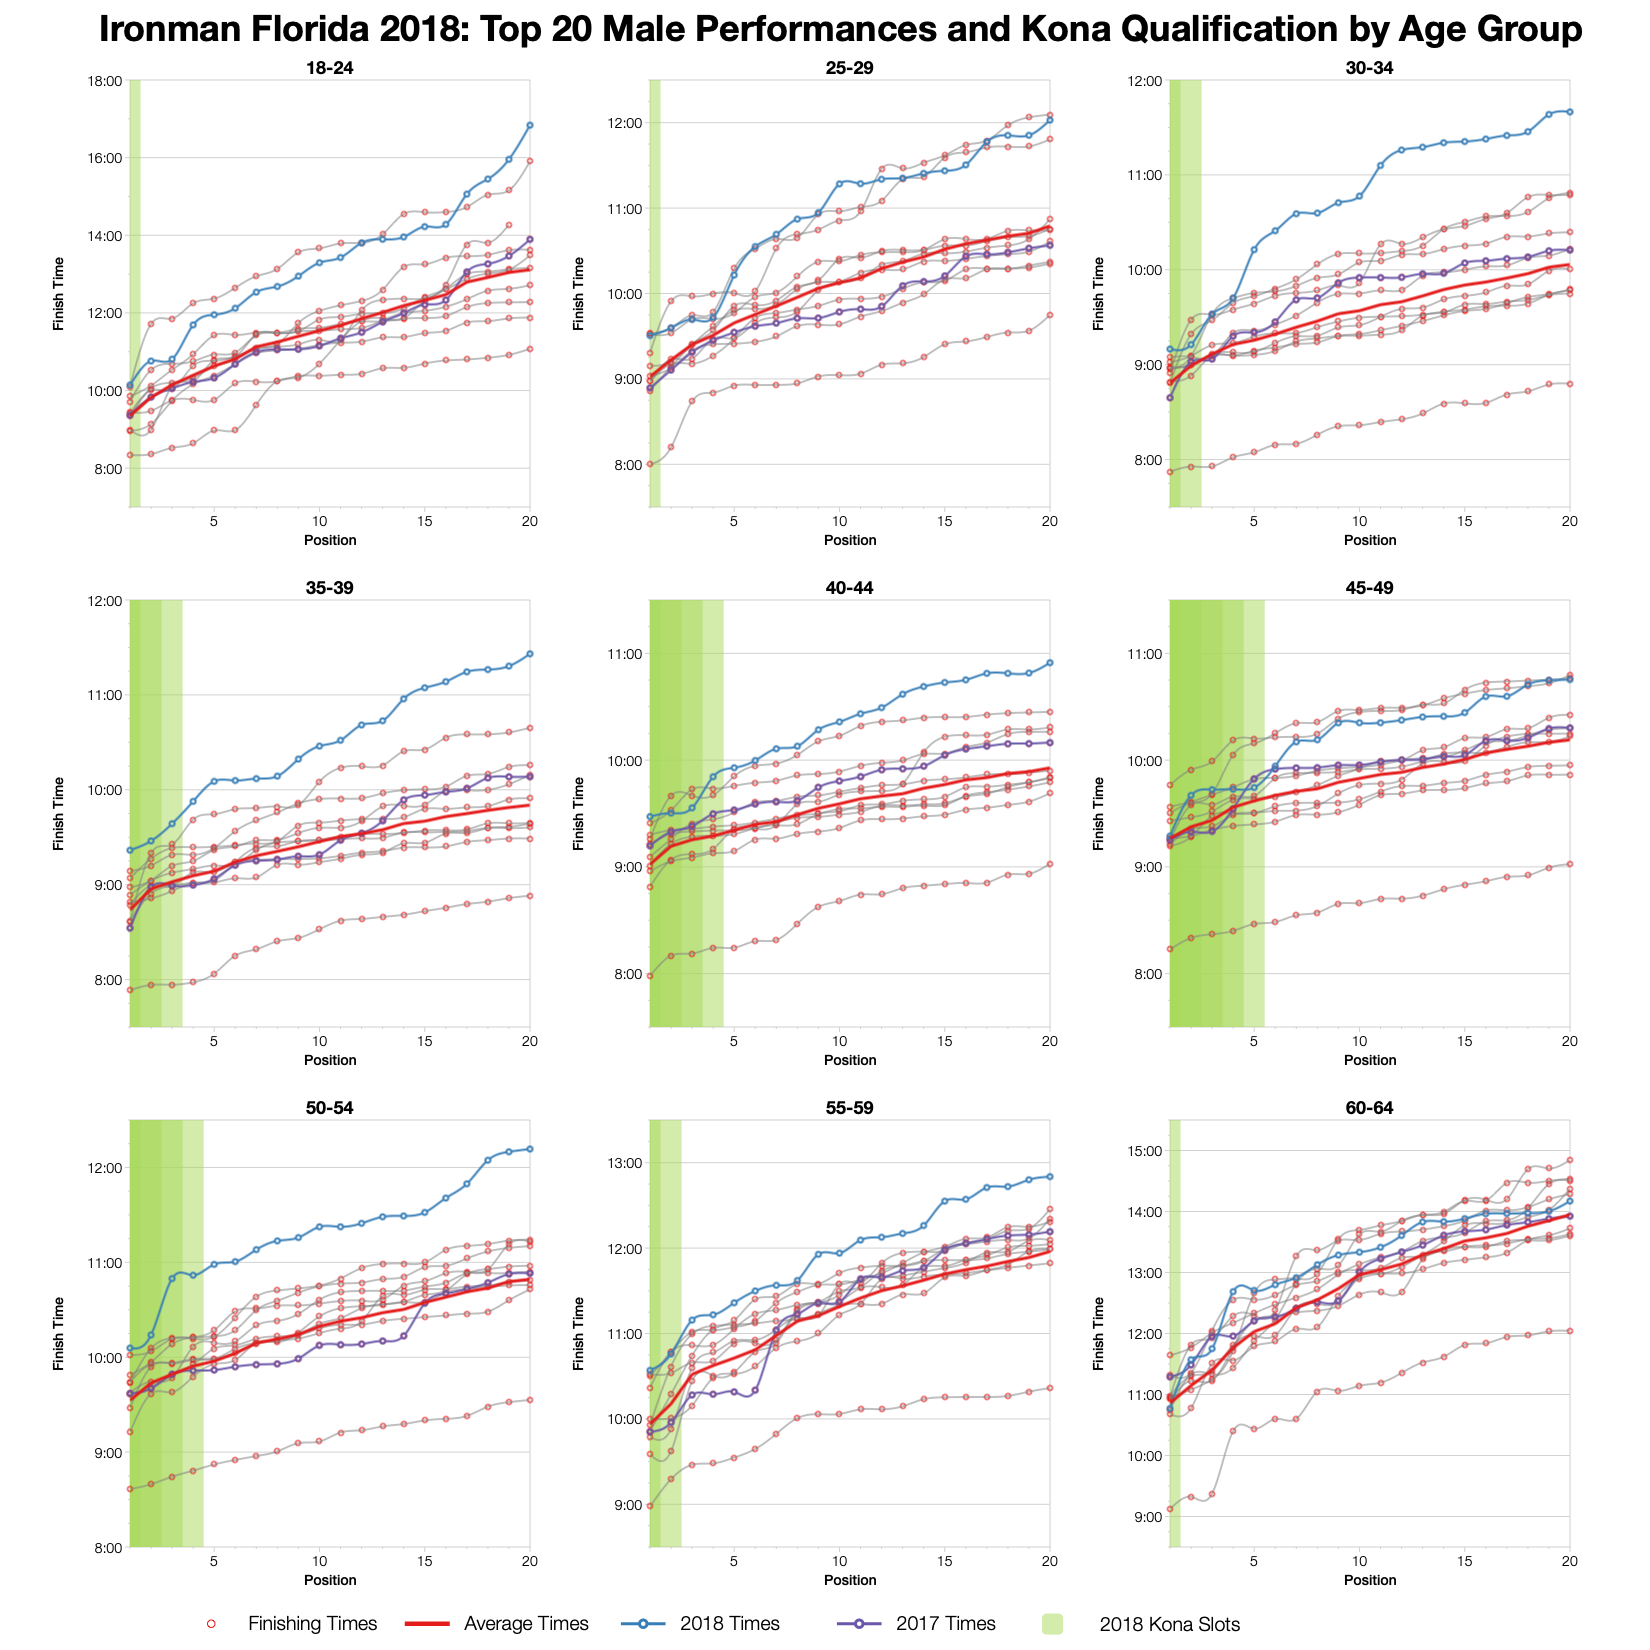
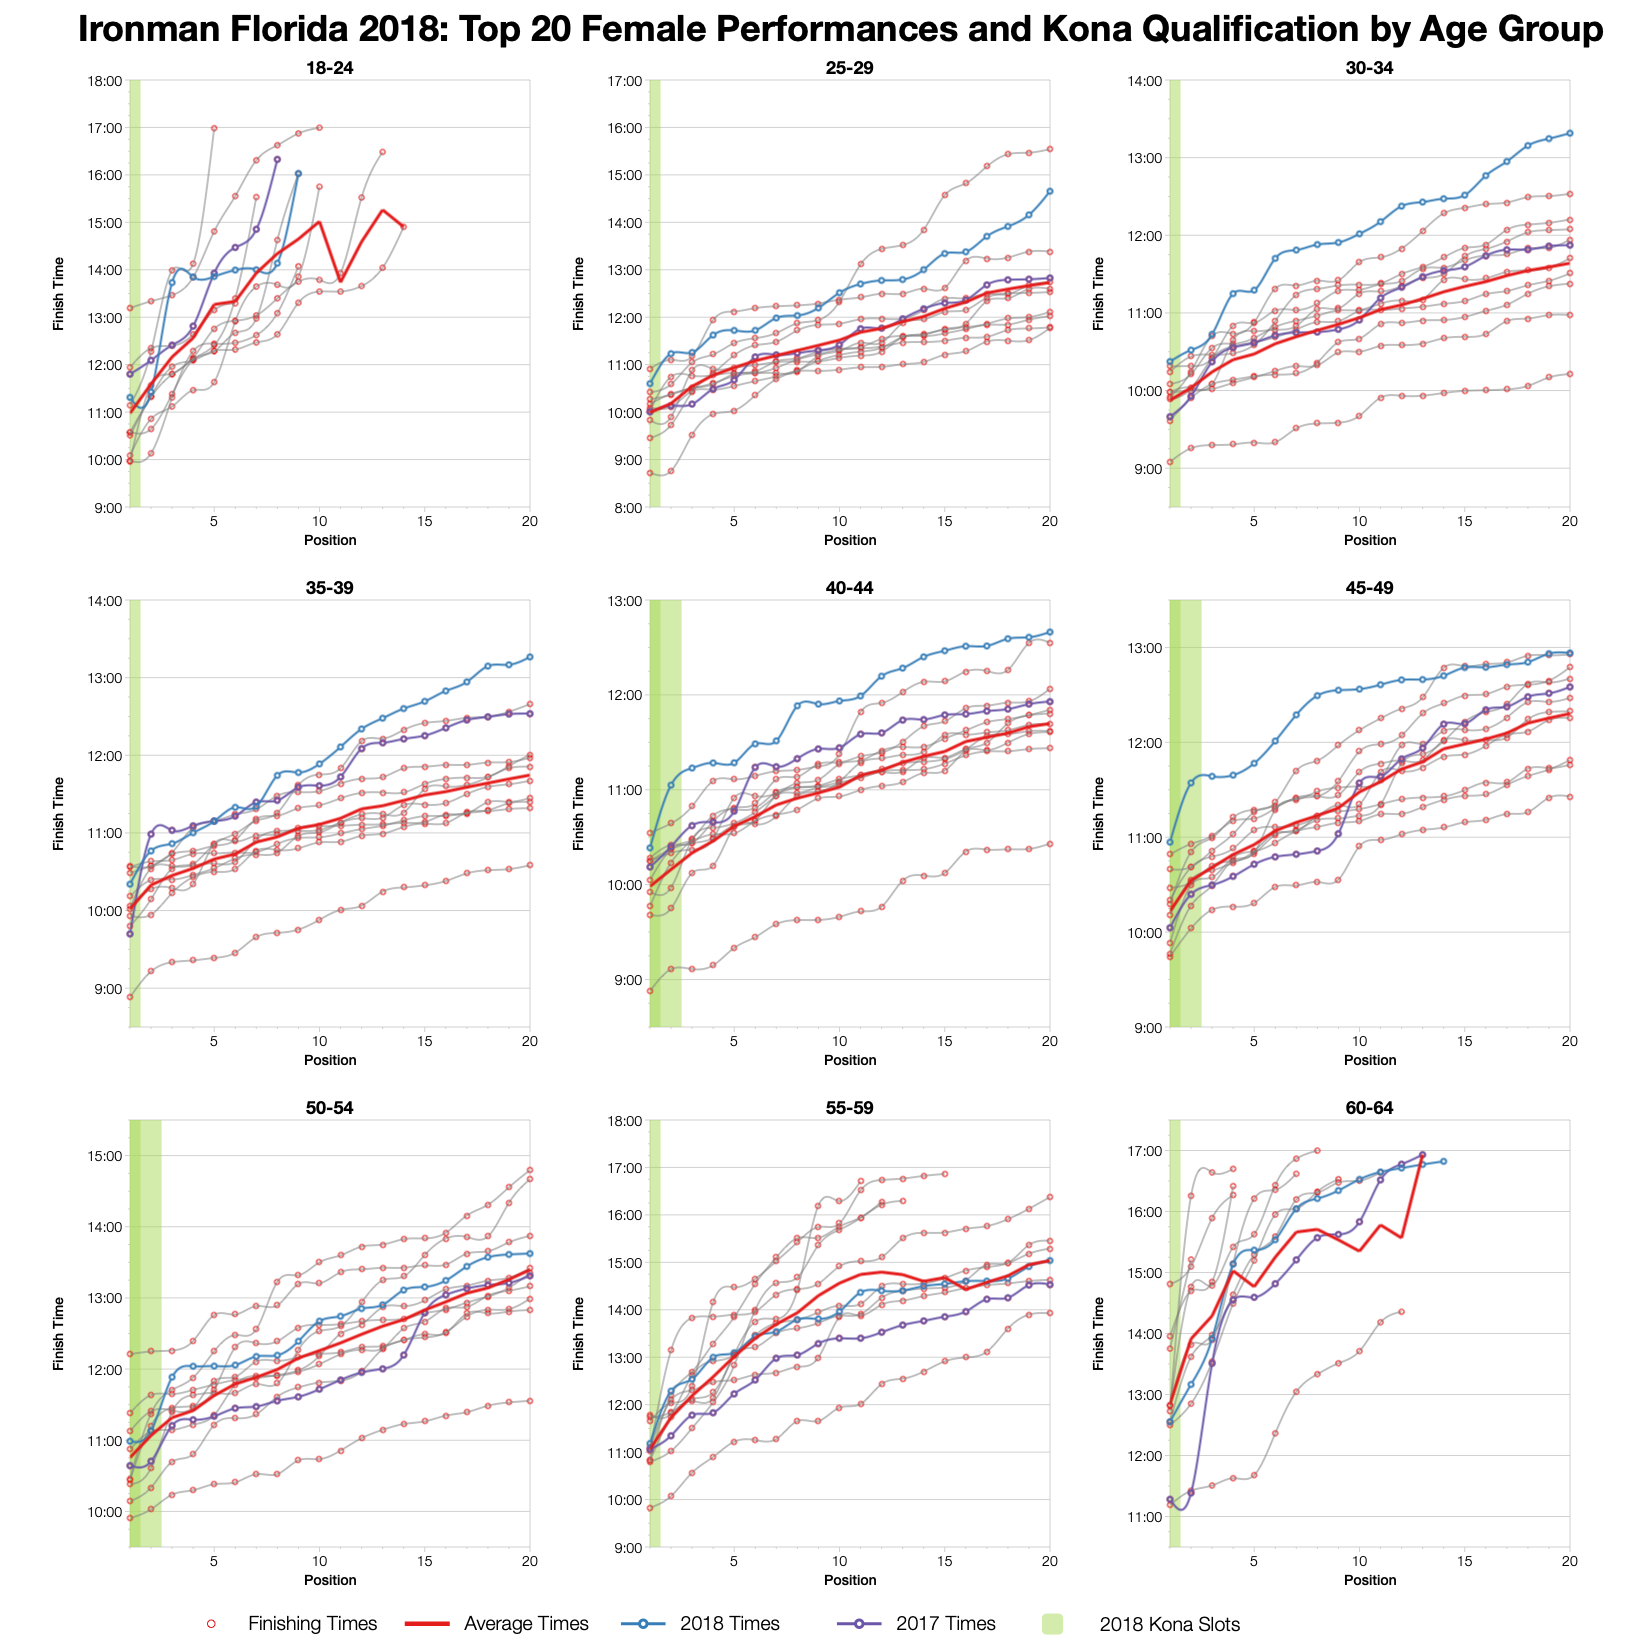
As with the rest of this analysis, we can’t really directly compare results. Every age group’s top twenty is slower than average. How much varies and if we look at the very front, at the qualifying times the gap does close.

You can access a spreadsheet of the full results from Ironman Florida 2018 on my Google Drive.

Latest statistics for Ironman Florida

Kona Qualification

Compare qualification times across the Ironman Calendar.

Kona Consultancy

Individual race analysis and guidance for Kona qualification.

Support the Stats

Support the continued development of these stats.

Comments