Ironman Arizona 2018: Age Group Results and Kona Qualification

Latest statistics for Ironman Arizona

Ironman Arizona is the first of three Ironman races I’ll be analysing this week. Arizona draws a large field with 2,500 athletes making the start line to compete for 40 Ironman World Championship slots. This year’s race looks to have trended slightly slower than usual.

Distribution of Finisher Splits at Ironman Arizona 2018 Compared with 2008-2017

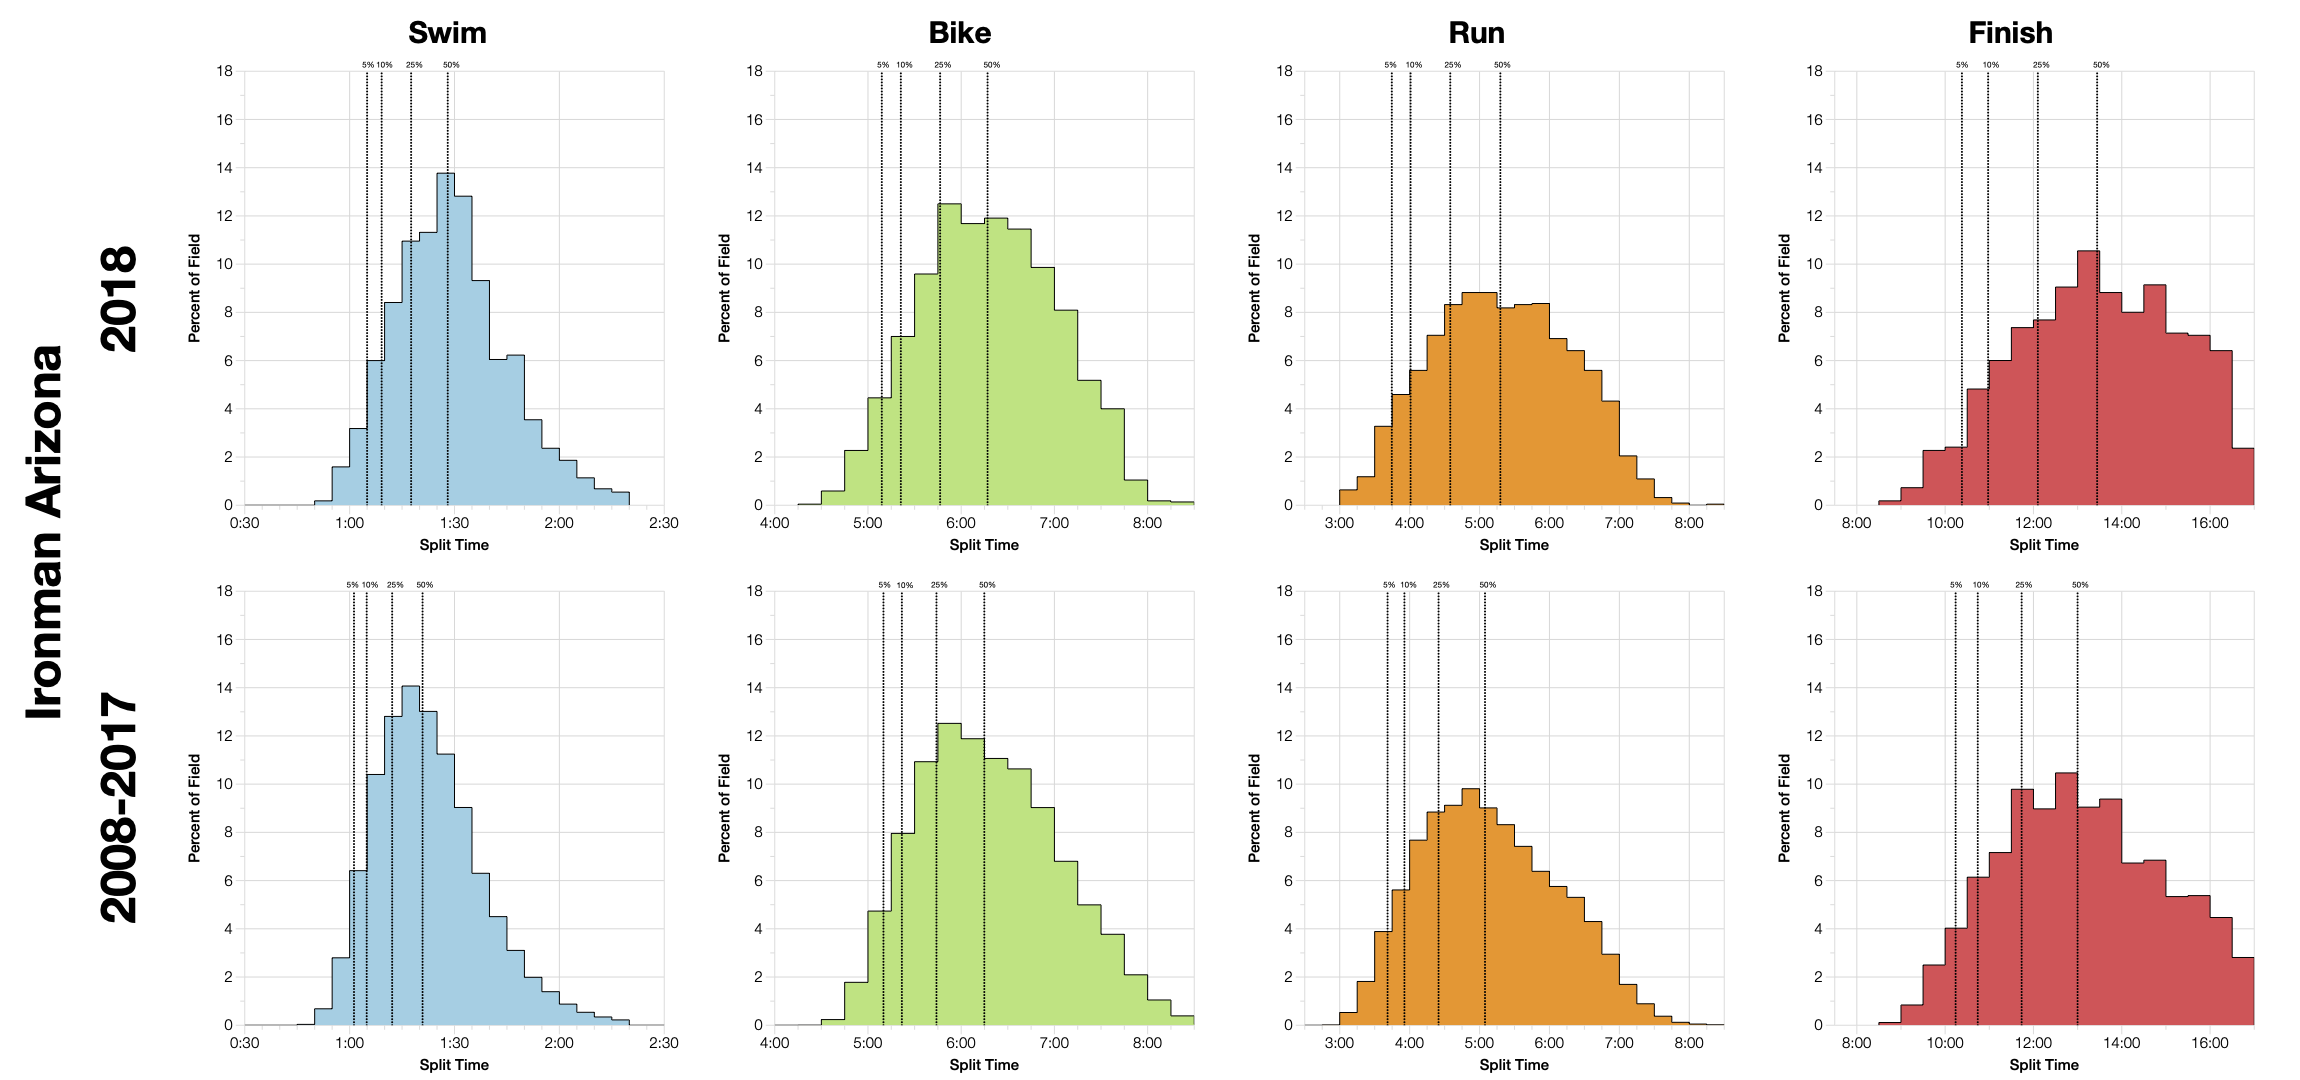
Distributions of age group splits show slower splits at this year’s race when compared with the previous decade of racing. As a consequence the overall distribution also trends slower across the field. Swim and run times are most clearly slower, while the bike splits don’t deviate by much. As is often the case the impact is most noticeable at the median and less pronounced for the top 5% of age groupers.

DNS and DNF Rates at Ironman Arizona
Year
Listed Athletes
Swim Finish
Swim DNS/DNF
Bike Finish
Bike DNF
Run Finish
Run DNF
Overall DNS/DNF
2008
2656
2189
17.6%
2137
2.4%
2075
2.9%
21.8%
2009
2656
2064
22.3%
2064
2075
21.8%
2010
2894
2370
18.1%
2370
2397
17.2%
2011
2768
2357
14.8%
2290
2.8%
2217
3.2%
19.9%
2012
2940
2494
15.2%
2424
2.8%
2375
2%
19.1%
2013
2702
2616
3.2%
2580
1.4%
2514
2.6%
6.7%
2014
3203
2614
18.4%
2484
5%
2390
3.8%
25.4%
2015
2683
2390
10.9%
2294
4%
2211
3.6%
17.6%
2016
2445
2317
5.2%
2250
2.9%
2196
2.4%
10%
2017
2551
2506
1.8%
2353
6.1%
2231
5.2%
12.5%
2018
2502
2411
3.6%
2327
3.5%
2238
3.8%
10.6%

DNF numbers for this years race fall inline with previous years, sitting comfortably in the middle of the range shown. As always it needs to be remembered that prior to 2016 athlete counts include those that did not start.

Median Splits by Age Group at Ironman Arizona 2018
Median Splits by Age Group at Ironman Arizona 2008-2017

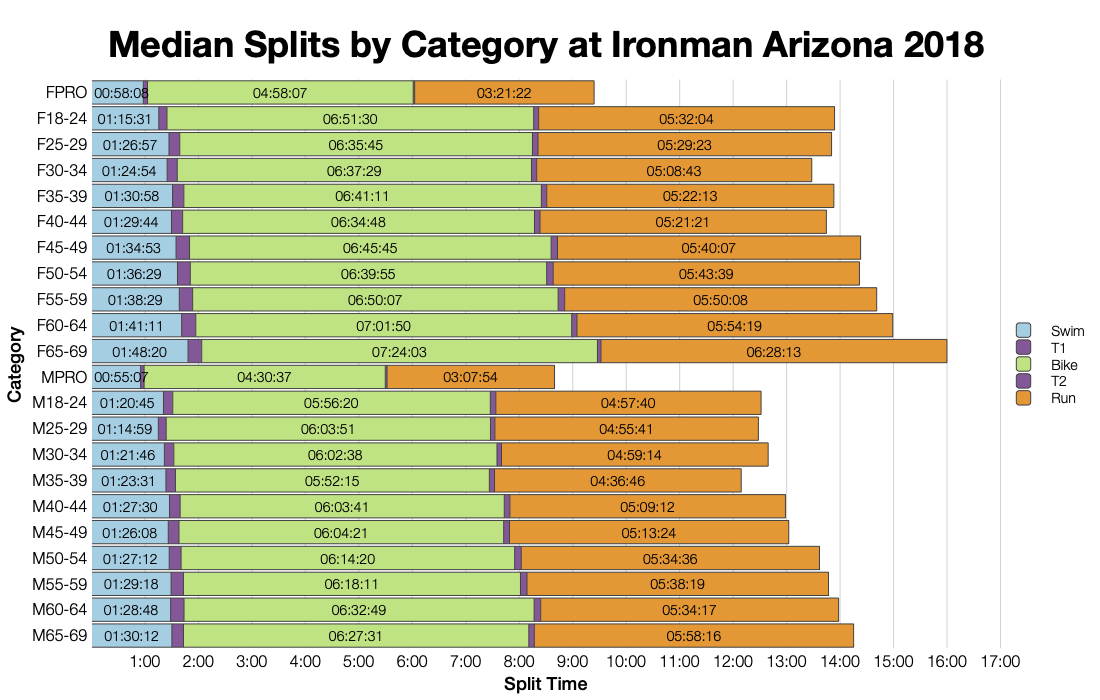
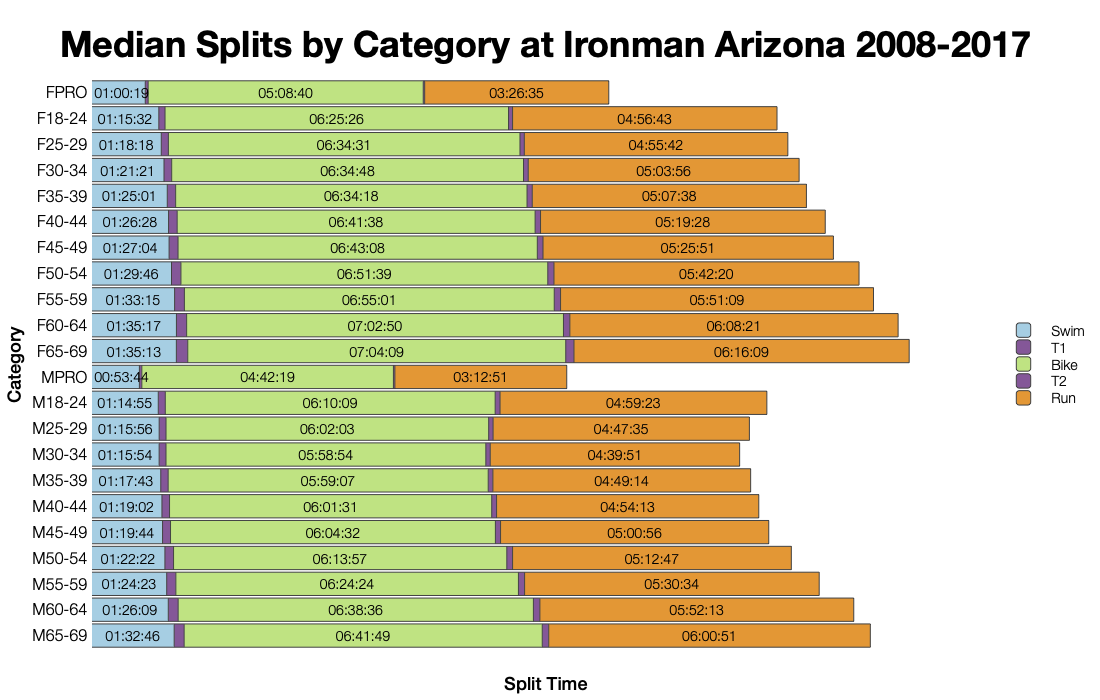
Comparison of individual age group medians shows a similar pattern to the distributions with slower medians splits across most age groups. Again, it’s during the swim and run that this difference is most notable.

Top 10 Nationalities at Ironman Arizona
Country
Count
Percentage
United States
2617
79.9
Canada
199
6.1
Mexico
112
3.4
Philippines
30
0.9
United Kingdom
28
0.9
Costa Rica
18
0.5
Germany
17
0.5
Ireland
15
0.5
Guatemala
14
0.4
France
14
0.4
Ironman Arizona 2018 Predicted Kona Qualifiers by Country
Country
Percentage of Slots
Percentage of Field
United States
70.0
79.9
Canada
12.5
6.1
Brazil
5.0
0.4
Ireland
2.5
0.5
United Kingdom
2.5
0.9
Netherlands
2.5
0.1

As with most North American races the majority of the field is from the US, but there’s a small spread from other nations. Kona slots primarily stay in the US.

Changes in Male Finishing Times by Position at Ironman Arizona
Changes in Female Finishing Times by Position at Ironman Arizona

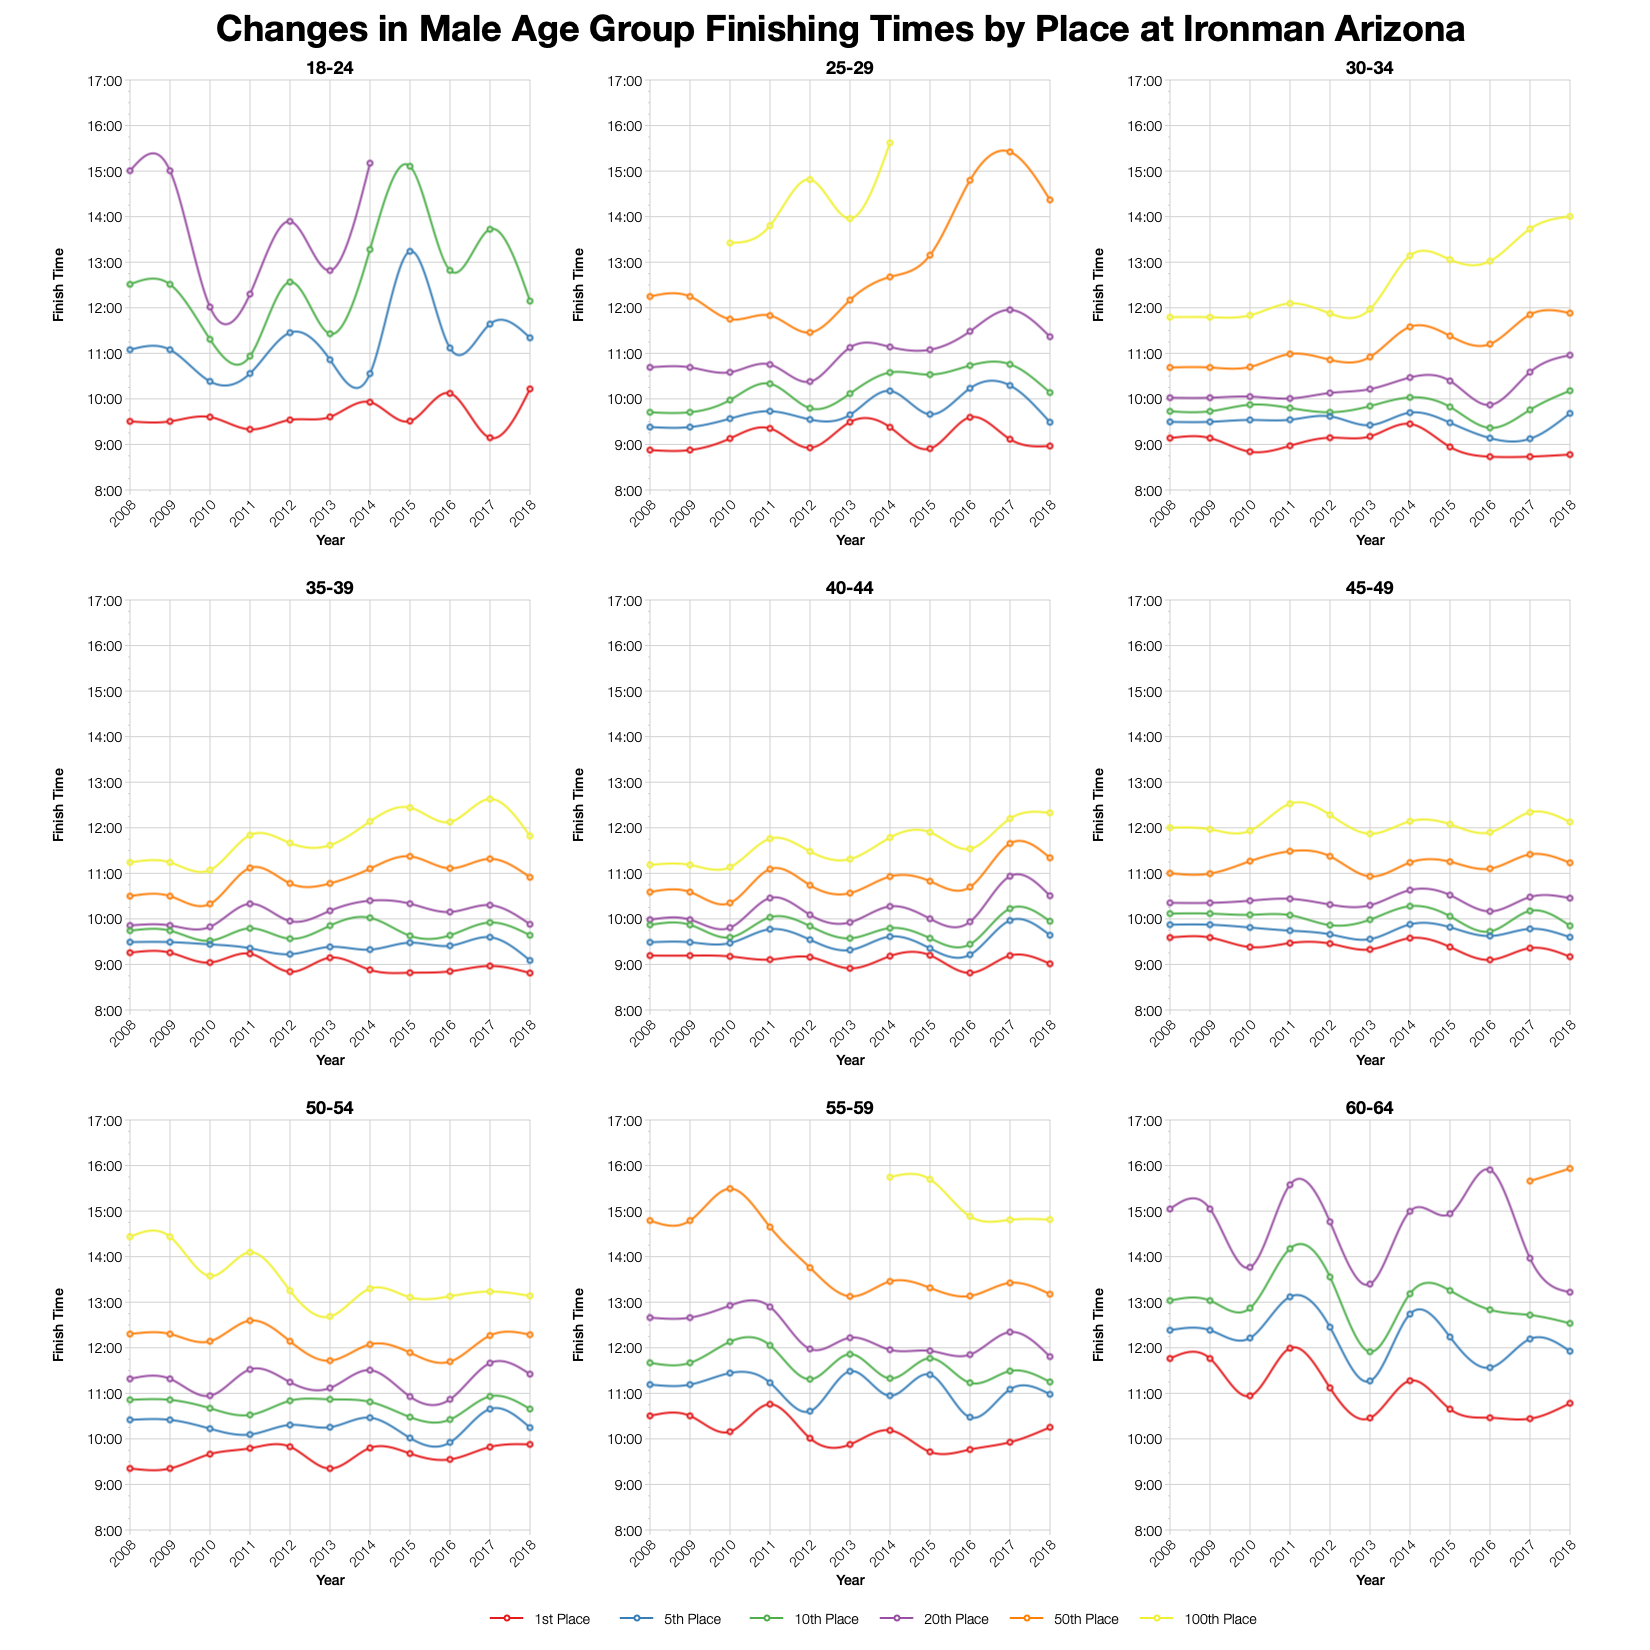
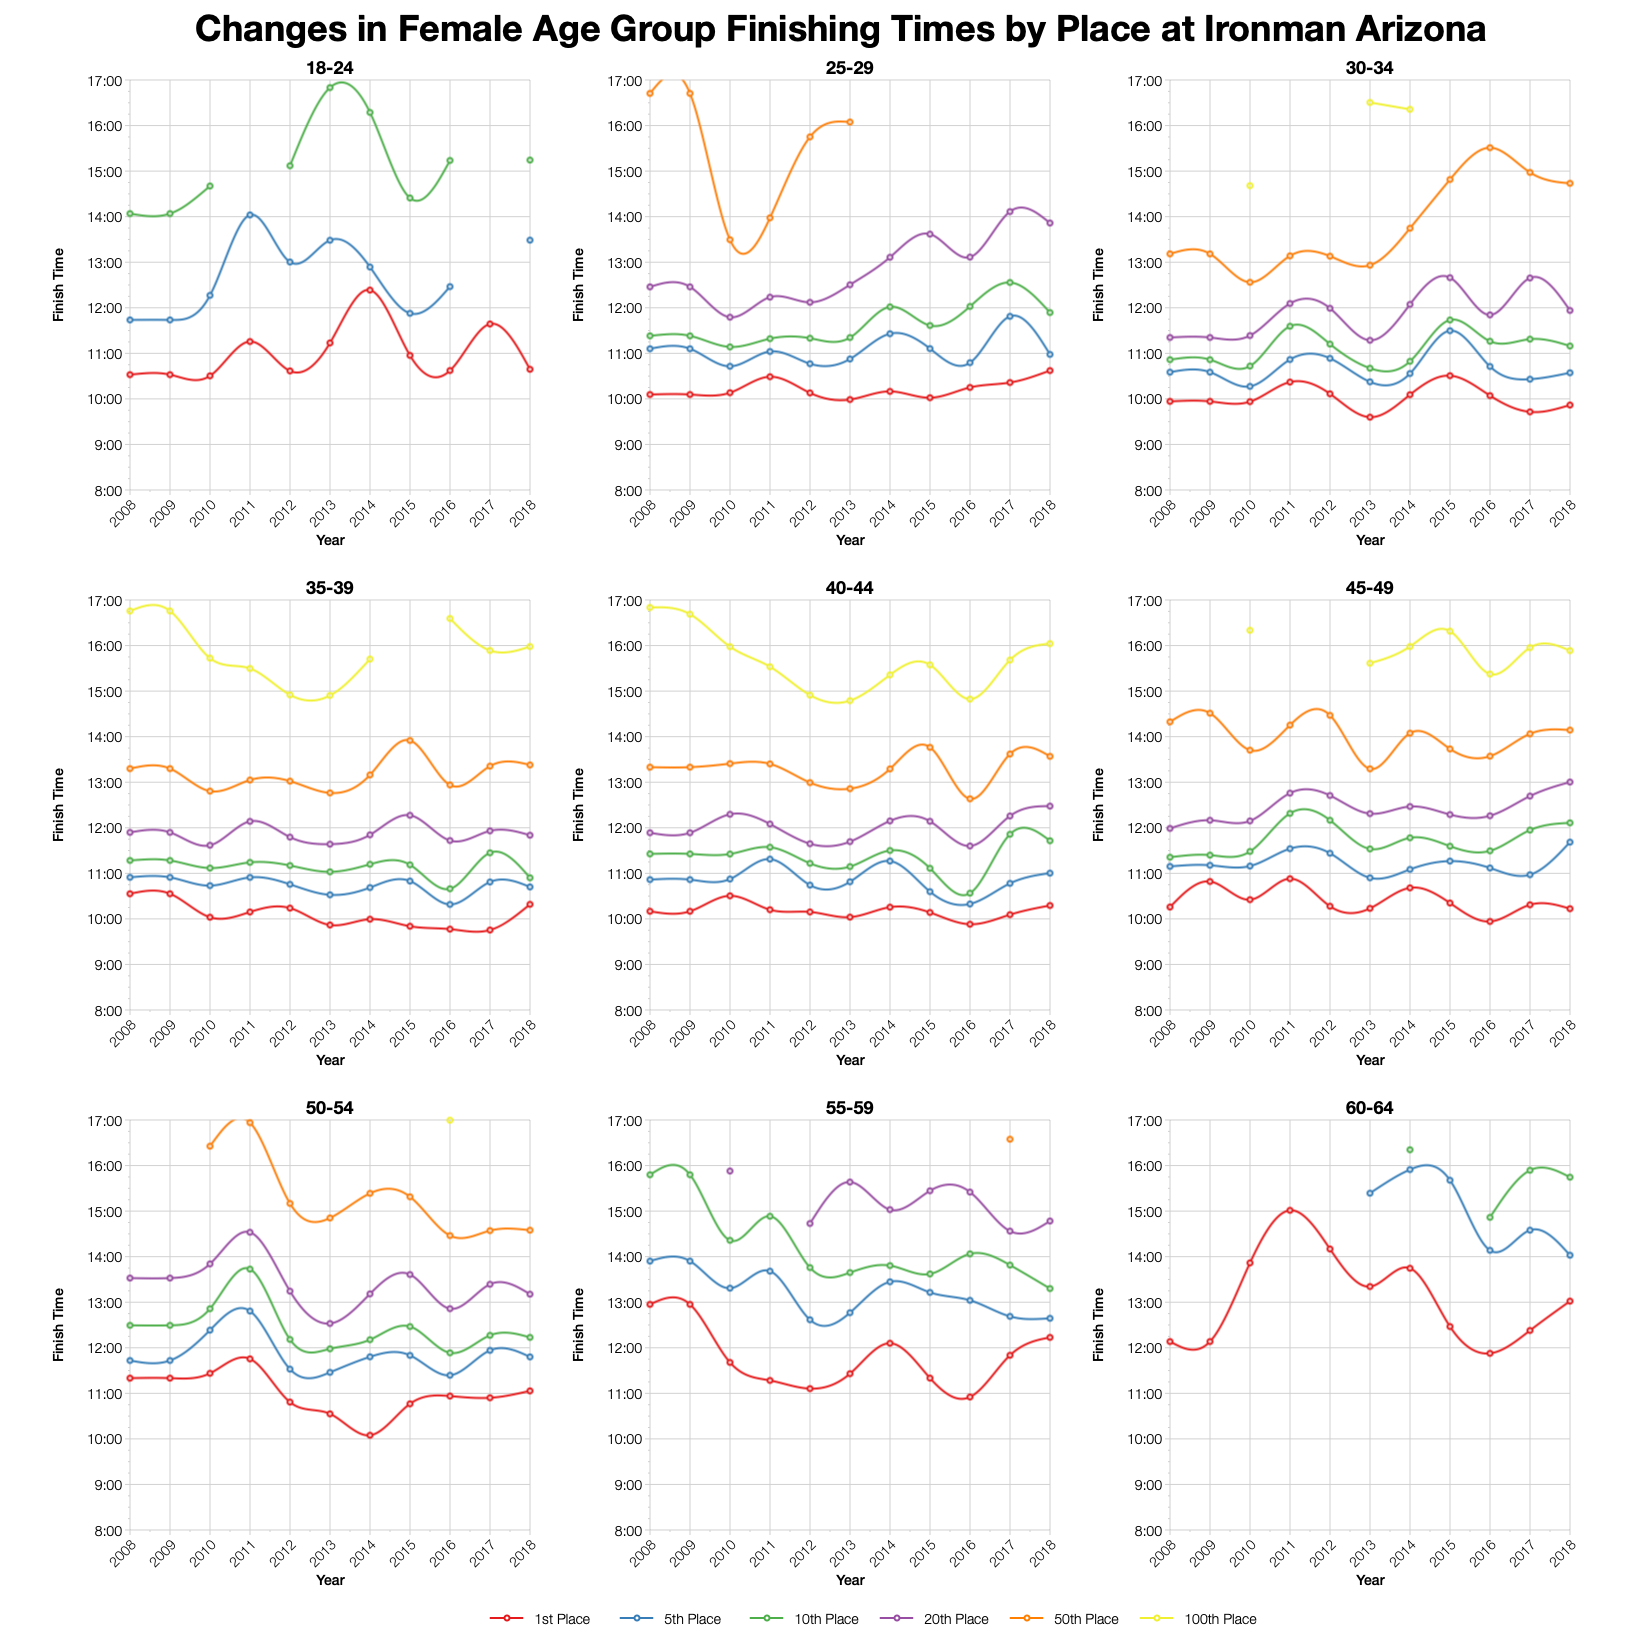
Tracking times for specific age group positions over a decade shows that times varied depending on where you are in the field. For most age groups the front athletes aren’t too far off typical times for the course. Further back, towards the median the slower times are more obvious. It’s worth noting that while this trends slower than the amalgamated decade of results, the race was faster than in 2017.

Ironman Arizona 2018 Predicted Kona Qualification Times
Age Group
Slots
Winner
Average Kona Qualifier
Final Qualifier
M18-24
1
10:13:05
10:13:05
10:13:05
M25-29
1
08:57:55
08:57:55
08:57:55
M30-34
2
08:46:38
09:10:44
09:34:51
M35-39
4
08:48:42
08:58:27
09:04:51
M40-44
4
09:00:49
09:18:31
09:36:33
M45-49
4
09:10:10
09:19:26
09:29:45
M50-54
4
09:52:43
09:54:53
10:00:26
M55-59
3
10:15:16
10:30:16
10:40:26
M60-64
1
10:46:55
10:46:55
10:46:55
M65-69
1
11:47:07
11:47:07
11:47:07
M70-74
1
13:24:43
13:24:43
13:24:43
M75-79
1
16:24:41
16:24:41
16:24:41
F18-24
1
10:38:57
10:38:57
10:38:57
F25-29
1
10:37:17
10:37:17
10:37:17
F30-34
1
09:51:54
09:51:54
09:51:54
F35-39
1
10:19:09
10:19:09
10:19:09
F40-44
1
10:17:38
10:17:38
10:17:38
F45-49
2
10:13:25
10:17:18
10:21:11
F50-54
1
11:03:13
11:03:13
11:03:13
F55-59
1
12:13:39
12:13:39
12:13:39
F60-64
1
13:01:25
13:01:25
13:01:25
F65-69
1
15:21:55
15:21:55
15:21:55

I’ve estimated the Kona slot allocation was I’ve yet to see a copy of the official list. Exact slot numbers may vary and with that final qualifier times for some age groups. Roll downs aren’t factored in to these calculations. You can compare with other races on my Kona qualification page.

Top Twenty Male Performances and Kona Qualification by Age Group at Ironman Arizona 2018
Top Twenty Female Performances and Kona Qualification by Age Group at Ironman Arizona 2018

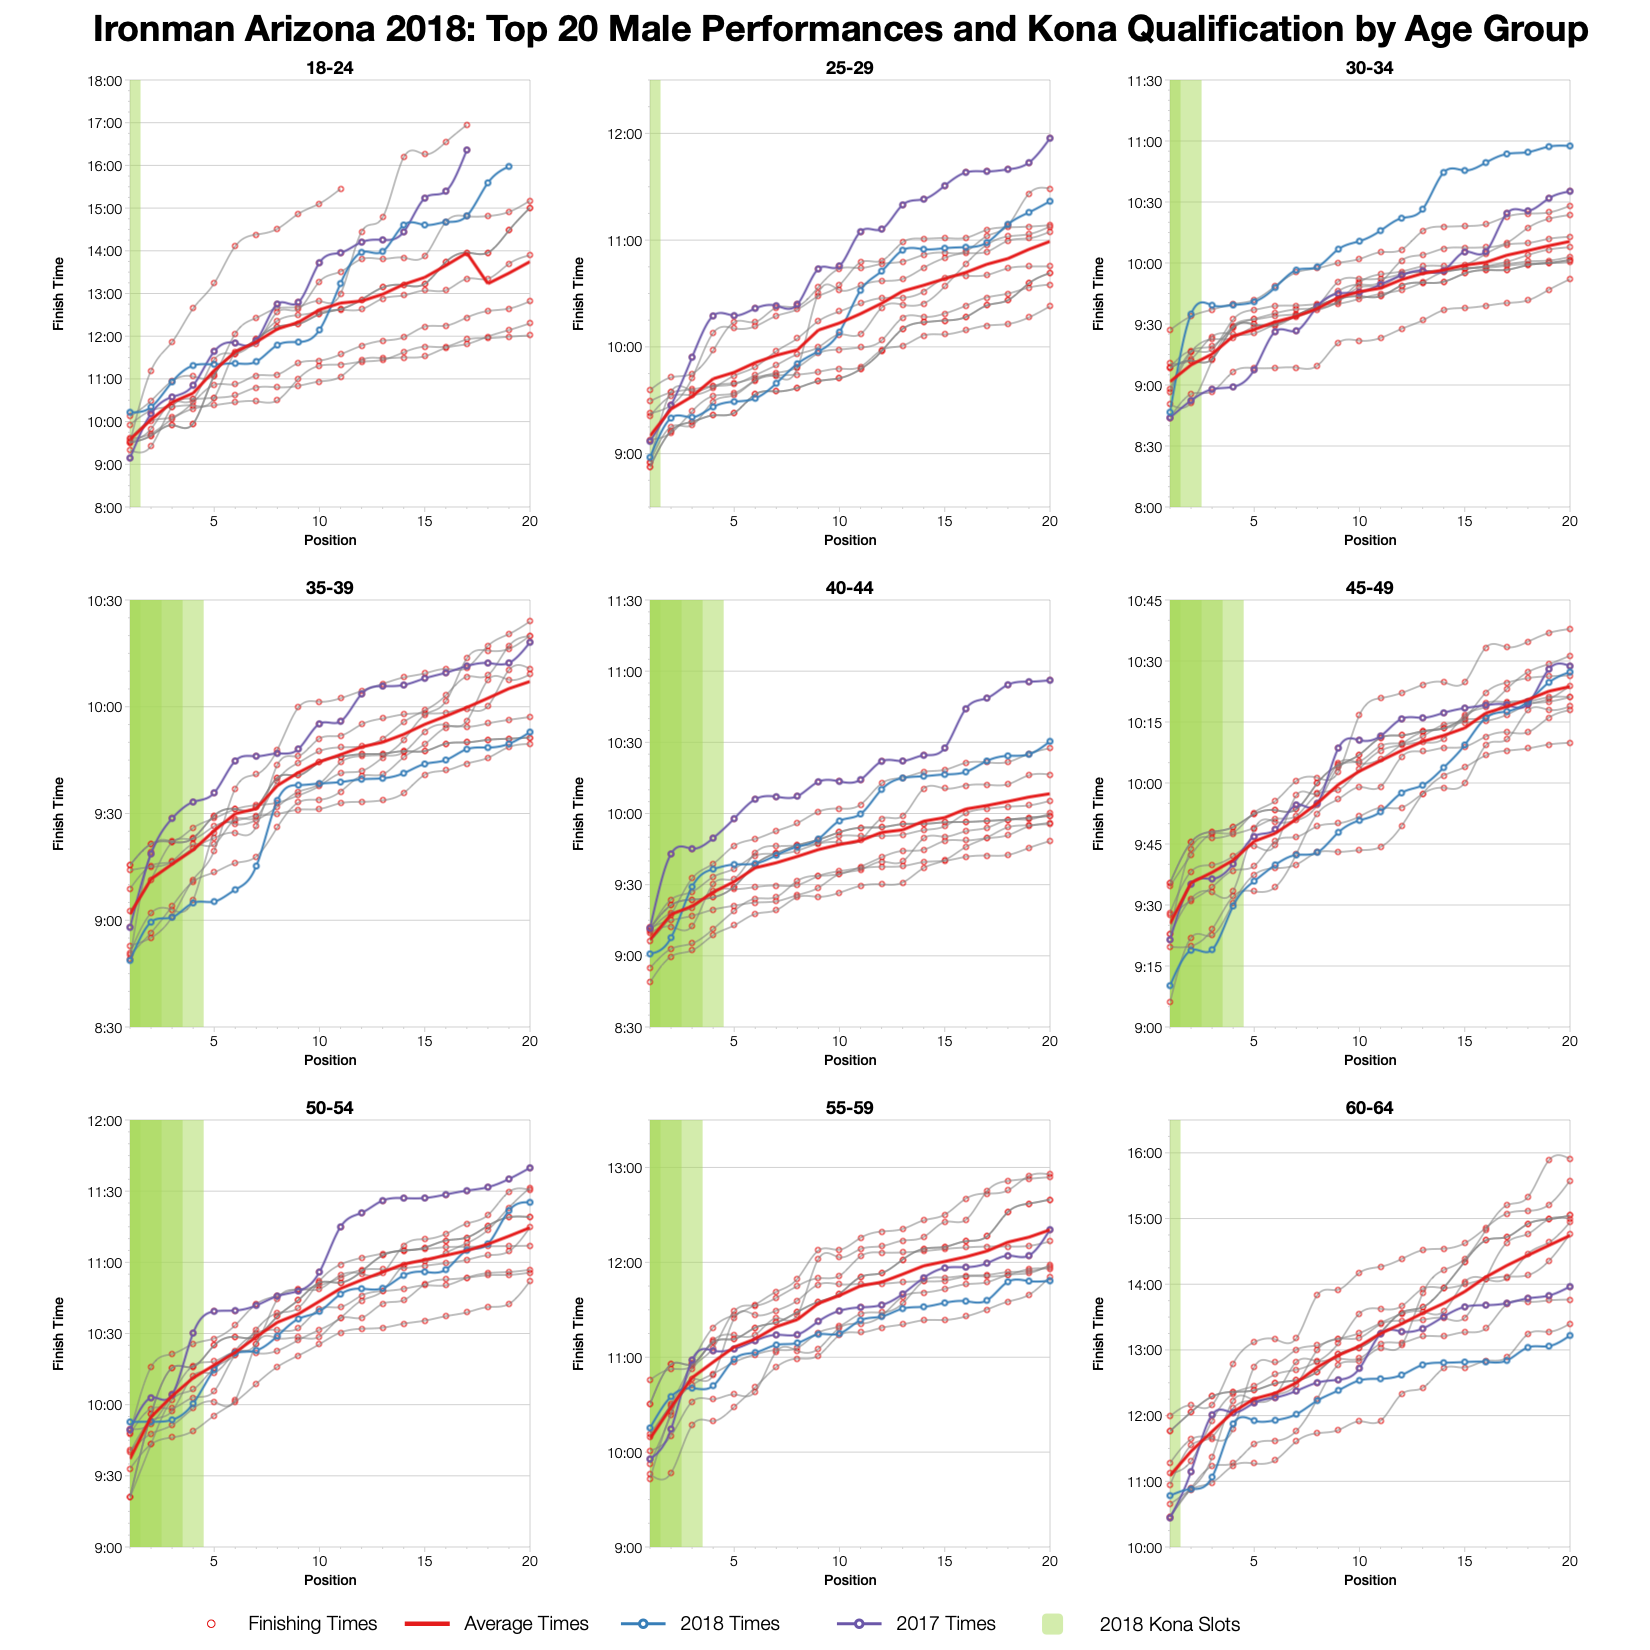
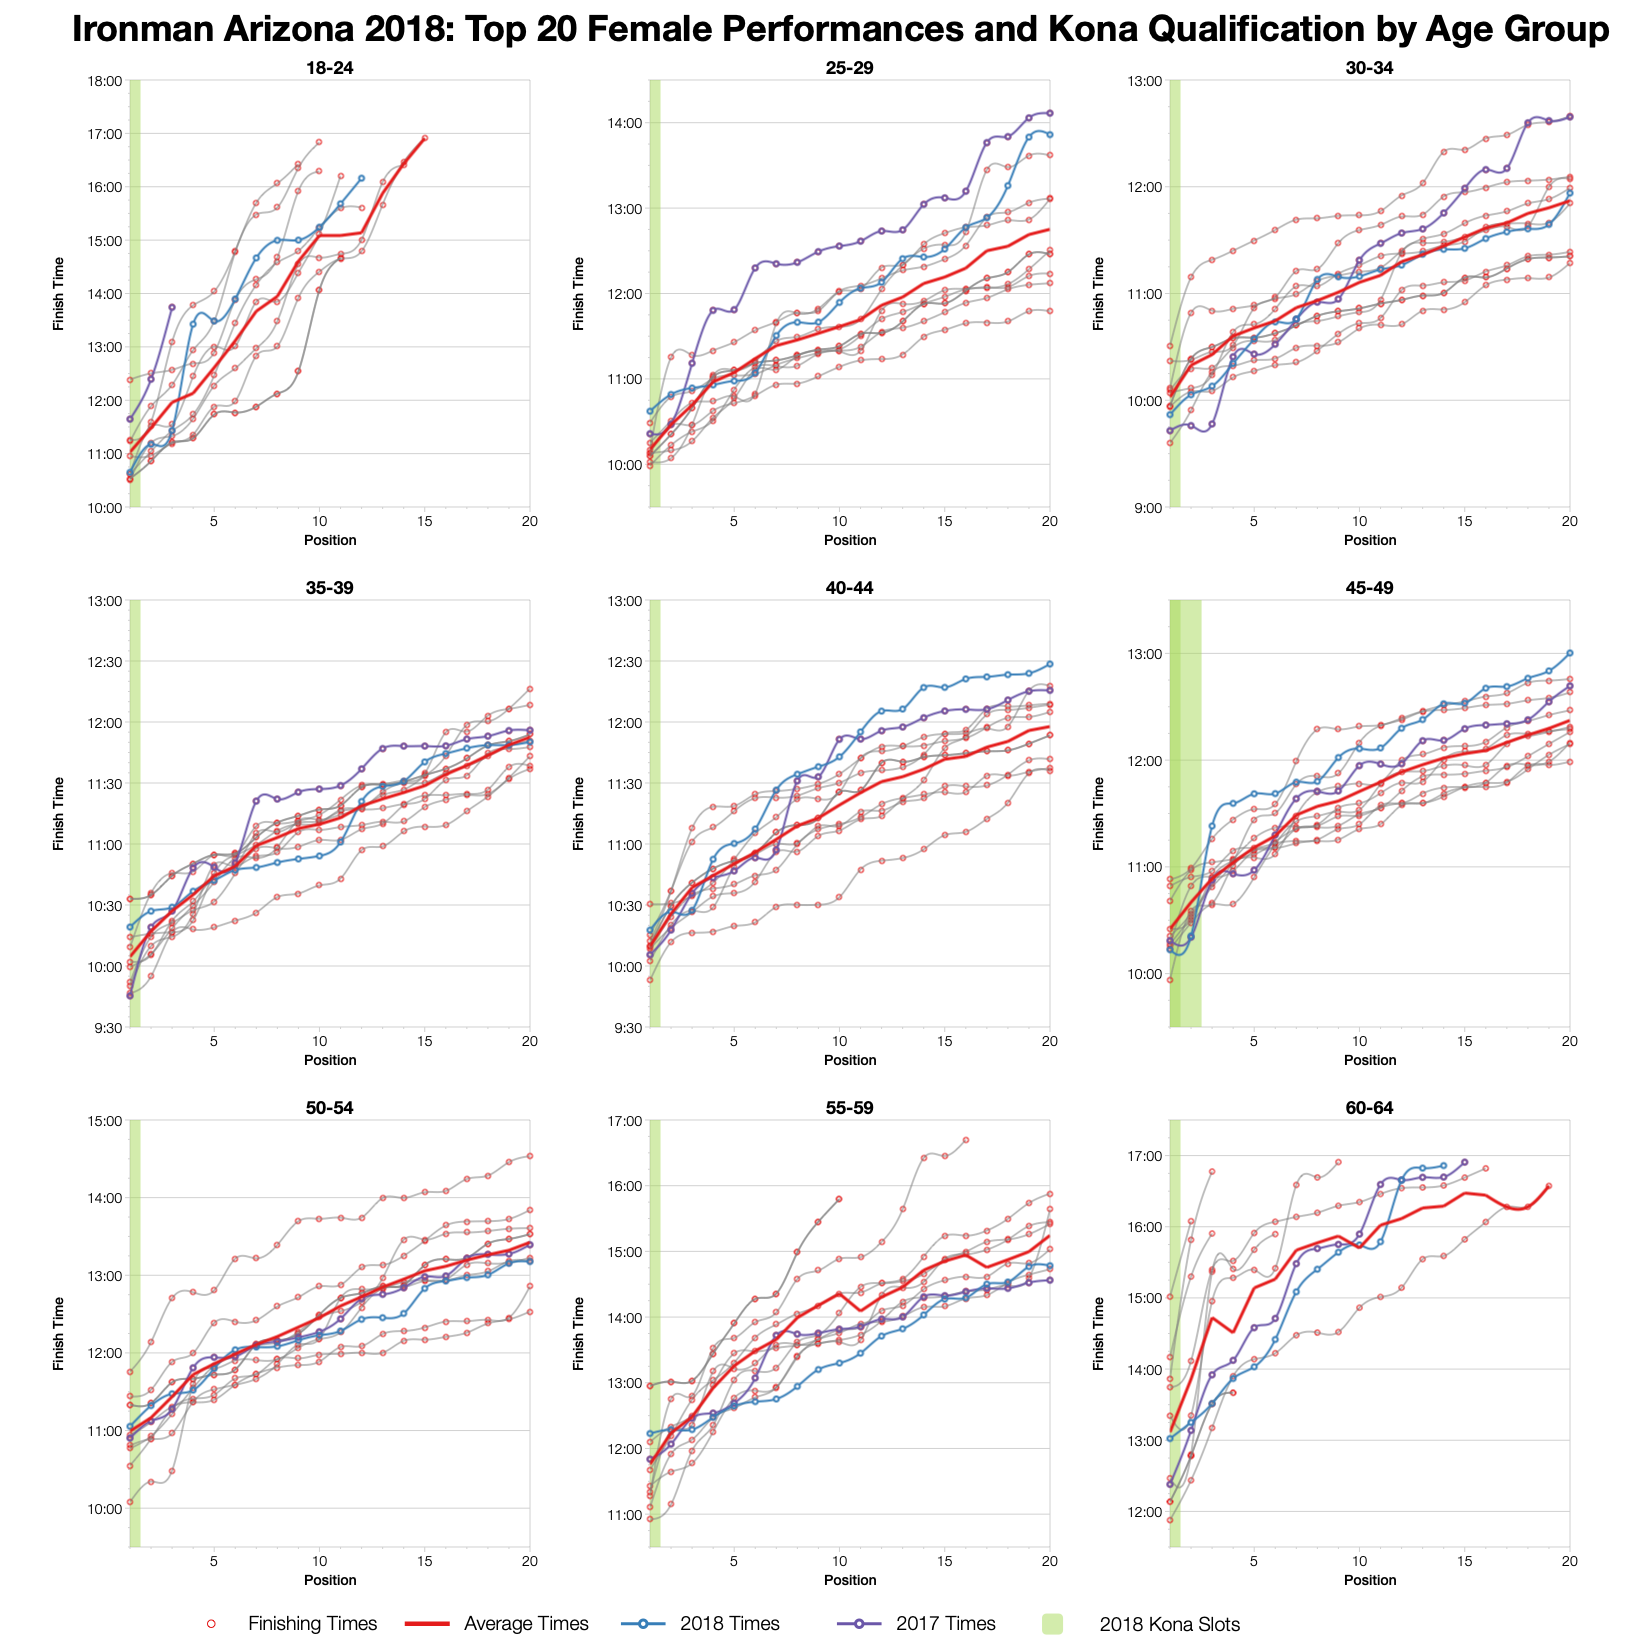
Finally, examining the top twenty results within each age group we see times trend closer to the averages, particularly when in the top 5. At the front of the race it wasn’t a fast year, but it also wasn’t as slow as further back in the field. Qualification times for most age groups were similar to previous years.

You can access a spreadsheet of the full results from Ironman Arizona 2018 on my Google Drive.

Latest statistics for Ironman Arizona

Kona Qualification

Compare qualification times across the Ironman Calendar.

Kona Consultancy

Individual race analysis and guidance for Kona qualification.

Support the Stats

Support the continued development of these stats.

Comments