Official information about age group slots for the Ironman World Championship is remarkably limited. Whether it’s how they are allocated or who qualified at a specific race, little is published on the Ironman site. The key driver for my stats is trying to determine the times needed to qualify at specific races and this relies on being able to reasonably estimate how many Kona slots an age group will have. This post is going to look at how Kona slots are currently being allocated.
History
Until a couple of years ago I relied on best estimates for the method Ironman used. Then a picture of the allocation spreadsheet from a race made it possible to replicate the maths. For a while my allocations matched – with allowances for variations in start numbers – the official figures. This year it become apparent that Ironman had changed their method and my numbers were no longer doing the job.
As Ironman has never offered any statements on slot allocation it’s impossible to know how often they’ve changed their approach or when they’ve done this. Slot allocation is something that happens at races and doesn’t spread far beyond the roll down. The only information to work with is pictures of official allocations that make it out into forums or social media.
After many fruitless attempts to replicate the new allocations I think I’ve finally cracked it. I wouldn’t have managed it if Thorsten hadn’t provided some information on how Pro slots appeared to be assigned. With this info I’ve been able to implement a method – the D’Hondt method for the mathematically inclined – that has matched the known allocations I’ve tested it against. It’s worth emphasising that without an official statement I can’t be 100% certain this is the correct method, but it fits the test cases so far.
I’ve made a Google Sheet implementation of this available here (if you want to play with it you’ll need to download or make a copy). If you’re curious the previous method is also available as a Google sheet here.
Ironman Texas 2018
Changing the methodology used to allocate slots also changes their distribution across age groups. D’Hondt favours bigger age groups a little more and smaller age groups a little less. Ironman Texas, one of my test cases where the official slot allocation is known, offers a good example of this.
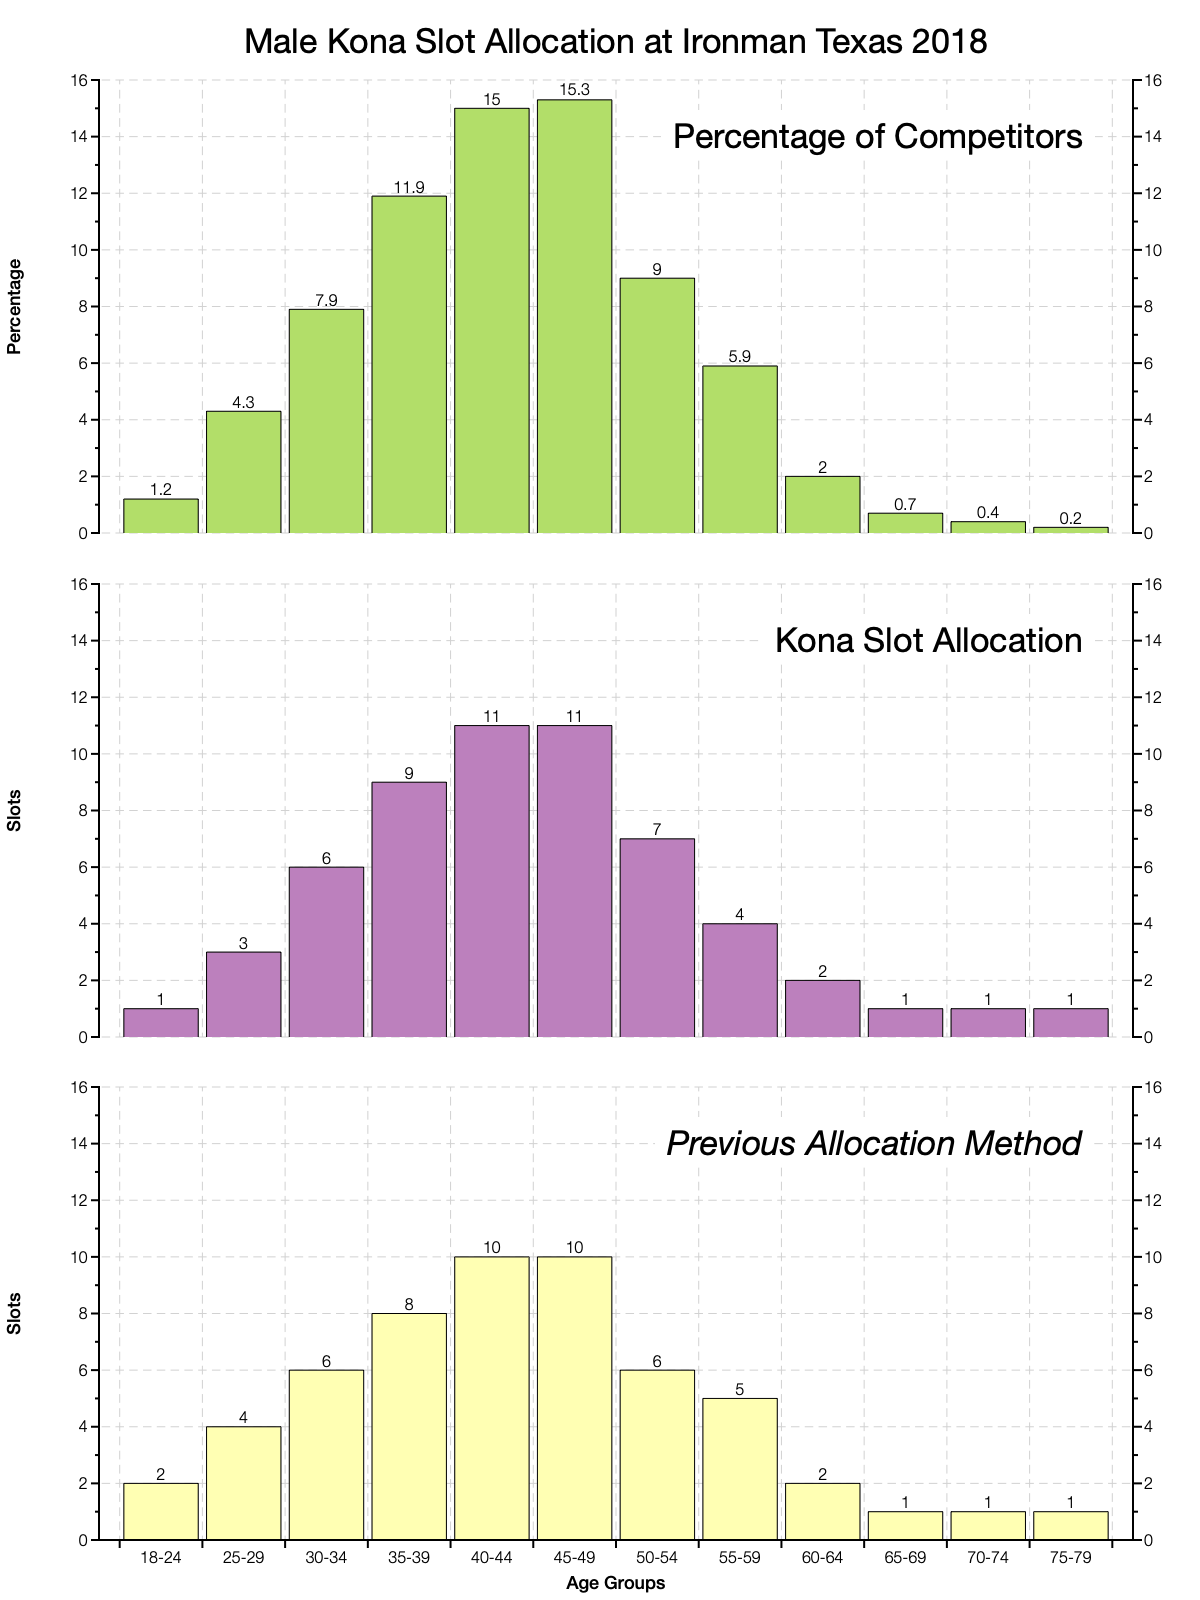
The charts above show the distribution of competitors across the male age groups at Texas. Below that is the slot allocation using the new method – this is also the allocation published on race day. Finally there’s the allocation as calculated by the previous method. For the larger male age groups we see a small boost in slot numbers.
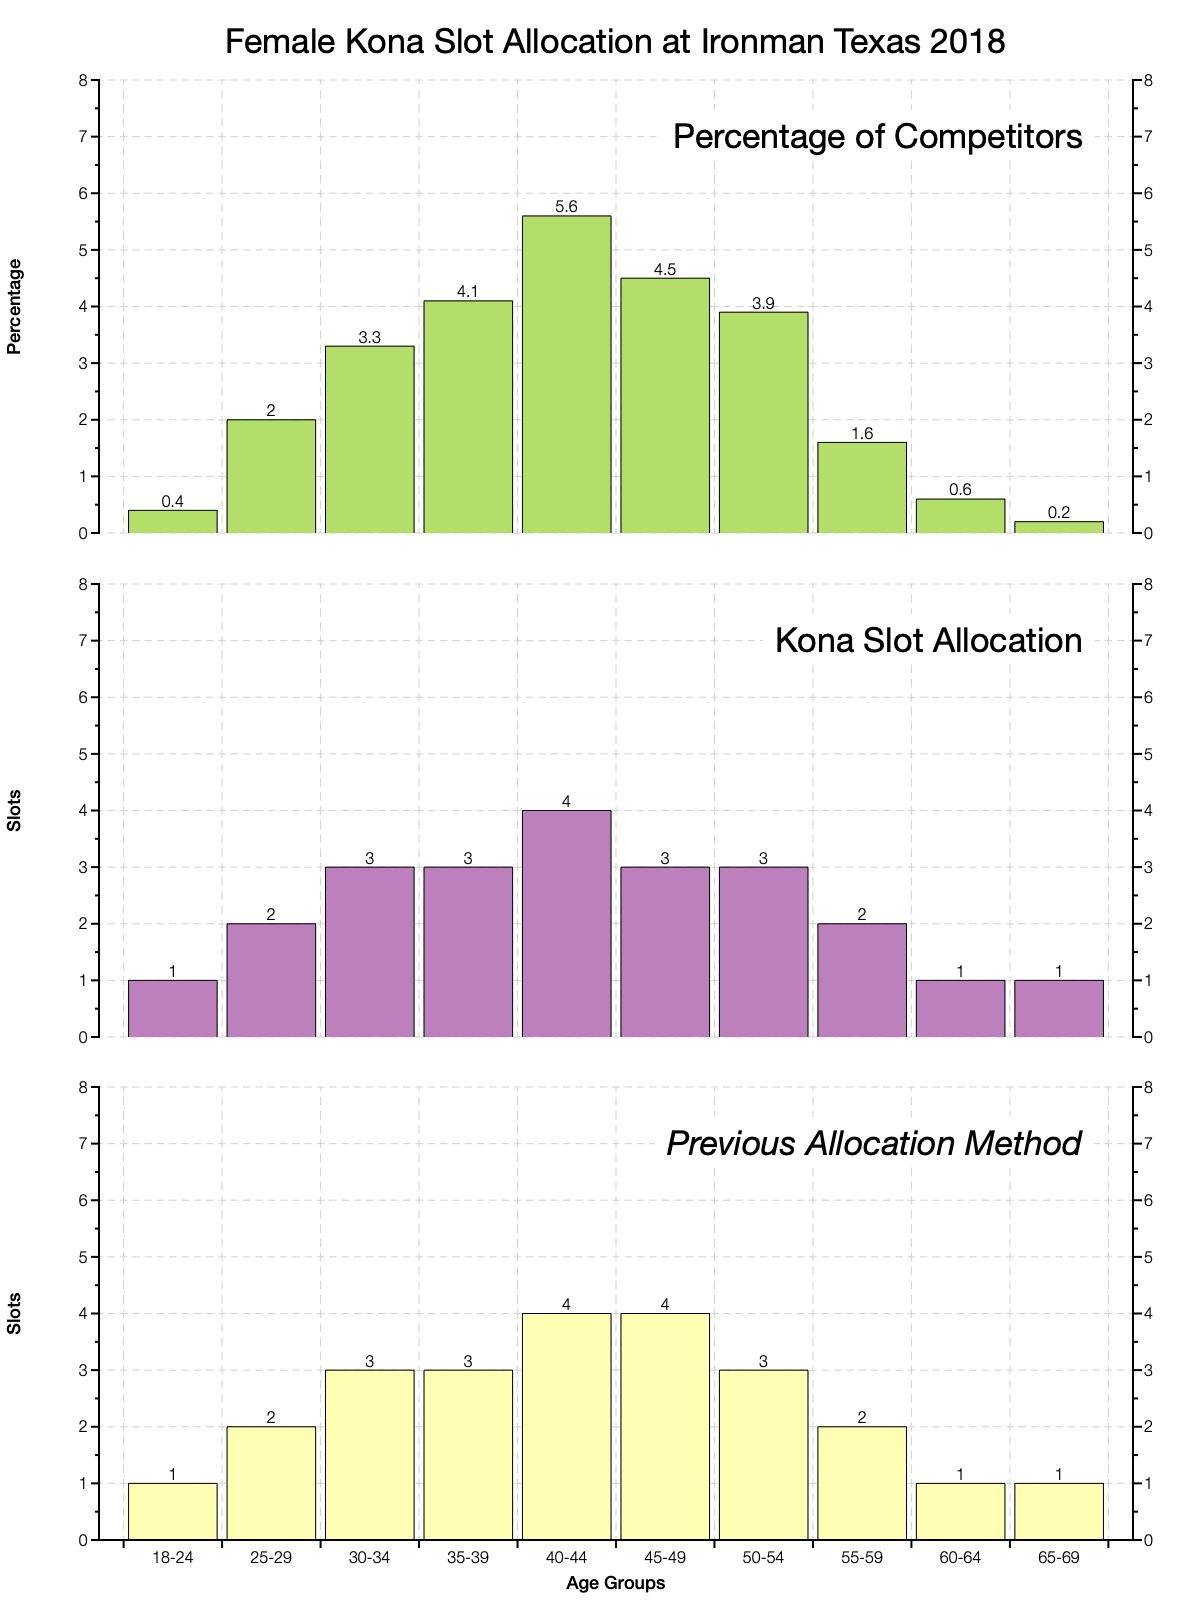
Women make up a smaller percentage of the field, roughly 26% in Texas, and so get fewer slots. Ironman Texas is a championship race with 80 slots and women make up a larger proportion of the field in North American events. Elsewhere, with fewer women racing and 40 slot events you can expect to see most female age groups receive the 1 slot minimum.
| Athlete Count | Athlete Percentage | Slot Allocation | Previous Allocation | |
|---|---|---|---|---|
| F18-24 | 10 | 0.4 | 1 | 1 |
| F25-29 | 49 | 2 | 2 | 2 |
| F30-34 | 83 | 3.3 | 3 | 3 |
| F35-39 | 101 | 4.1 | 3 | 3 |
| F40-44 | 139 | 5.6 | 4 | 4 |
| F45-49 | 112 | 4.5 | 3 | 4 |
| F50-54 | 98 | 3.9 | 3 | 3 |
| F55-59 | 39 | 1.6 | 2 | 2 |
| F60-64 | 15 | 0.6 | 1 | 1 |
| F65-69 | 4 | 0.2 | 1 | 1 |
| M18-24 | 30 | 1.2 | 1 | 2 |
| M25-29 | 107 | 4.3 | 3 | 4 |
| M30-34 | 198 | 7.9 | 6 | 6 |
| M35-39 | 297 | 11.9 | 9 | 8 |
| M40-44 | 375 | 15 | 11 | 10 |
| M45-49 | 382 | 15.3 | 11 | 10 |
| M50-54 | 224 | 9 | 7 | 6 |
| M55-59 | 148 | 5.9 | 4 | 5 |
| M60-64 | 51 | 2 | 2 | 2 |
| M65-69 | 18 | 0.7 | 1 | 1 |
| M70-74 | 9 | 0.4 | 1 | 1 |
| M75-79 | 4 | 0.2 | 1 | 1 |
| Total | 2493 | 80 | 80 |
The table above shows the full data for the two charts. The impact of this new method on the allocation in Texas is relatively small. It’s one slot gained here or lost there. For those looking to qualify it does mean that if you’re in a smaller age group there is less chance of you receiving much more than the default slot. This is especially the case at lower slot races.
Typical Age Group Allocations
Athlete numbers vary across races, but within given regions the distribution of age groups doesn’t vary that much. That means that there shouldn’t be much difference in the allocation of slots at these events either. In effect I can use the entry numbers from races in a given region to create a rough guideline to the allocations they’ll receive.
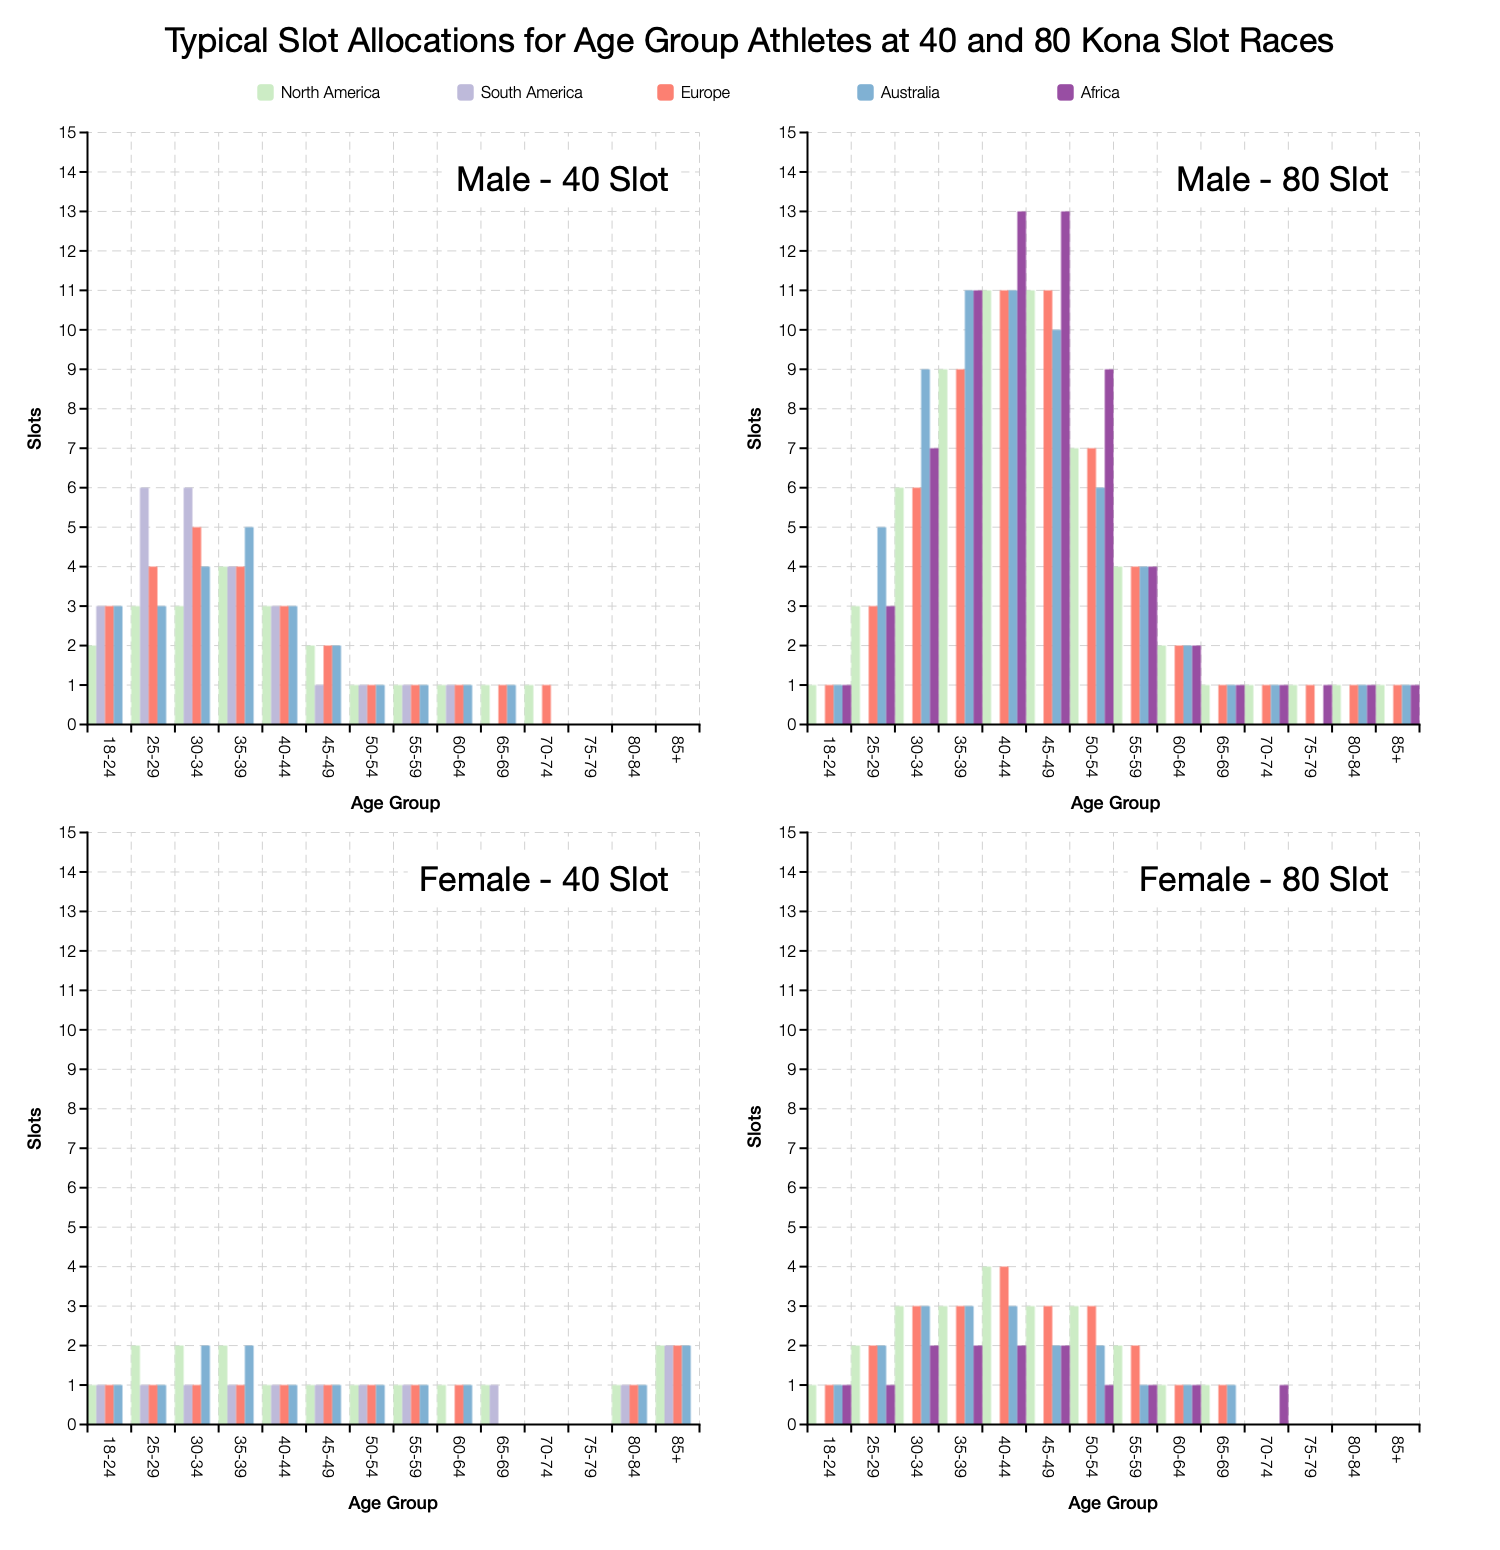
The above charts plot the typical number of slots for male and female age groups across Ironman regions. I’ve restricted this to 40 and 80 slot races as they’re the most common kind. Unfortunately that excludes Asian races which have tended to have different slot allocations.
| North America | South America | Europe | Australia | |
|---|---|---|---|---|
| F18-24 | 1 | 1 | 1 | 1 |
| F25-29 | 1 | 1 | 1 | 1 |
| F30-34 | 1 | 1 | 1 | 1 |
| F35-39 | 2 | 1 | 1 | 1 |
| F40-44 | 2 | 1 | 1 | 2 |
| F45-49 | 2 | 1 | 1 | 2 |
| F50-54 | 1 | 1 | 1 | 1 |
| F55-59 | 1 | 1 | 1 | 1 |
| F60-64 | 1 | 1 | 1 | 1 |
| F65-69 | 1 | 1 | 1 | 1 |
| F70-74 | 1 | 1 | 1 | |
| F75-79 | 1 | 1 | ||
| M18-24 | 1 | 1 | 1 | 1 |
| M25-29 | 2 | 2 | 2 | 2 |
| M30-34 | 2 | 3 | 3 | 3 |
| M35-39 | 3 | 6 | 4 | 3 |
| M40-44 | 3 | 6 | 5 | 4 |
| M45-49 | 4 | 4 | 4 | 5 |
| M50-54 | 3 | 3 | 3 | 3 |
| M55-59 | 2 | 1 | 2 | 2 |
| M60-64 | 1 | 1 | 1 | 1 |
| M65-69 | 1 | 1 | 1 | 1 |
| M70-74 | 1 | 1 | 1 | 1 |
| M75-79 | 1 | 1 | 1 | |
| M80-84 | 1 | 1 |
At a 40 slot race most female age groups will only see 1 Kona slot. In some instances there might be 2 slots for a larger division, usually in the US or Australia where women make up a bigger proportion of the field. Male age groups range from 1 slot up to 6 slots normally. South American and European races see the peak of 5 or 6 slots in the M40-44 category, but for North America and Australia the higher proportion of women athletes makes the male allocation slightly lower.
| North America | Europe | Africa | Australia | |
|---|---|---|---|---|
| F18-24 | 1 | 1 | 1 | 1 |
| F25-29 | 2 | 1 | 2 | 2 |
| F30-34 | 3 | 2 | 3 | 3 |
| F35-39 | 3 | 2 | 3 | 3 |
| F40-44 | 4 | 2 | 3 | 3 |
| F45-49 | 3 | 2 | 2 | 2 |
| F50-54 | 3 | 1 | 2 | 2 |
| F55-59 | 2 | 1 | 1 | 1 |
| F60-64 | 1 | 1 | 1 | 1 |
| F65-69 | 1 | 1 | 1 | |
| F70-74 | 1 | |||
| M18-24 | 1 | 1 | 1 | 1 |
| M25-29 | 3 | 3 | 5 | 3 |
| M30-34 | 6 | 7 | 9 | 7 |
| M35-39 | 9 | 11 | 11 | 10 |
| M40-44 | 11 | 13 | 11 | 11 |
| M45-49 | 11 | 13 | 10 | 10 |
| M50-54 | 7 | 9 | 6 | 8 |
| M55-59 | 4 | 4 | 4 | 4 |
| M60-64 | 2 | 2 | 2 | 2 |
| M65-69 | 1 | 1 | 1 | 2 |
| M70-74 | 1 | 1 | 1 | 1 |
| M75-79 | 1 | 1 | 1 | |
| M80-84 | 1 |
The data for 80 slot races follows the same pattern as for 40. Here though numbers are higher and more female age groups see 2-3 Kona slots on offer. Male age group peak at 13 slots in the M40-44 category. Again this is regional with the greater proportion of men racing in Europe and South America receiving the largest slot allocation.
It’s possible the allocation method will change again in the future. Right now it appears to follow the d’Hondt method which means I’m again able to make good estimates of Kona slots based on start lists. The shift from the previous method to the current one has slightly increased the slots given to the biggest age groups and limited those given to the smallest.
