If anyone entered Staffordshire 70.3 specifically because it promised a fast, flat course in contrast to Wimbleball they were probably a little disappointed on Sunday. It is faster than Wimbleball, most 70.3 races are, but if the inaugural event is a fair example of the course it’s not that much faster. Flat doesn’t necessarily mean fast.
There’s never much to analyse with results from a first year race, but for interest I’ve compared Staffordshire’s times against those from 9 years of racing in Wimbleball.
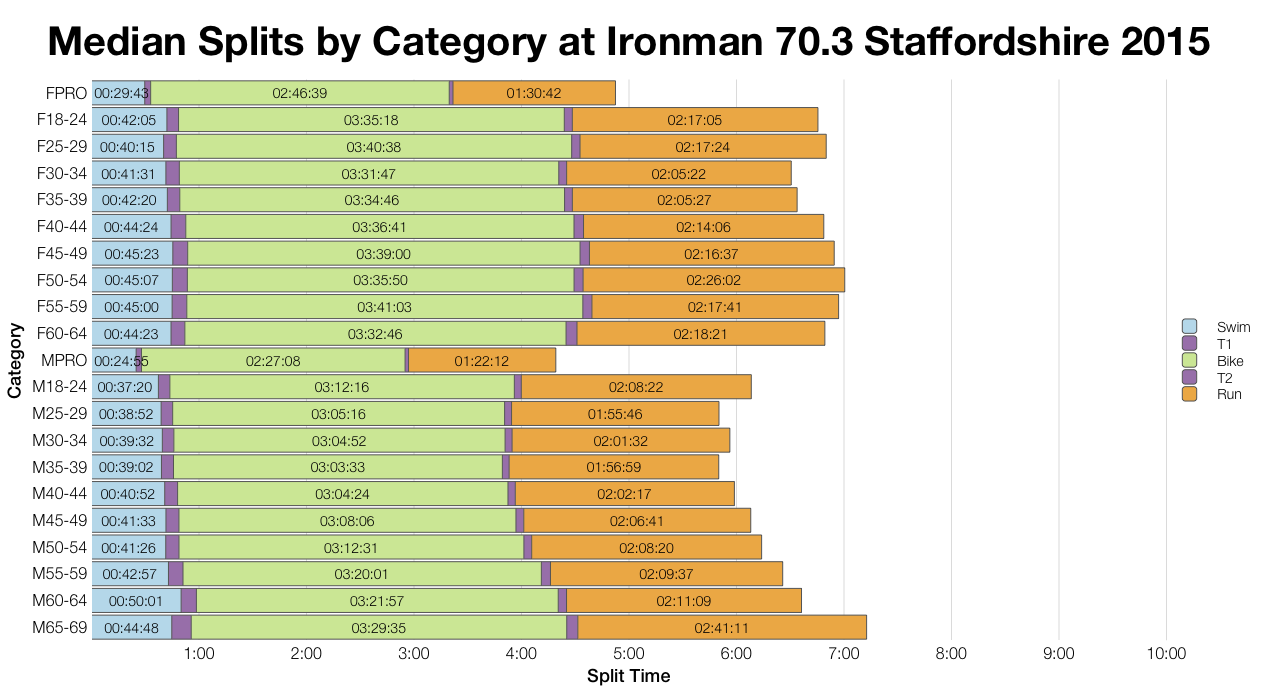
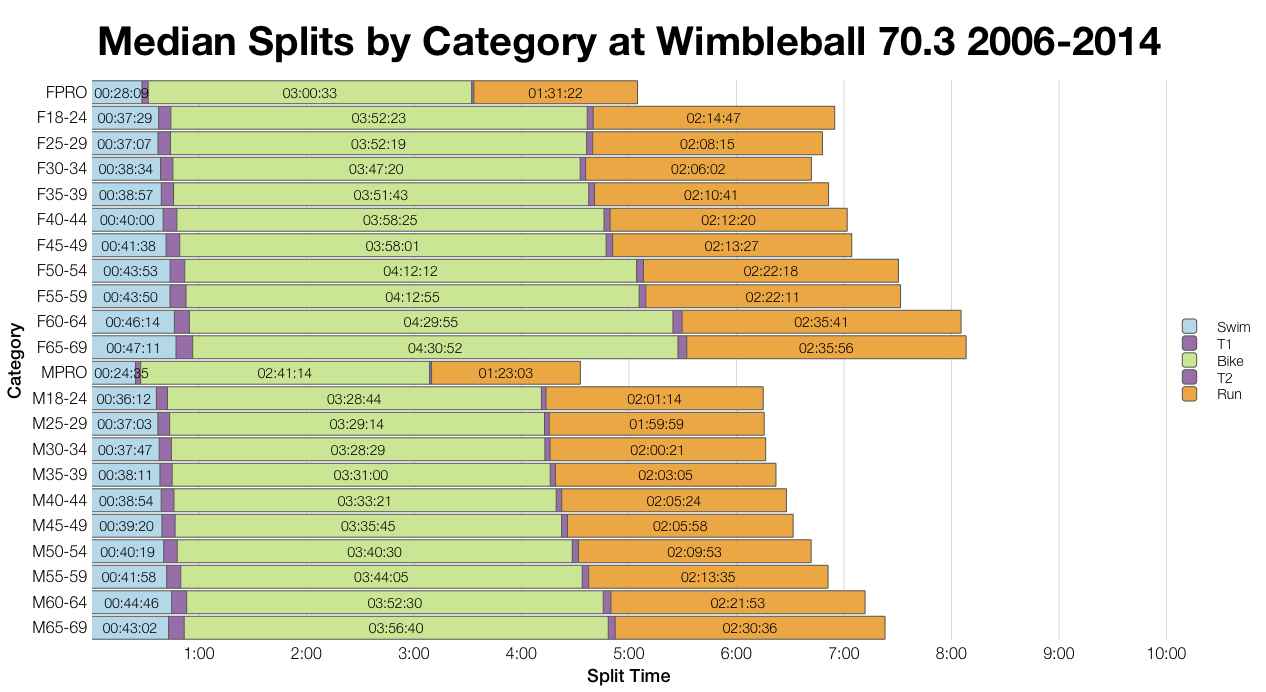
Both the median charts use the same scale so a quick visual check shows that age group medians at Staffordshire generally turn out faster than those from 9 years of Wimbleball. The real difference is in the bike which is unsurprisingly faster on the new course. Run doesn’t vary that much so it’s more notable that swim splits from Staffordshire come out a little slower. I’ve not yet studied enough of my athletes’ data to have a better picture on this, but reports have mentioned a lack of buoys and a run to the timing mat; they may be factors.
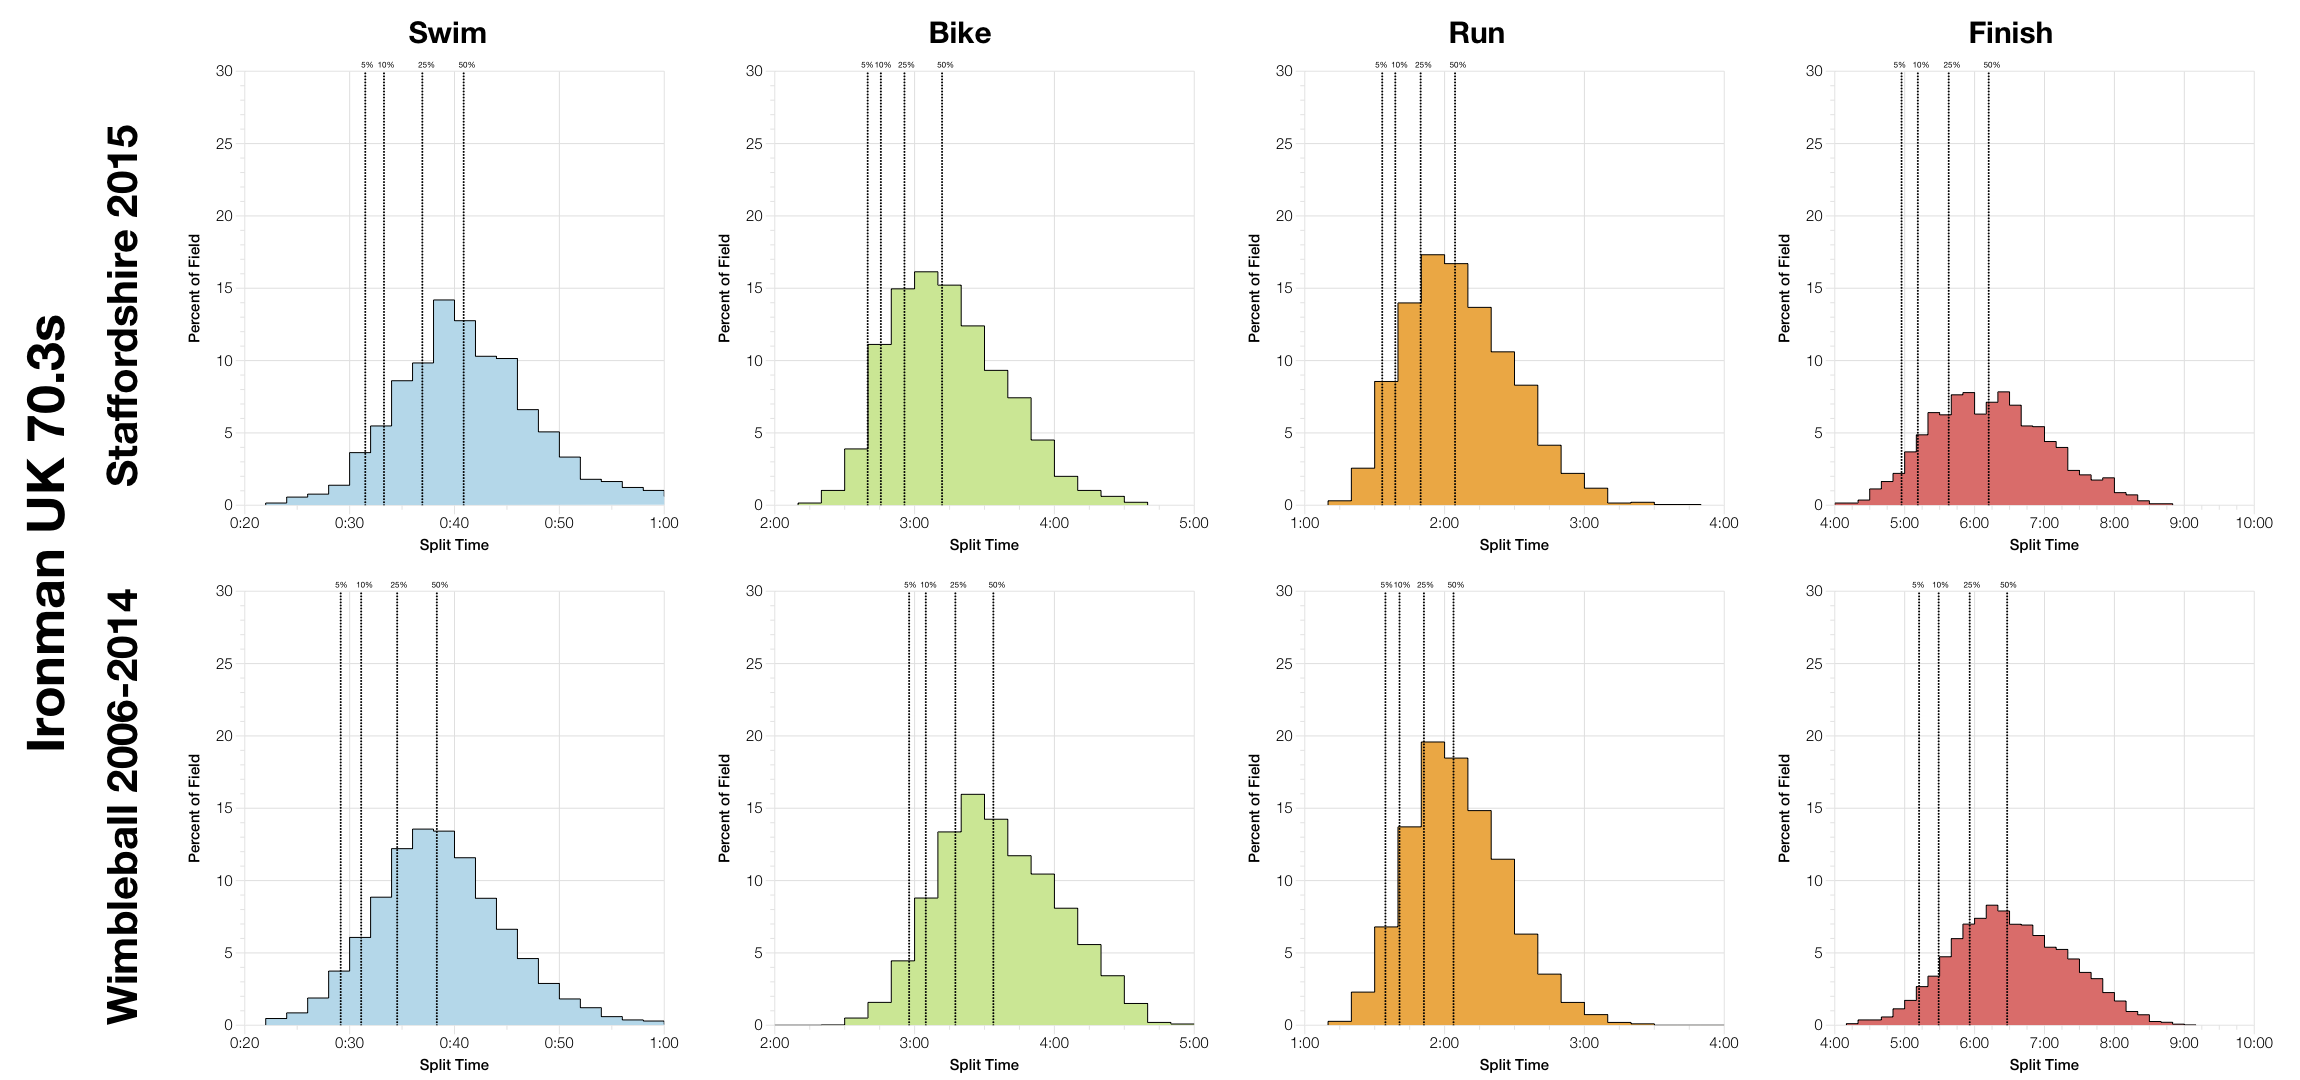
This comparison is much clearer when we look at split distributions. In these graphs the difference in swim times becomes more evident as does the opposite shift in bike times and relative similarity in run splits. While some time was lost to the swim more was gained on the bike and with a neutral run the overall result is a faster race in Staffordshire. Still, it’s only a matter of around 15 minutes when looking at the median point which in comparison to Wimbleball hardly makes this race qualify as fast.
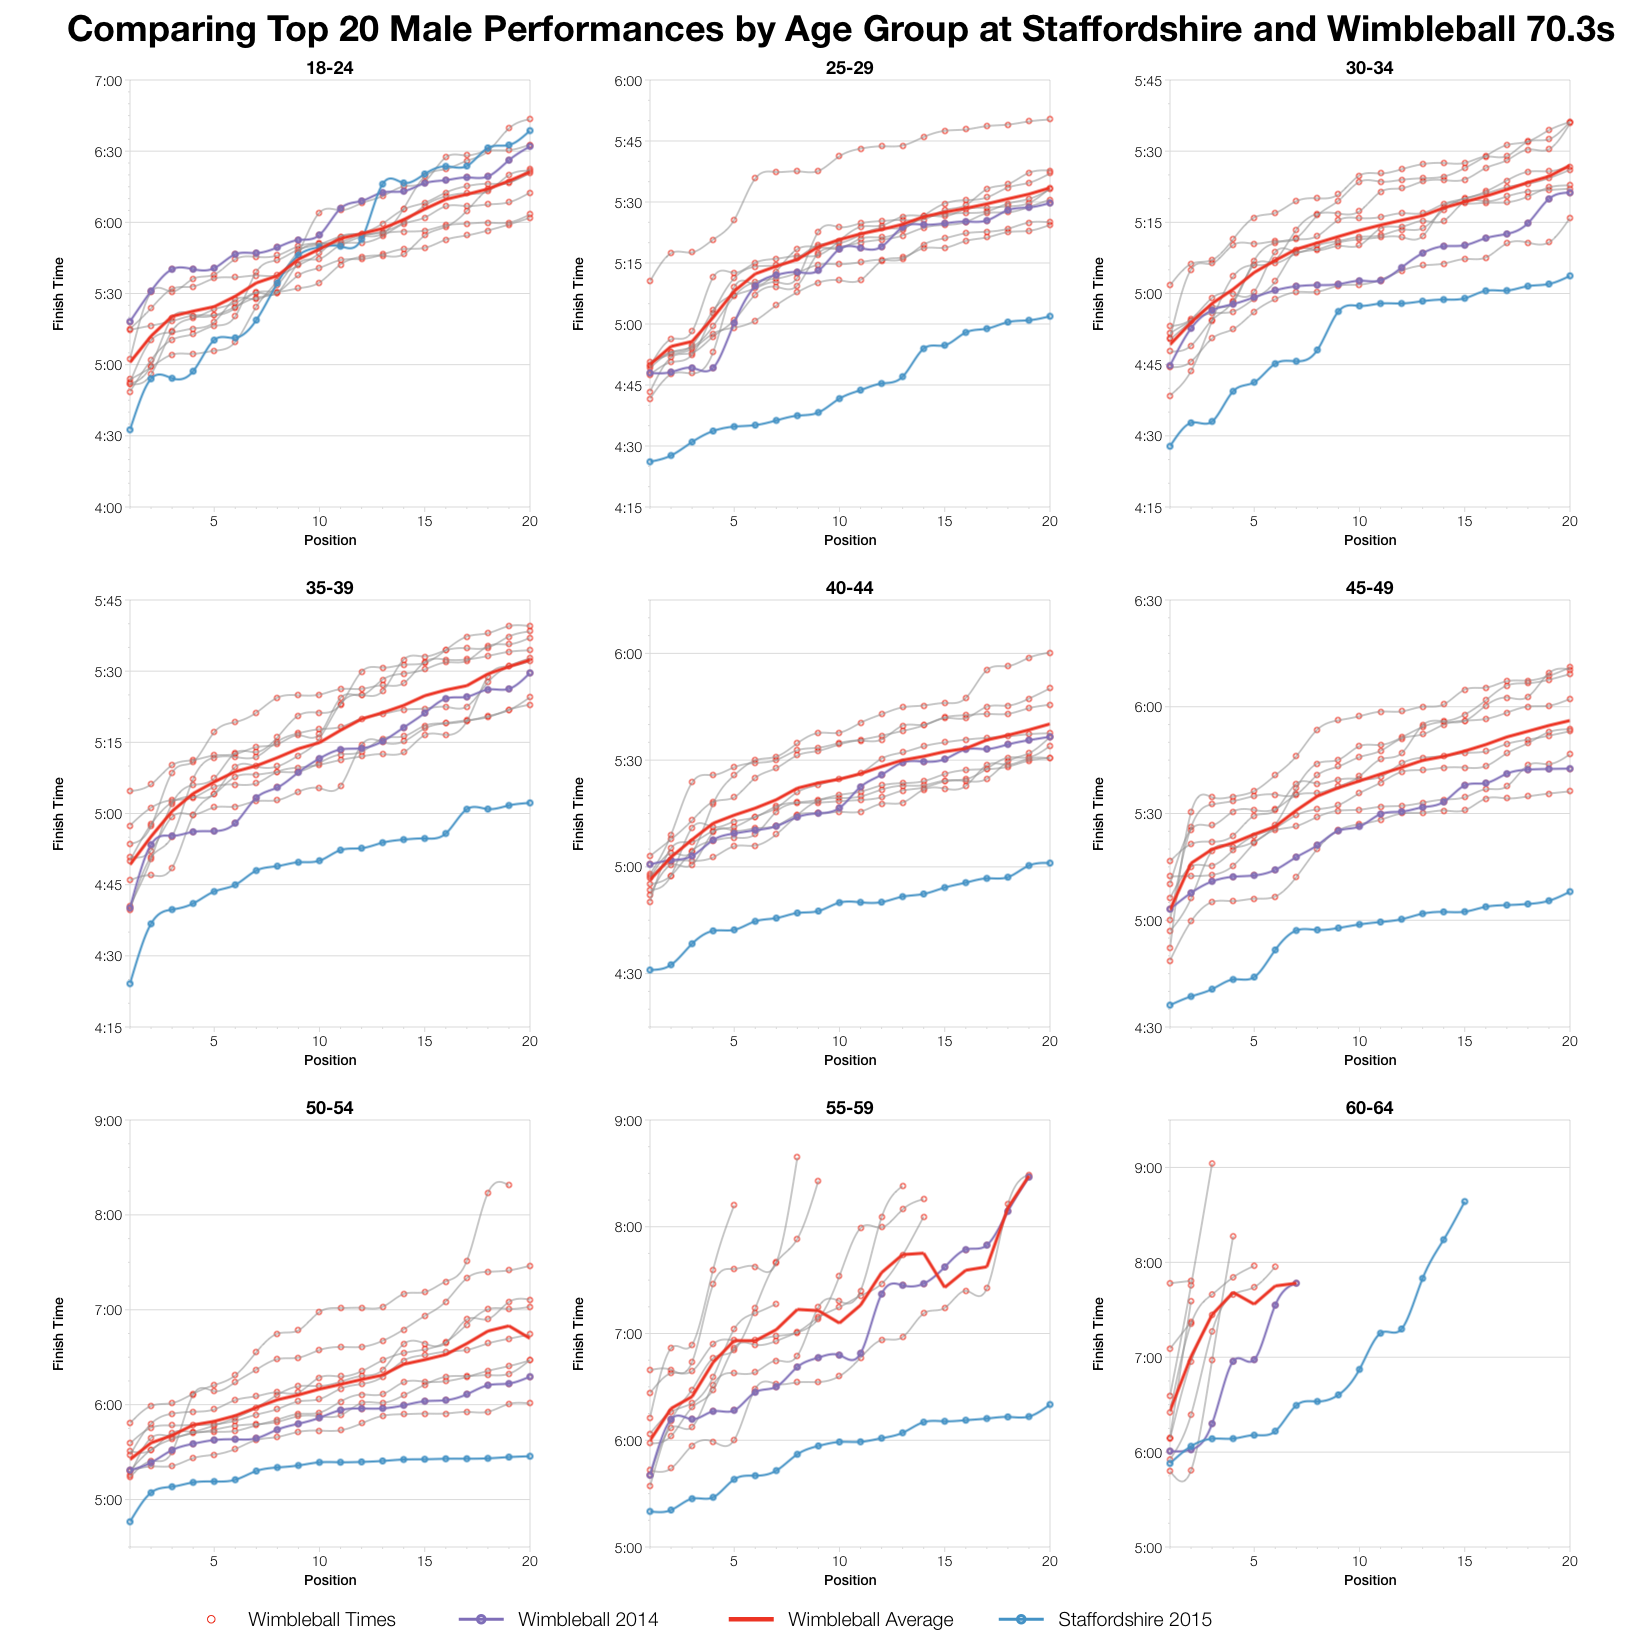
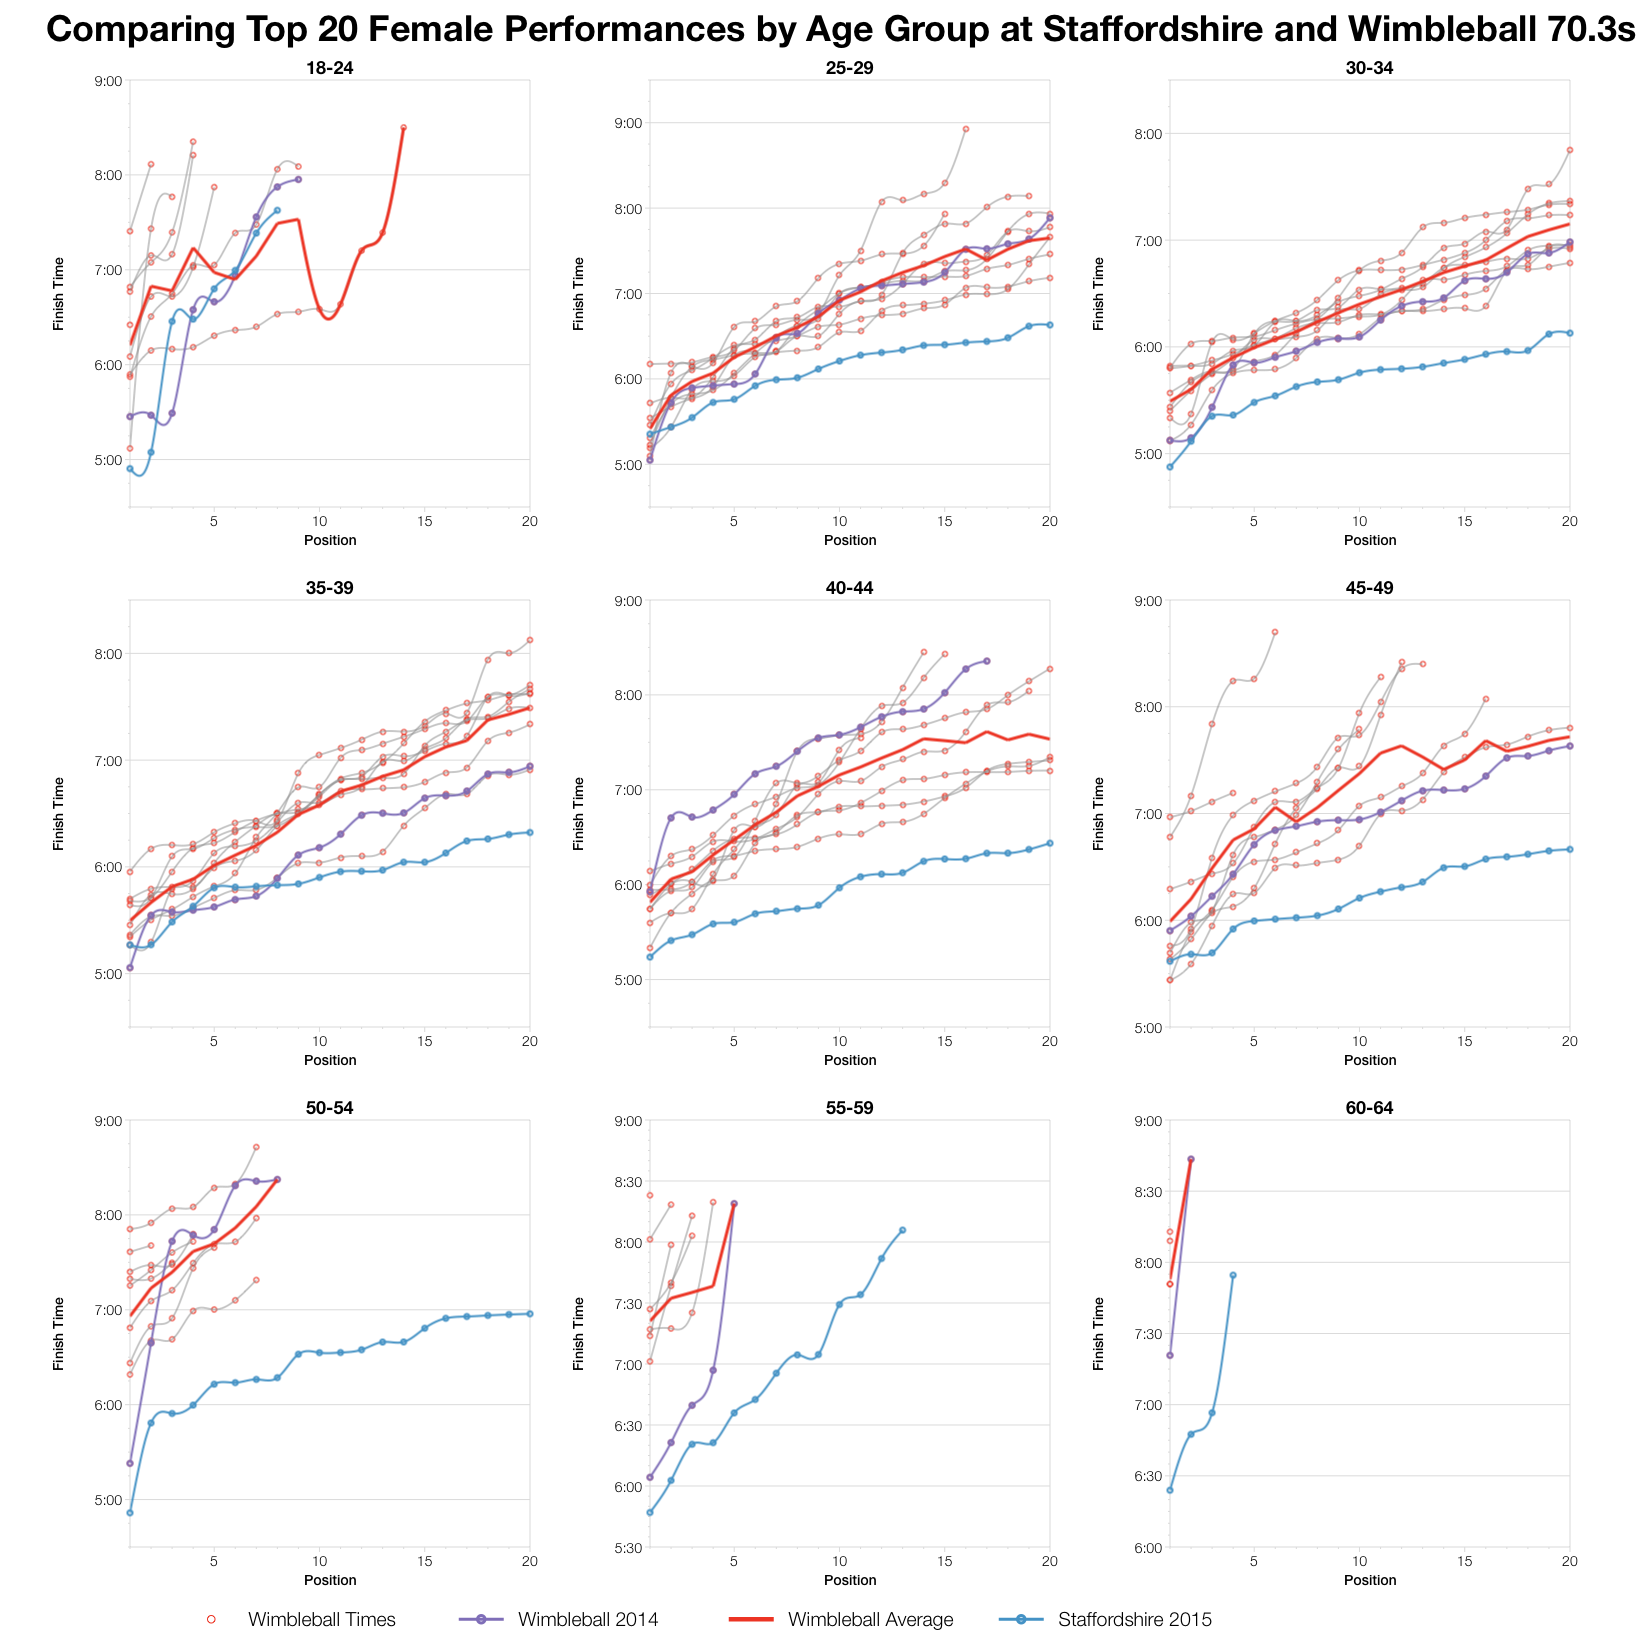
Final part of this comparison – performance among the top 20 of each age group. We have the finish time from Staffordshire in blue, then in purple last year’s Wimbleball results plus in red all previous Wimbleball results and the average splits for each position. For all that detail the conclusion is pretty simple – Staffordshire is faster. In most age groups times for the top 20 are comfortably ahead of their counterparts in Wimbleball. Not in every age group of course, but this is as close to universal as I’ve seen in these charts.
I should note that when looking at a single year of results there is no way to tell if they are fast, slow or average for the course. Staffordshire may prove to be faster than it first appears as subsequent years go by. It is faster than Wimbleball, I don’t doubt that, but if quick times are your goal there are faster 70.3 courses out there too. For everyone else it offers another branded option in the UK and reports have generally been positive (logistics around transitions being the major exception there).
You can view a spreadsheet of all results and splits from Ironman 70.3 Staffordshire 2015 on my Google Drive.
