Ironman Austria 2018: Age Group Results and Kona Qualification

Latest statistics for Ironman Austria

It’s going to be a busy week of race analysis – I’ll open it with Ironman Austria. Austria is a long standing race, known for its fast course and competitive times. It draws a field of around 2,500 and offers the standard 40 Kona slots for the fastest age groupers. It’s always one of the fastest courses on the circuit, but times have varied with conditions over the years – hot years causing particular trouble for athletes.

Distribution of Finisher Splits at Ironman Austria 2018 Compared with 2008-2017

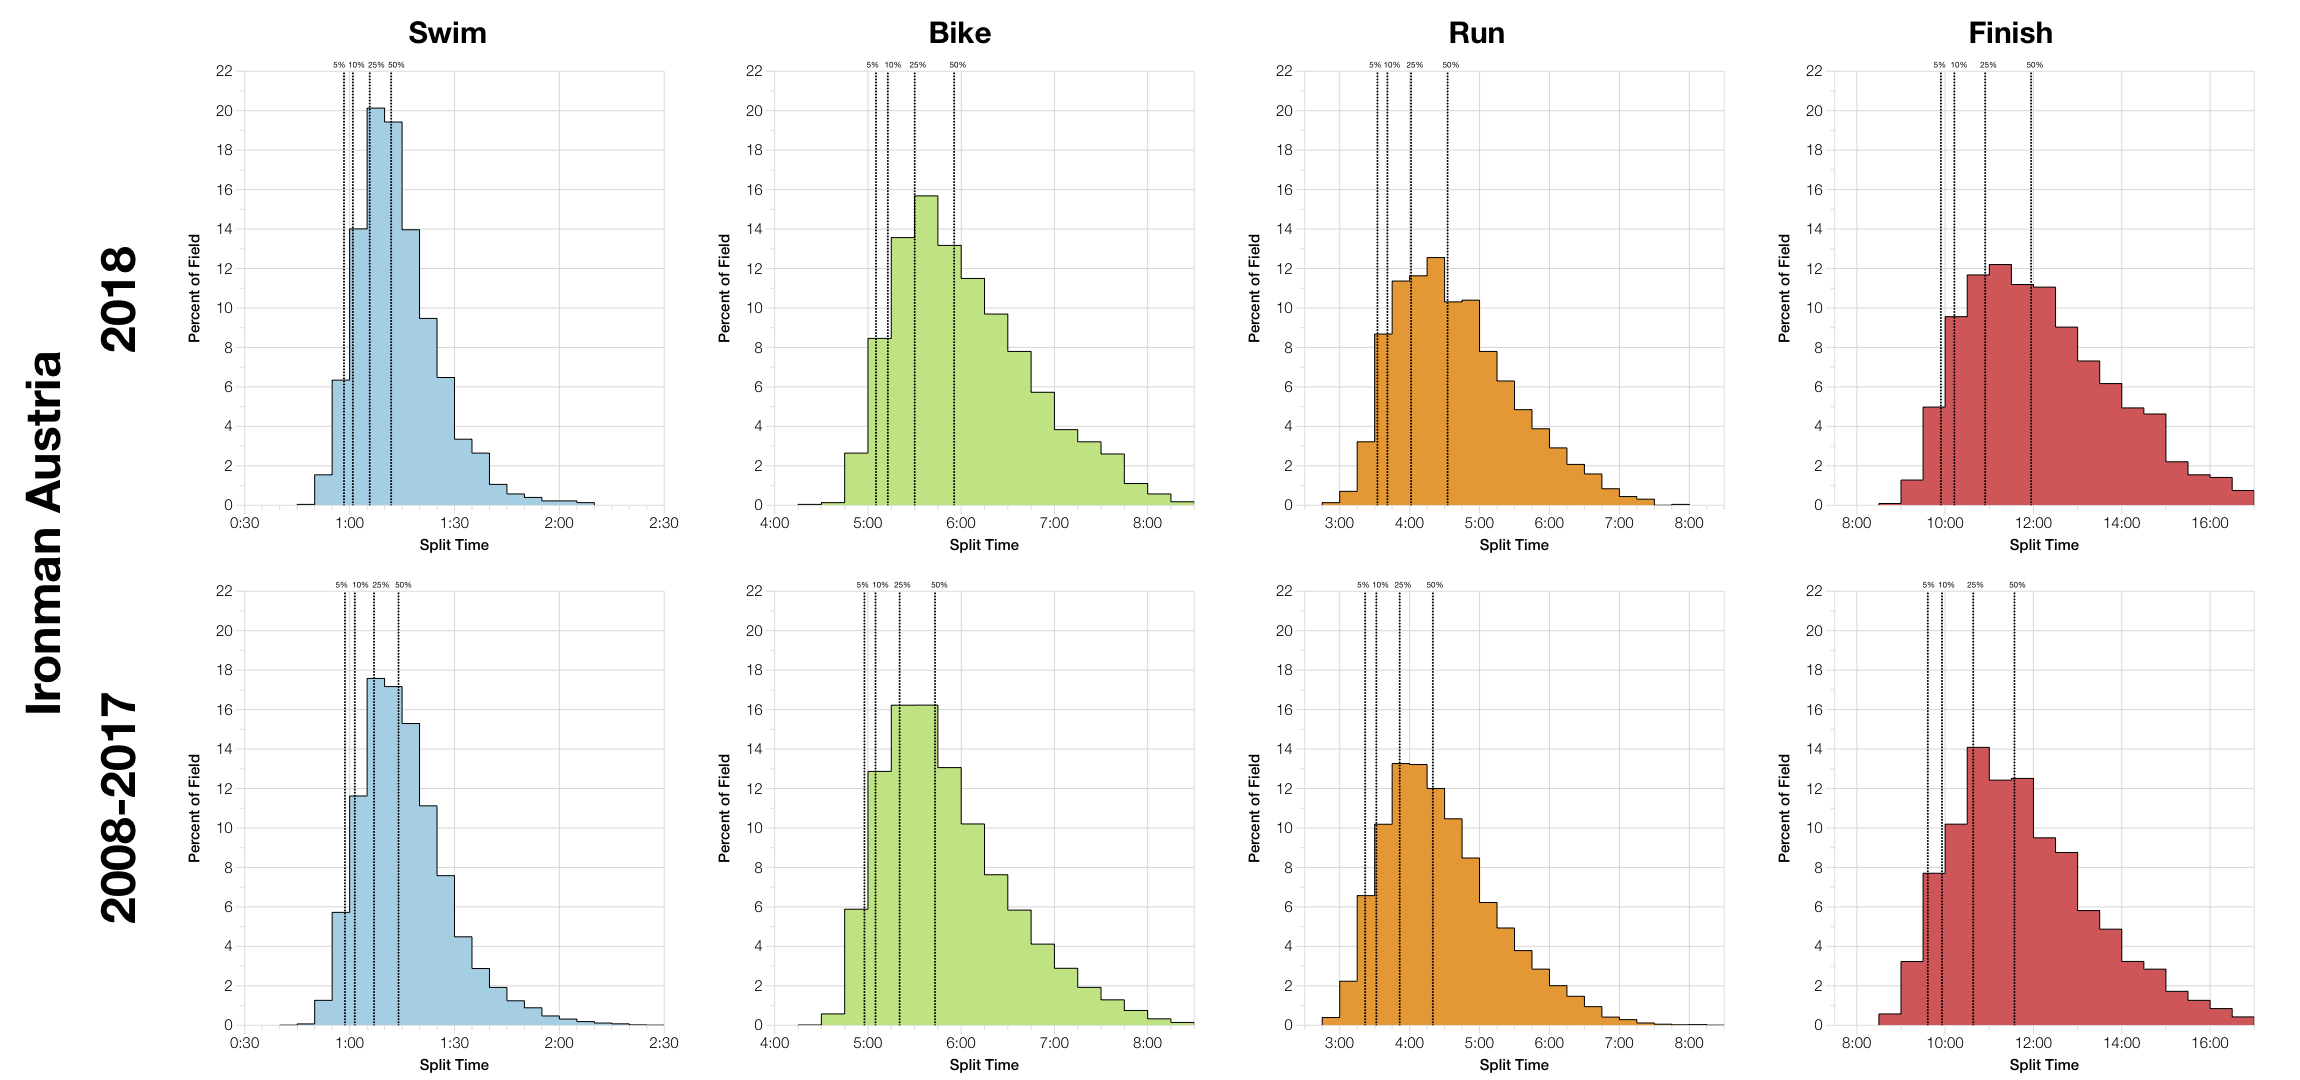
The first thing the distribution chart tells us is that this year was on the slower side for the course. Compared with the previous decade of results 2018 skews about 20 minutes slower at the median; this appears to come from a combination of slower bike and run. It’s also present across the field with the top 5% similarly slowed. The swim trends differently, with faster median times, but no change to front of pack times.

DNS and DNF Rates at Ironman Austria
Year
Listed Athletes
Swim Finish
Swim DNS/DNF
Bike Finish
Bike DNF
Run Finish
Run DNF
Overall DNS/DNF
2005
2157
1938
10.2%
1894
2.3%
1793
5.3%
16.8%
2006
2366
2079
12.1%
2138
2017
5.7%
14.6%
2007
2451
2131
13.1%
2148
2008
6.5%
18%
2008
2770
2318
16.3%
2388
2320
2.8%
16.1%
2009
2530
2155
14.8%
2202
2028
7.9%
19.7%
2010
2562
2169
15.3%
2165
0.2%
2046
5.5%
19.9%
2011
2781
2379
14.5%
2419
2346
3%
15.6%
2012
2361
2346
0.6%
2214
5.6%
2011
9.2%
14.8%
2013
2896
2617
9.6%
2578
1.5%
2498
3.1%
13.7%
2014
2916
2604
10.7%
2533
2.7%
2438
3.8%
16.4%
2015
2813
2495
11.3%
2418
3.1%
2333
3.5%
17%
2016
2869
2530
11.8%
2479
2%
2408
2.9%
16.1%
2017
2868
2595
9.5%
2532
2.4%
2462
2.8%
14.1%
2018
2499
2488
0.4%
2428
2.4%
2312
4.8%
7.5%

The main thing I’d pick out form the DNF data is that the run DNFs were higher this year. Not at the 2012 level – a particularly hot year as I recall, but a jump on the usual figures. Bike numbers look typical for the course and swim numbers are where I’d expect them. Of course, it’s important to remember that a lot of data from previous years mixes DNS and DNF which boosts their swim and overall percentages.

Median Splits by Age Group at Ironman Austria 2018
Median Splits by Age Group at Ironman Austria 2008-2017

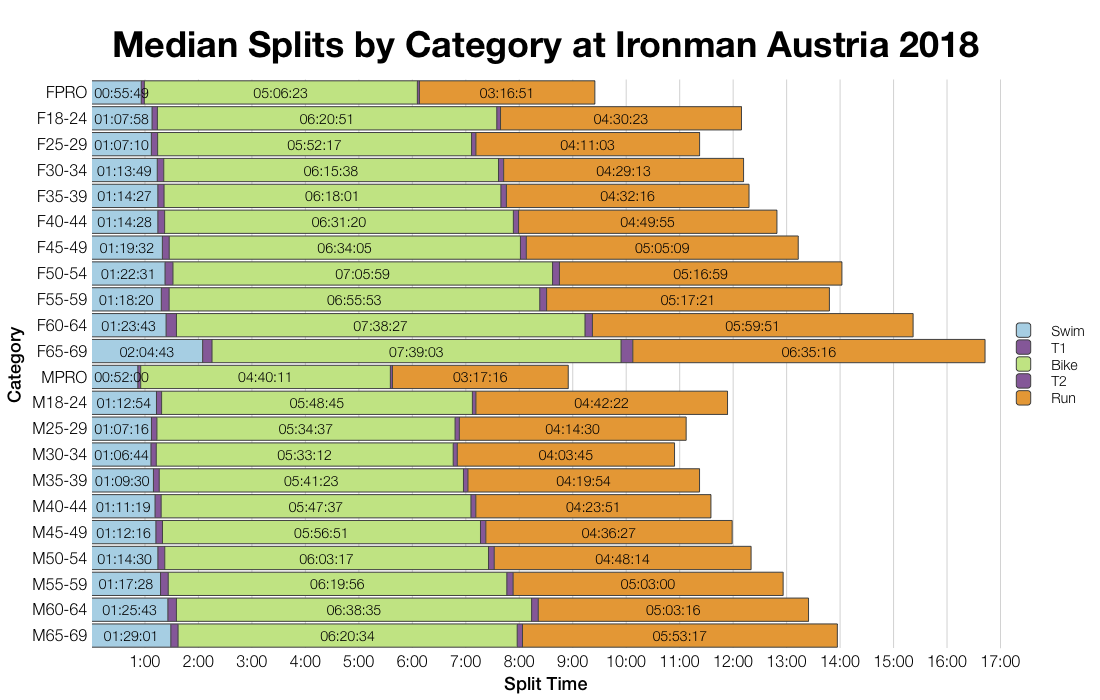
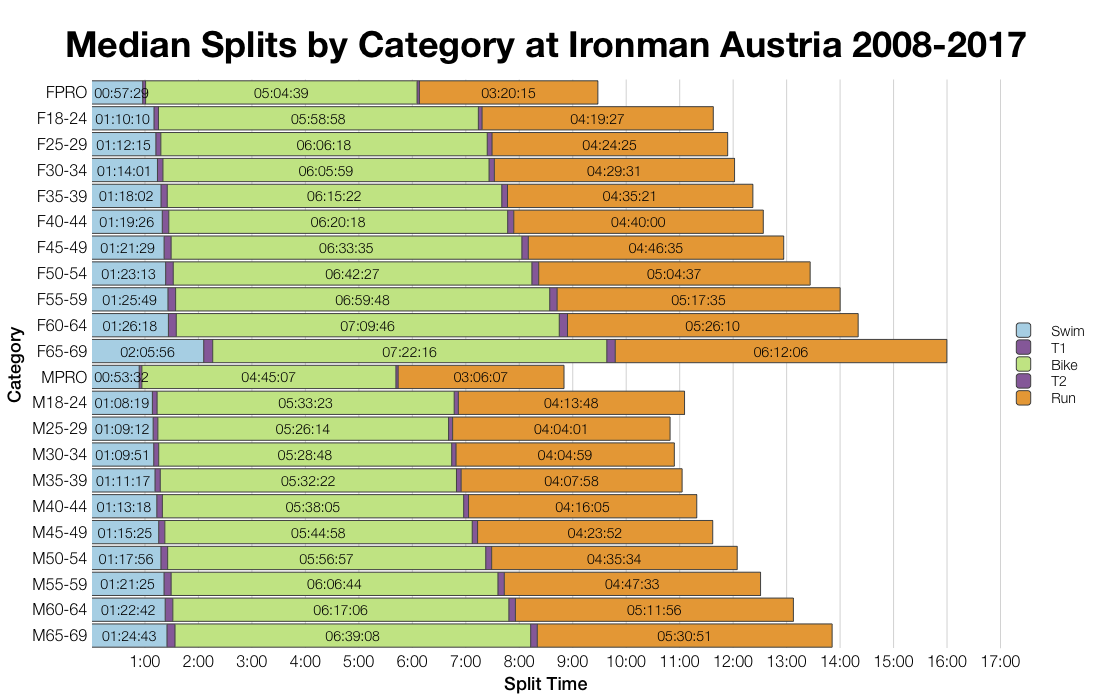
As you’d expect the age group medians follow the same trend as the distributions with slower times for bike and run this year which slightly faster for swim.

Top 10 Nationalities at Ironman Austria
Country
Count
Percentage
Austria
780
28.3
United Kingdom
326
11.8
Germany
252
9.1
Italy
208
7.5
Spain
174
6.3
Ireland
112
4.1
France
81
2.9
Israel
75
2.7
Belgium
68
2.5
United States
64
2.3
Ironman Austria 2018 Predicted Kona Qualifiers by Country
Country
Percentage of Slots
Percentage of Field
Austria
30.0
28.3
Germany
12.5
9.1
Italy
12.5
7.5
Switzerland
7.5
1.4
United Kingdom
5.0
11.8
Canada
5.0
0.4
Spain
5.0
6.3
Belgium
2.5
2.5
Sweden
2.5
0.9
United States
2.5
2.3
Slovenia
2.5
1.1
Portugal
2.5
0.3
Russia
2.5
0.8
Denmark
2.5
0.7
Czech Republic
2.5
2.1
Finland
2.5
0.1

Austria is a well established race that draws wide field form Europe and beyond. The slots get divided amongst those nationalities with Austria taking places proportional to their numbers.

Changes in Male Finishing Times by Position at Ironman Austria
Changes in Female Finishing Times by Position at Ironman Austria

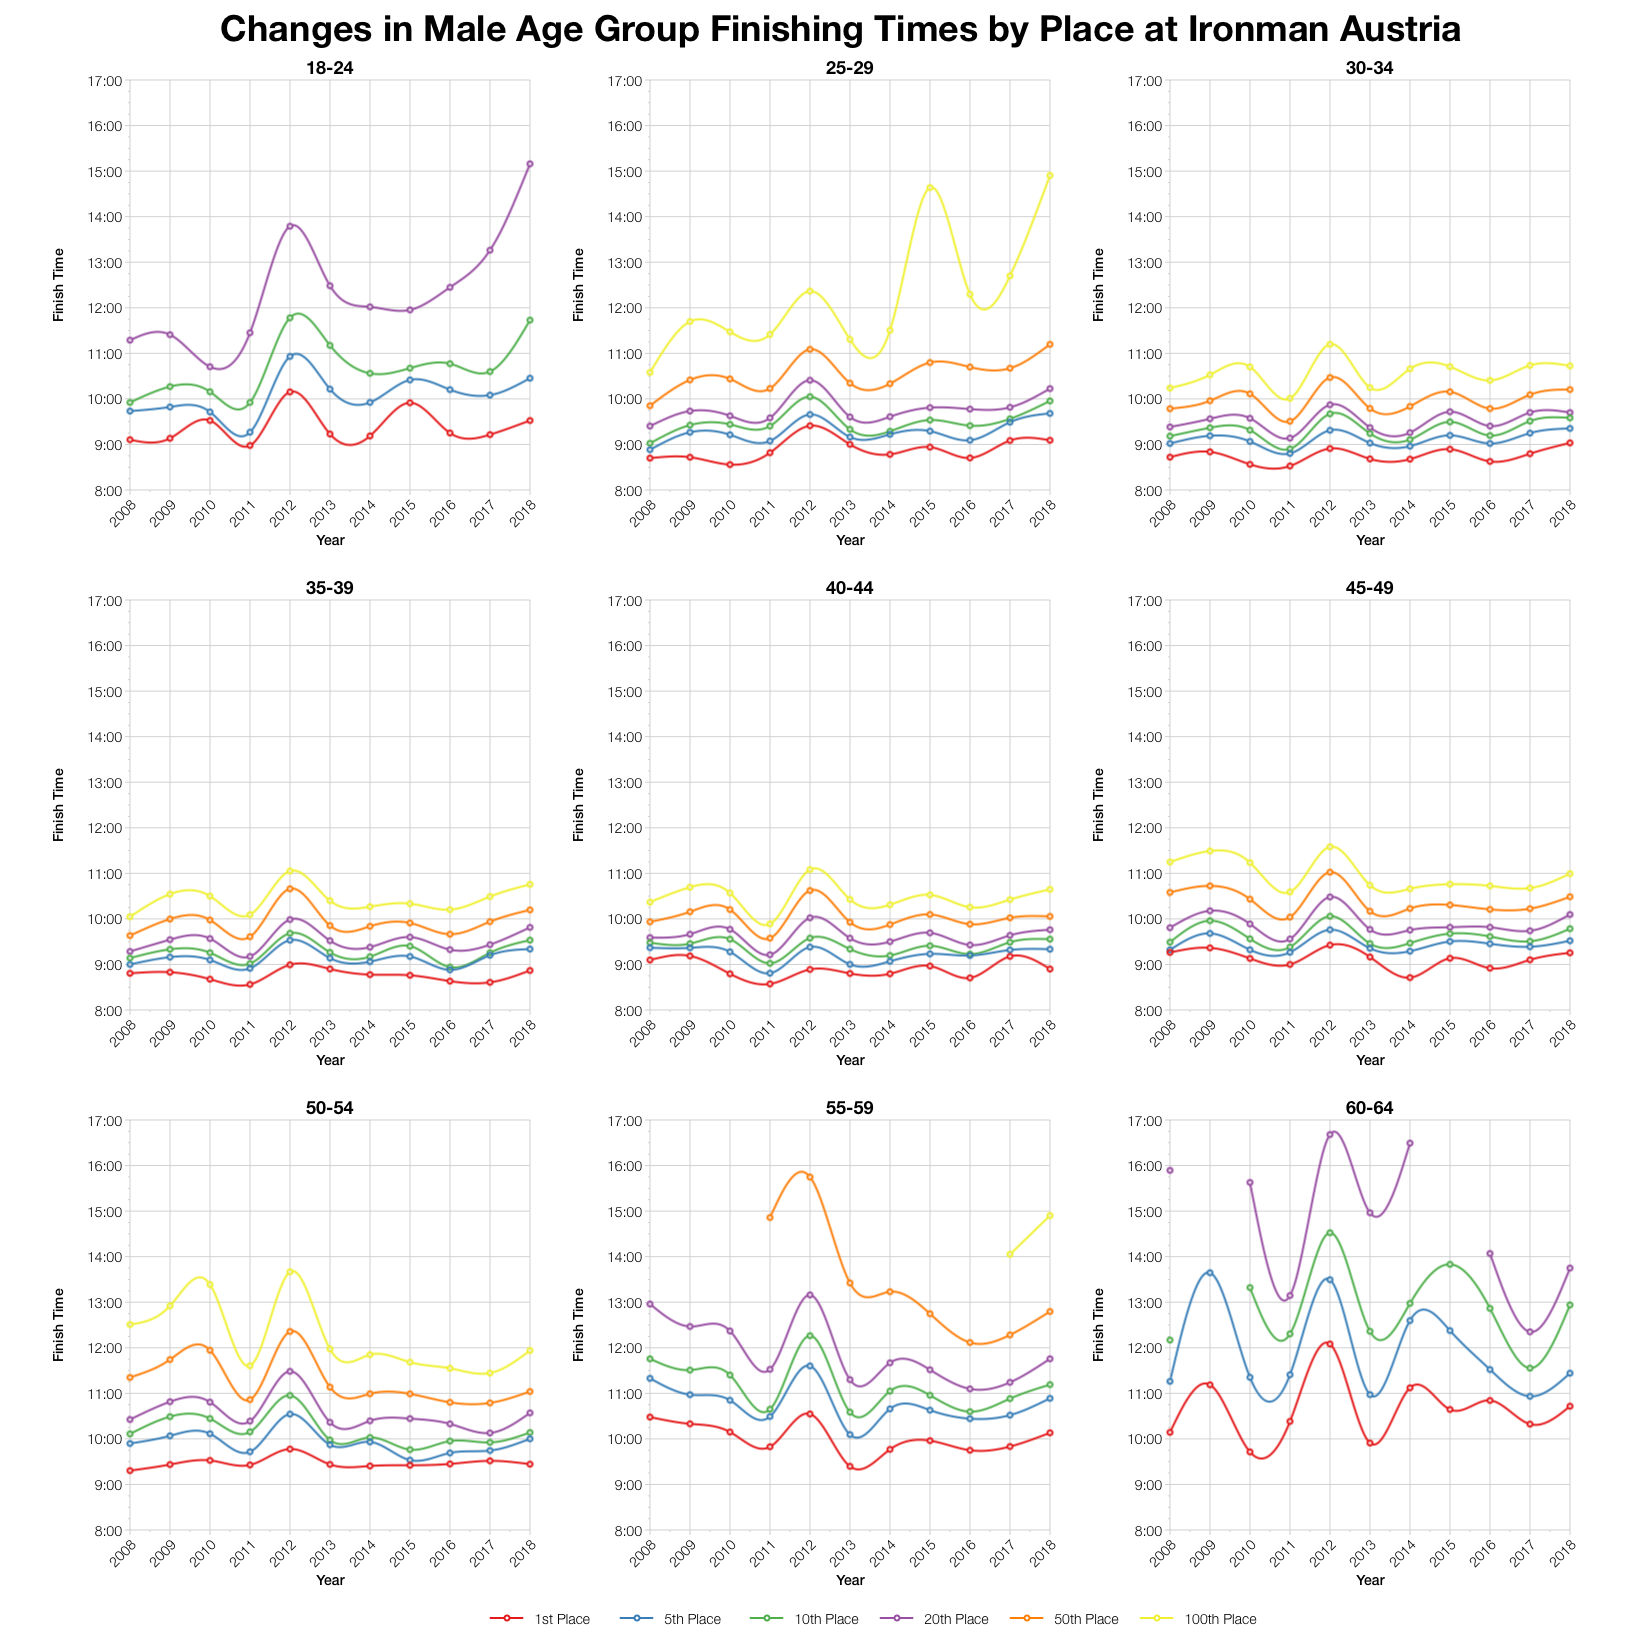
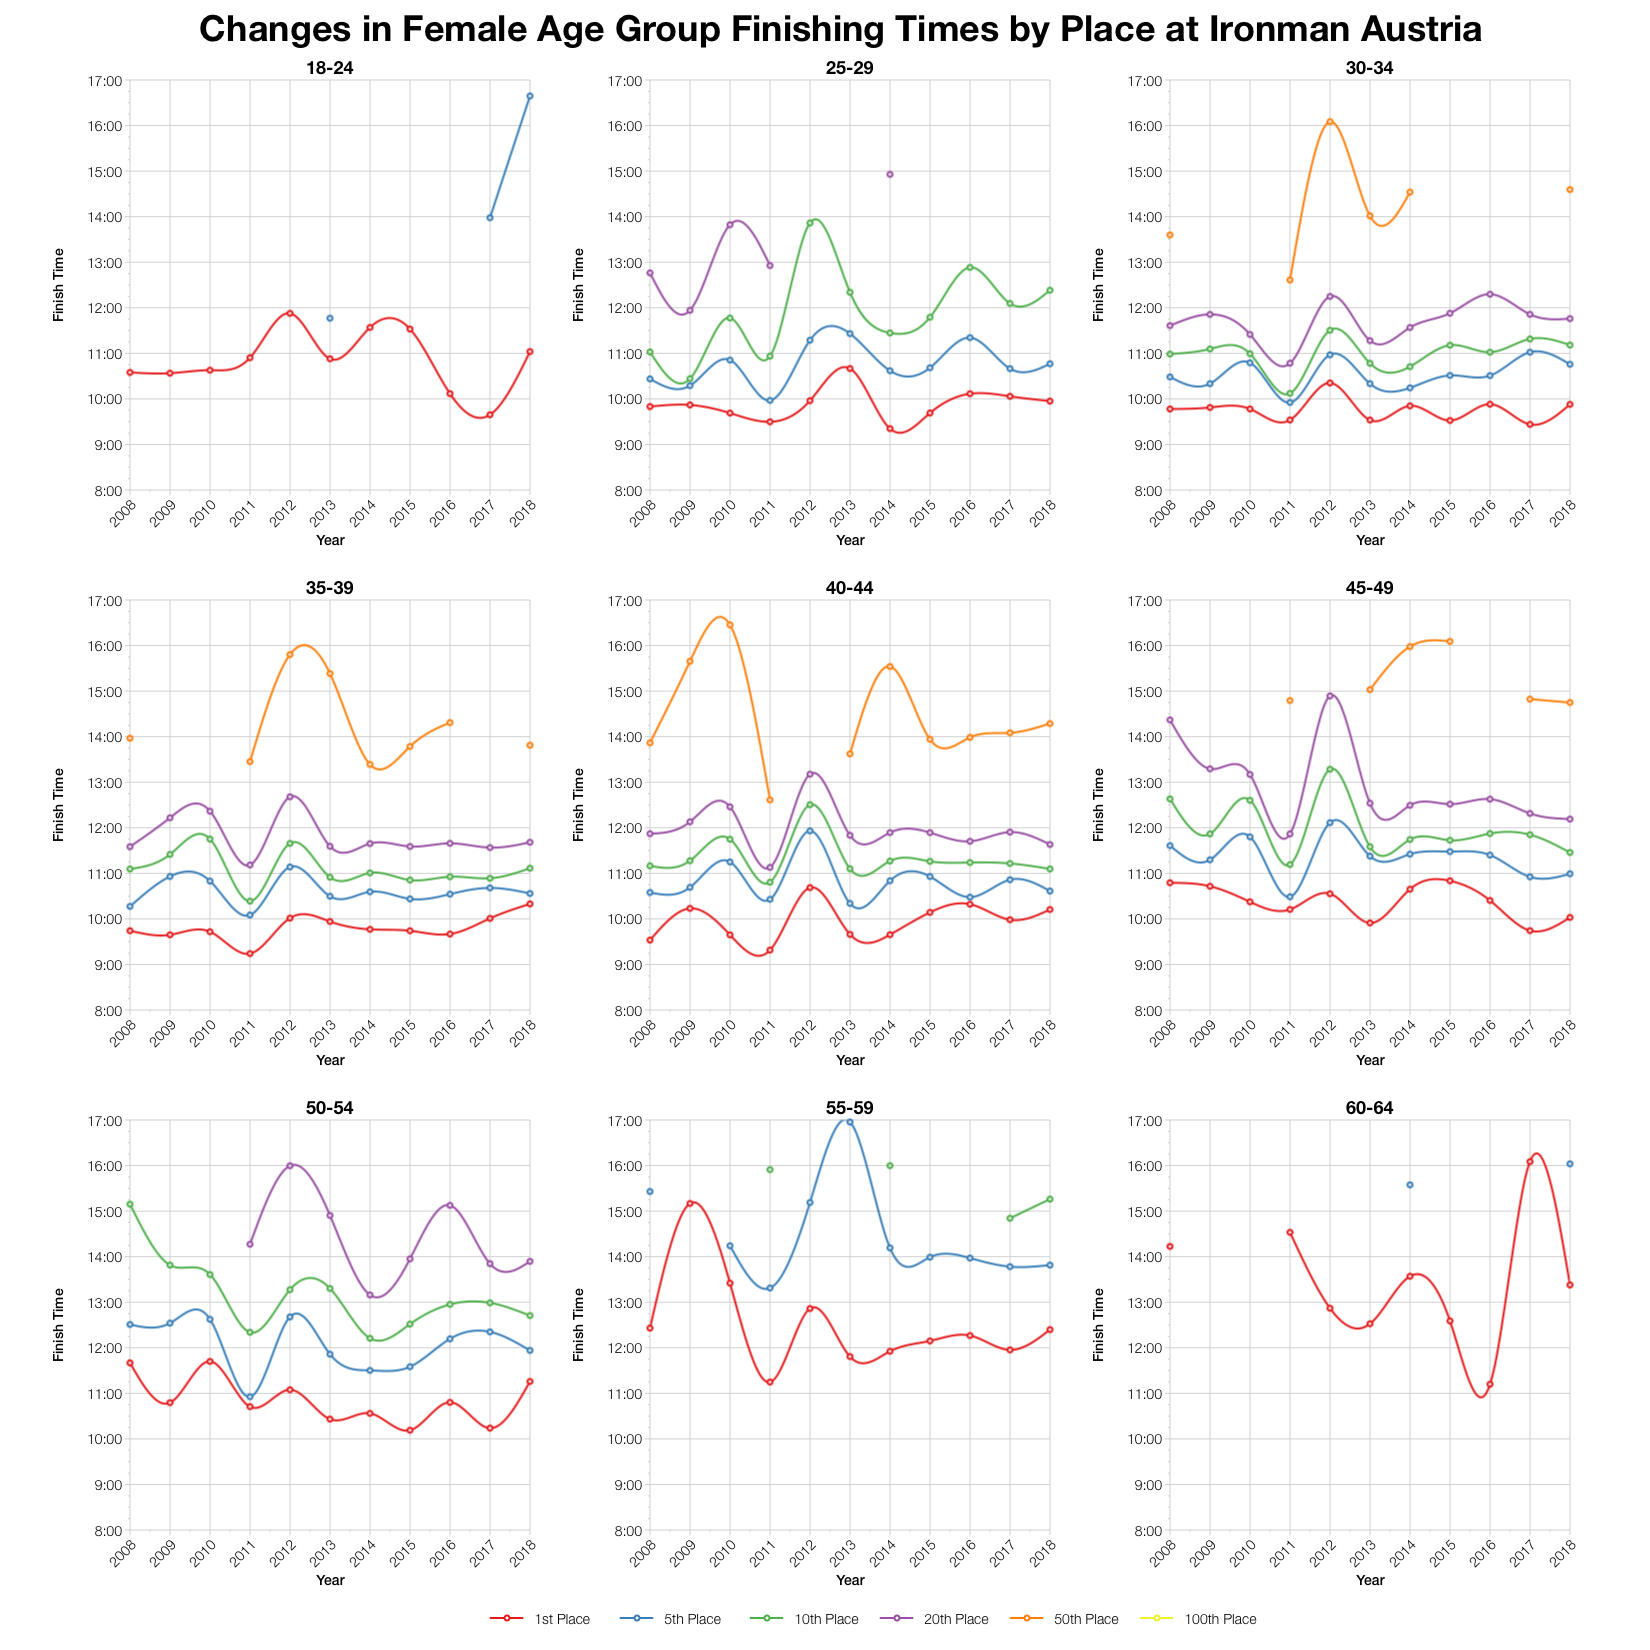
There’s been some variation in times by age group placing over the years, but generally Austria is quite consistent in its largest age groups. 2012 was an especially slow year that stands out. This year is definitely slower than most recent races, but not as extreme as 2012.

Ironman Austria 2018 Predicted Kona Qualification Times
Age Group
Slots
Winner
Average Kona Qualifier
Final Qualifier
M18-24
1
09:31:30
09:31:30
09:31:30
M25-29
2
09:05:28
09:05:31
09:05:34
M30-34
3
09:02:02
09:04:08
09:08:17
M35-39
4
08:52:01
09:08:03
09:18:10
M40-44
4
08:53:57
09:09:25
09:16:24
M45-49
4
09:15:17
09:22:48
09:30:42
M50-54
3
09:26:42
09:41:08
09:52:18
M55-59
2
10:07:59
10:08:14
10:08:29
M60-64
1
10:43:02
10:43:02
10:43:02
M65-69
1
13:04:24
13:04:24
13:04:24
M70-74
1
14:48:34
14:48:34
14:48:34
M75-79
1
15:44:47
15:44:47
15:44:47
F18-24
1
11:02:19
11:02:19
11:02:19
F25-29
1
09:57:04
09:57:04
09:57:04
F30-34
1
09:52:46
09:52:46
09:52:46
F35-39
2
10:19:45
10:21:27
10:23:10
F40-44
2
10:12:21
10:14:19
10:16:18
F45-49
2
10:01:56
10:18:15
10:34:34
F50-54
1
11:15:38
11:15:38
11:15:38
F55-59
1
12:23:55
12:23:55
12:23:55
F60-64
1
13:22:43
13:22:43
13:22:43
F65-69
1
16:42:39
16:42:39
16:42:39

Based on the start list I’ve estimated the Kona slot allocation and from that the automatic qualifying times in age groups. Exact numbers may vary and roll down will affect the final times. You can compare this with other races on my Kona qualification page.

Top Twenty Male Performances and Kona Qualification by Age Group at Ironman Austria 2018
Top Twenty Female Performances and Kona Qualification by Age Group at Ironman Austria 2018

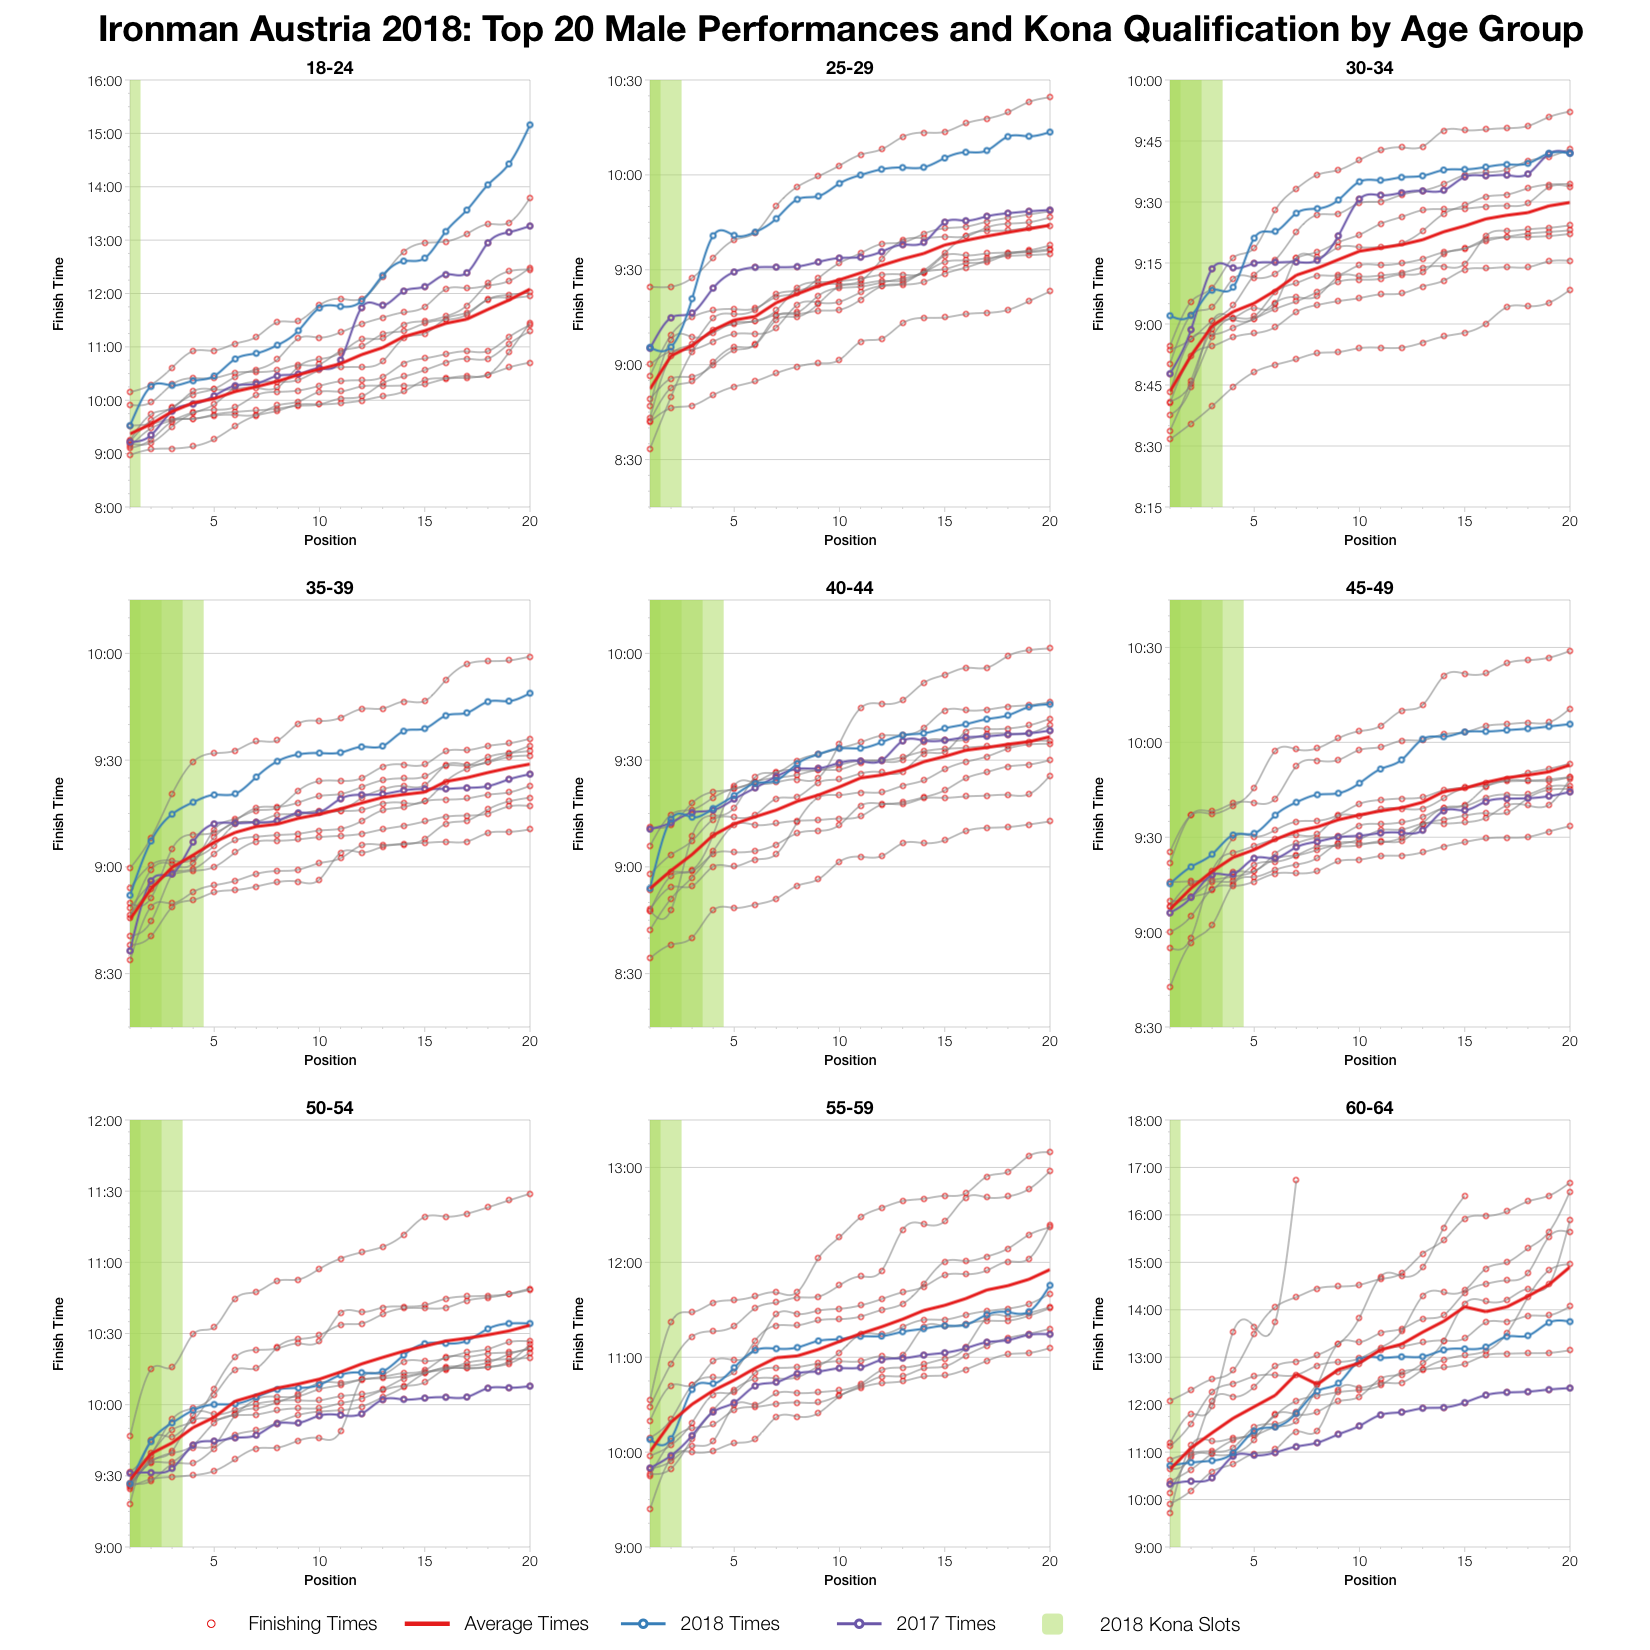
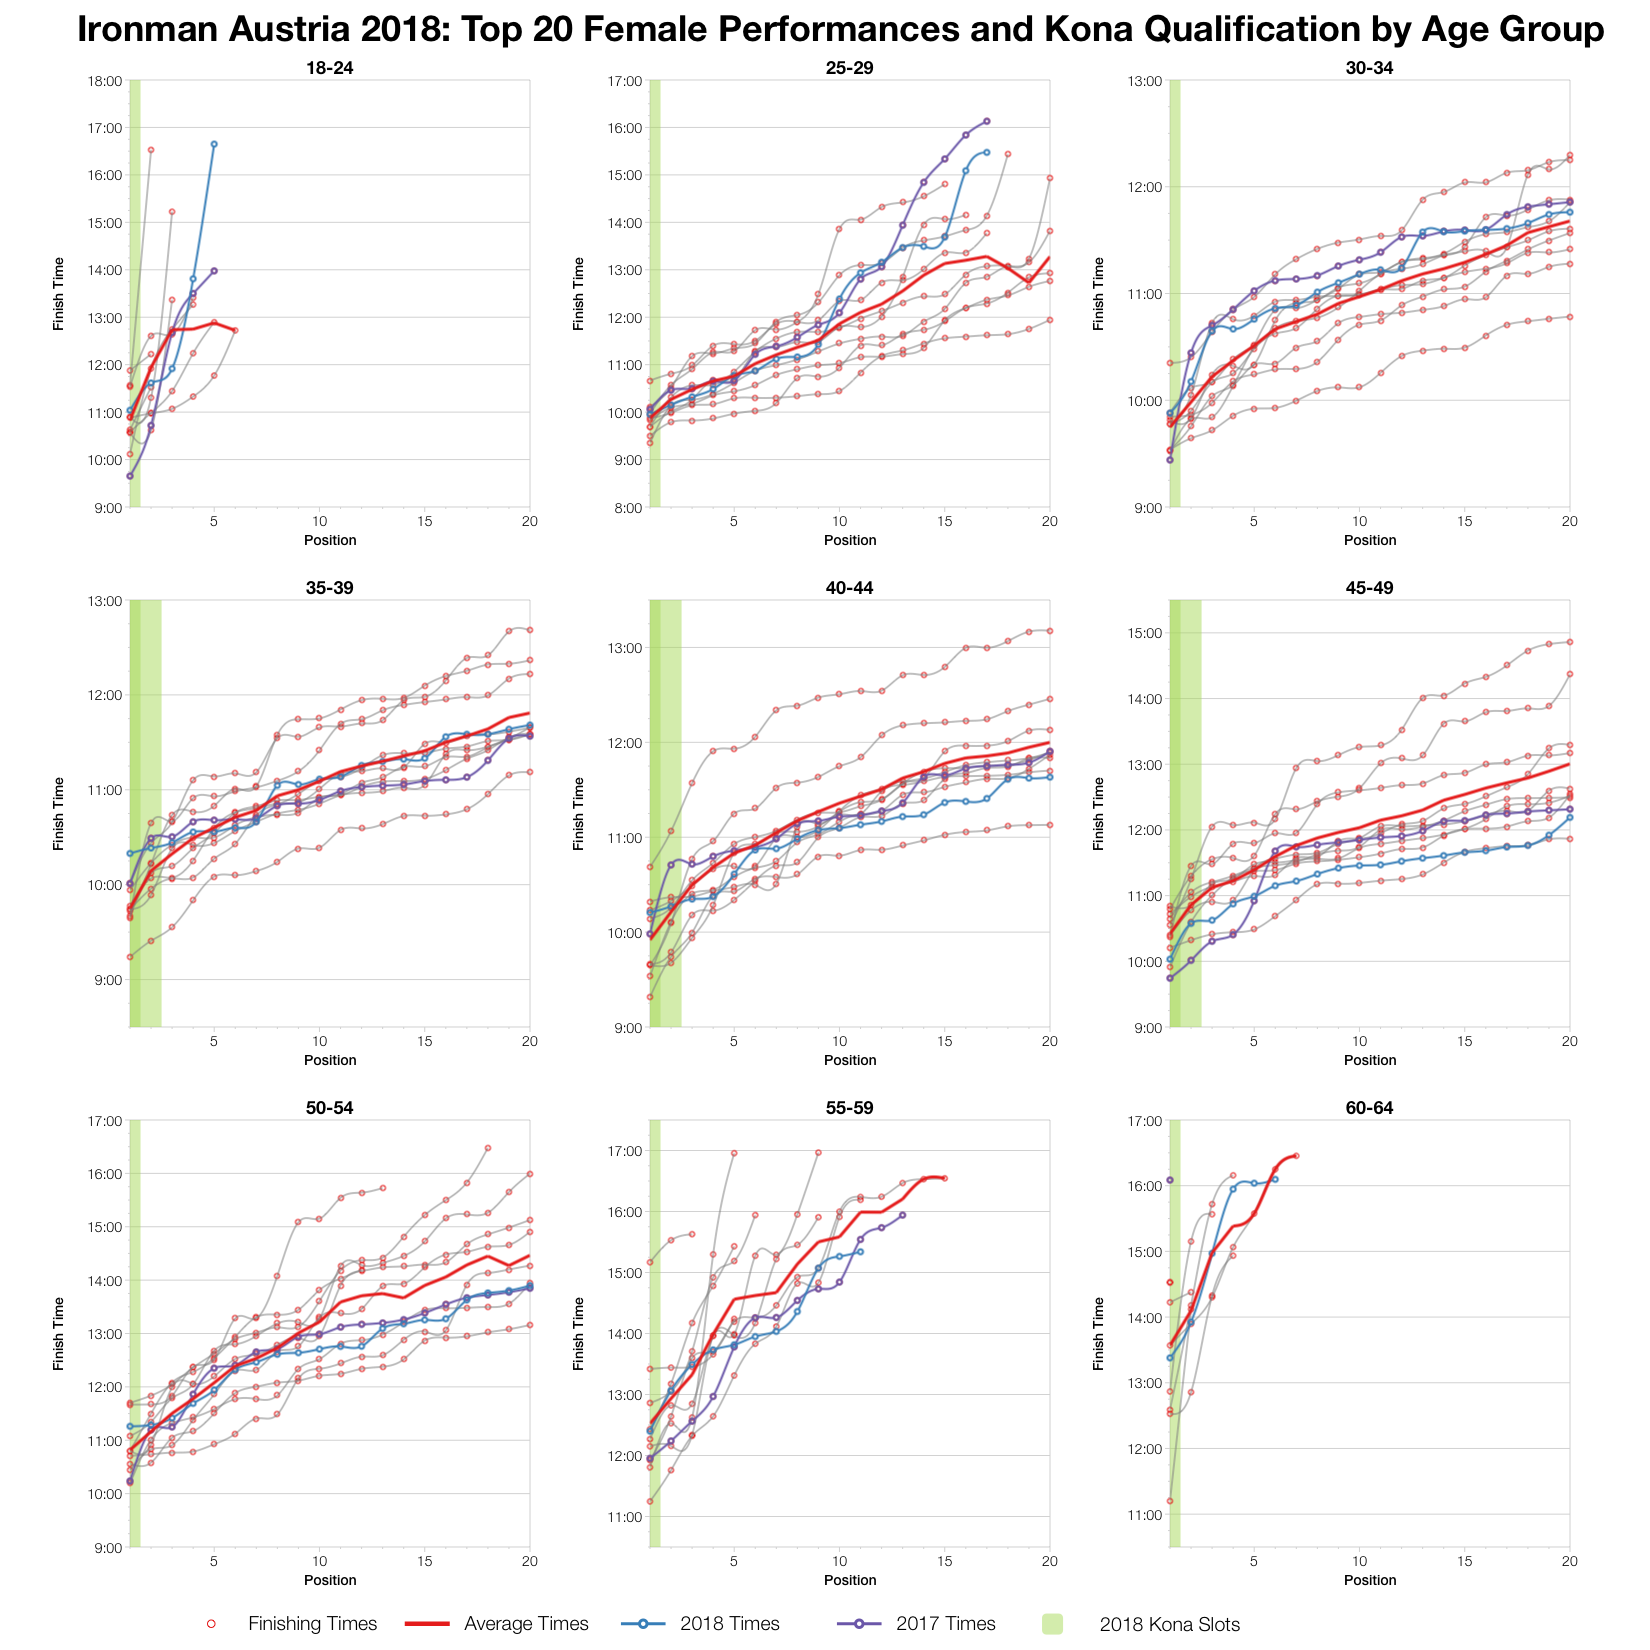
At least for the male age groups the top twenty times tended to be slower than average. this puts them in line with the distribution at the start of the analysis and these are the age groups that make the majority of the field. Older men, over 50s and most female age groups trend closer to the average though with one or two posting better times.

You can access a spreadsheet of the full results from Ironman Austria 2018 on my Google Drive.

Latest statistics for Ironman Austria

Kona Qualification

Compare qualification times across the Ironman Calendar.

Kona Consultancy

Individual race analysis and guidance for Kona qualification.

Support the Stats

Support the continued development of these stats.

Comments