Ironman Switzerland 2018: Age Group Results and Kona Qualification

Latest statistics for Ironman Switzerland

After a busy weekend of Ironman racing I’ll open the analysis up with Ironman Switzerland. It’s a mid-sized, European race with a field in excess of 1,500 athletes and the regular allocation of 40 age group Kona slots. The course is just on the faster side of average for a European race.

Distribution of Finisher Splits at Ironman Switzerland 2018 Compared with 2008-2017

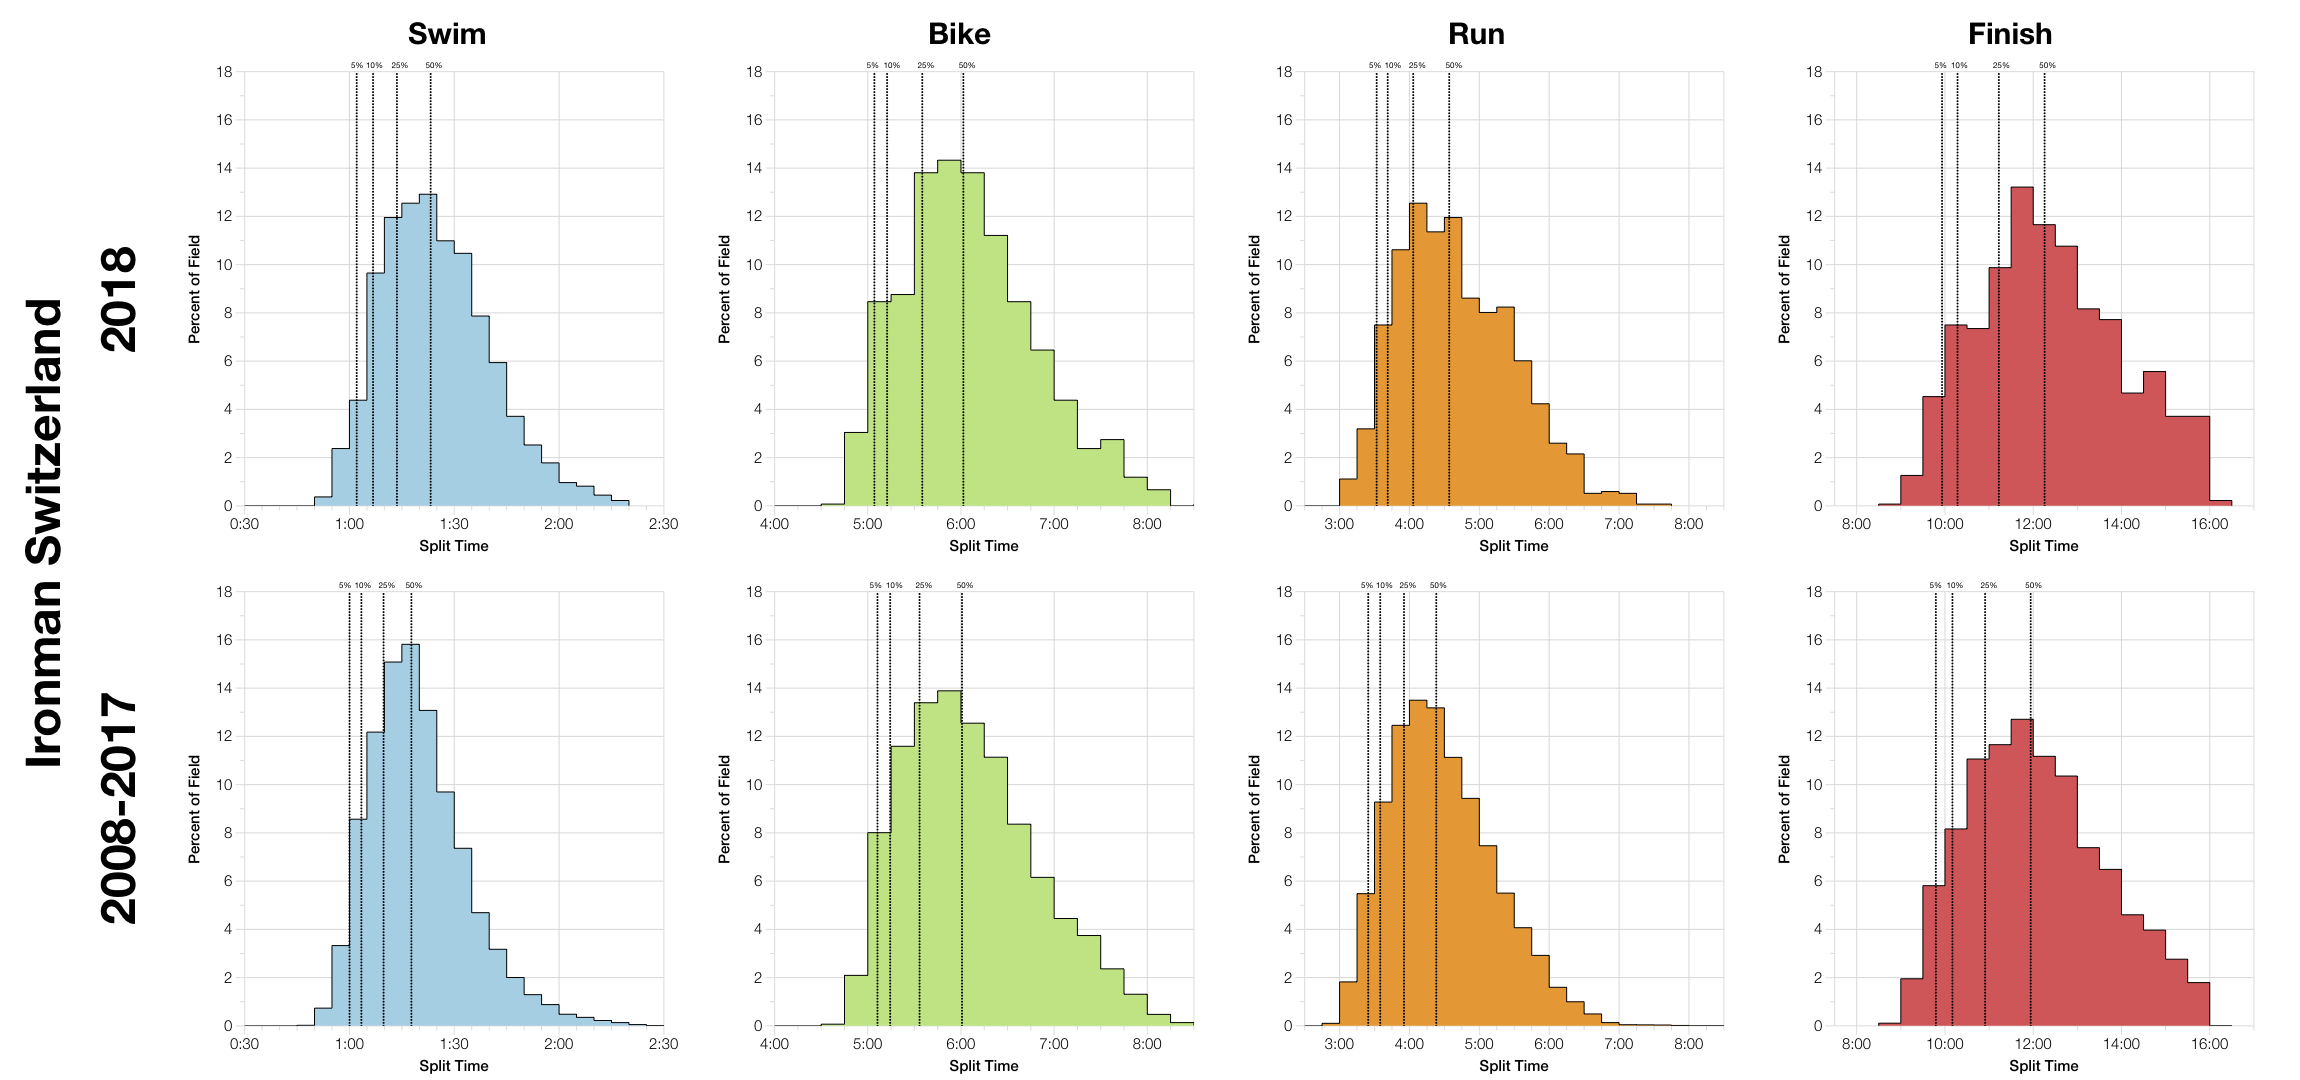
This year’s event trended slightly slower than the amalgamated results of the previous 10 years. This is concentrated in the swim and run splits, both of which trend slower, while the bike time is largely comparable to previous events. The shift isn’t huge by any means and likely represents the minor variation in result statistics from year to year.

DNS and DNF Rates at Ironman Switzerland
Year
Listed Athletes
Swim Finish
Swim DNS/DNF
Bike Finish
Bike DNF
Run Finish
Run DNF
Overall DNS/DNF
2008
2631
2057
21.8%
2020
1.8%
1955
3.2%
25.7%
2009
2508
2092
16.6%
2071
1%
1984
4.2%
20.9%
2010
2676
2226
16.8%
2250
2156
4.2%
19.4%
2011
1998
1759
12%
1704
3.1%
1600
6.1%
19.9%
2012
1534
1520
0.9%
1480
2.6%
1394
5.8%
9.1%
2013
2493
2171
12.9%
2060
5.1%
1878
8.8%
24.7%
2014
2655
2322
12.5%
2247
3.2%
2174
3.2%
18.1%
2015
2077
1818
12.5%
1703
6.3%
1590
6.6%
23.4%
2016
1583
1414
10.7%
1367
3.3%
1254
8.3%
20.8%
2017
1479
1476
0.2%
1407
4.7%
1302
7.5%
12%
2018
1575
1570
0.3%
1489
5.2%
1381
7.3%
12.3%

DNF levels at this years race don’t appear to be anything exceptional. A little higher on the bike, but nothing exceptional. Run DNFs looking to trend in line with recent years.

Median Splits by Age Group at Ironman Switzerland 2018
Median Splits by Age Group at Ironman Switzerland 2008-2017

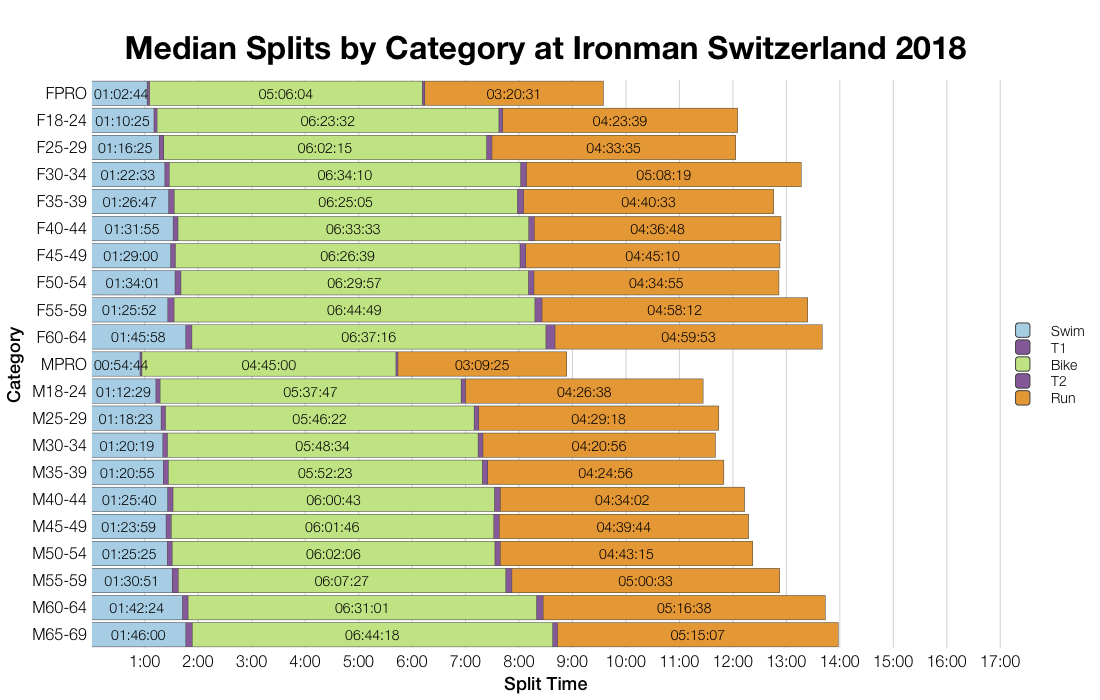
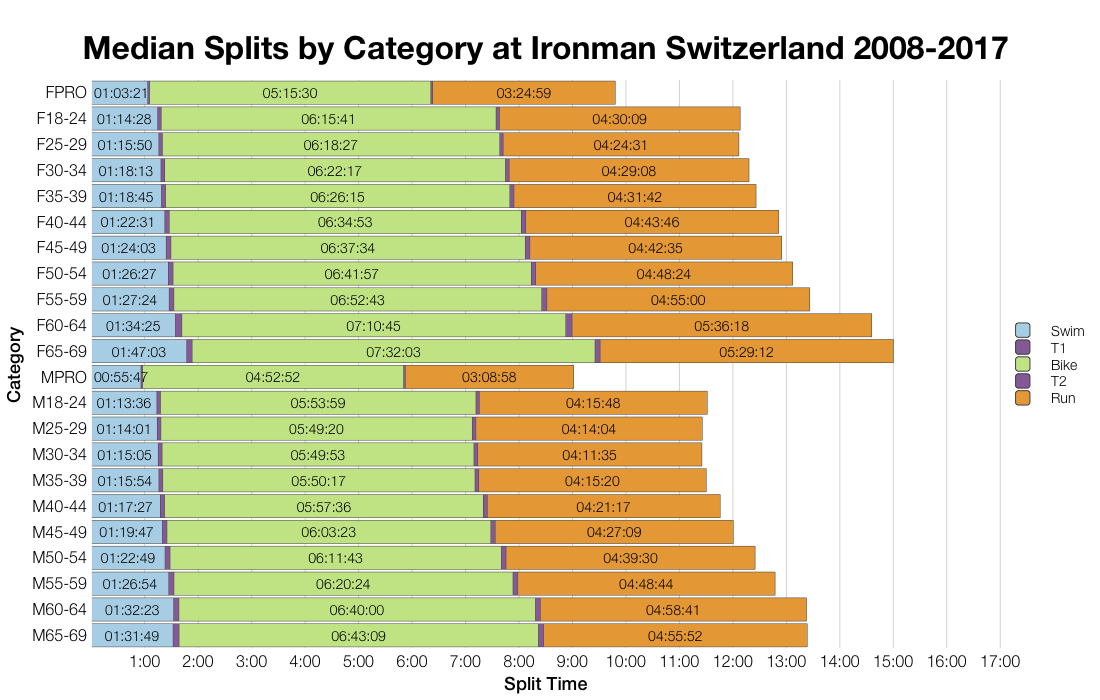
Age group medians follow the distributions with slower swim and run times. Bike splits are more variable, with some age groups faster than usual, some slower.

Top 10 Nationalities at Ironman Switzerland
Country
Count
Percentage
Switzerland
423
24.2
Germany
244
14
United Kingdom
191
10.9
France
176
10.1
Italy
174
10
United States
58
3.3
Spain
53
3
Austria
46
2.6
Netherlands
34
1.9
Belgium
33
1.9
Ironman Switzerland 2018 Predicted Kona Qualifiers by Country
Country
Percentage of Slots
Percentage of Field
Switzerland
42.5
24.2
Germany
22.5
14.0
France
10.0
10.1
Belgium
7.5
1.9
United Kingdom
5.0
10.9
Spain
5.0
3.0
Sweden
2.5
0.7
Austria
2.5
2.6
Italy
2.5
10.0

A broad mix of nationalities race in Switzerland. Most of the Kona slots stay at home or go to Germany with a few going further afield.

Changes in Male Finishing Times by Position at Ironman Switzerland
Changes in Female Finishing Times by Position at Ironman Switzerland

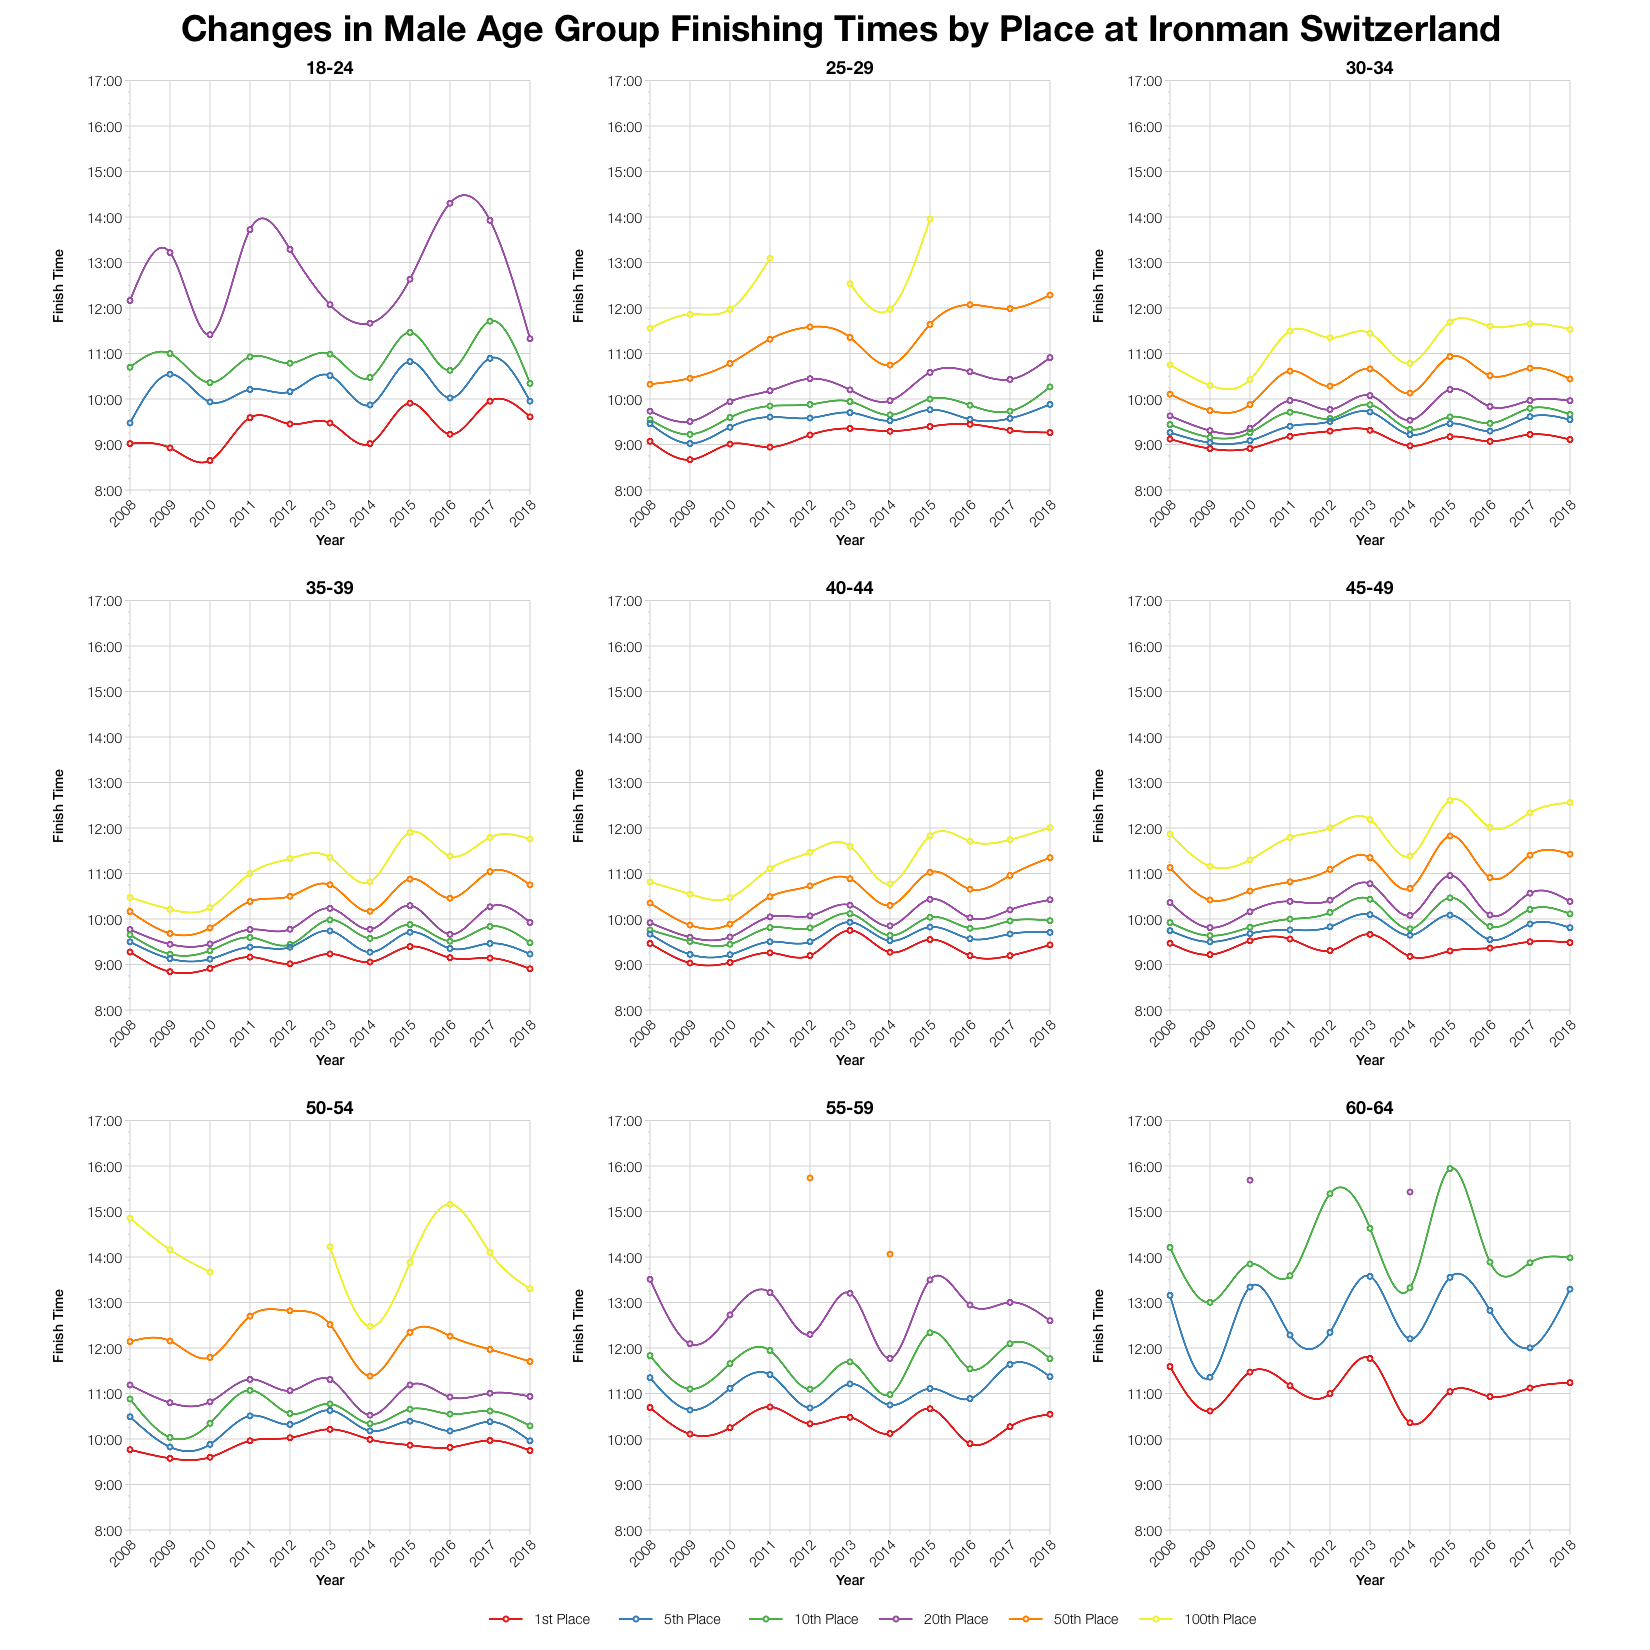
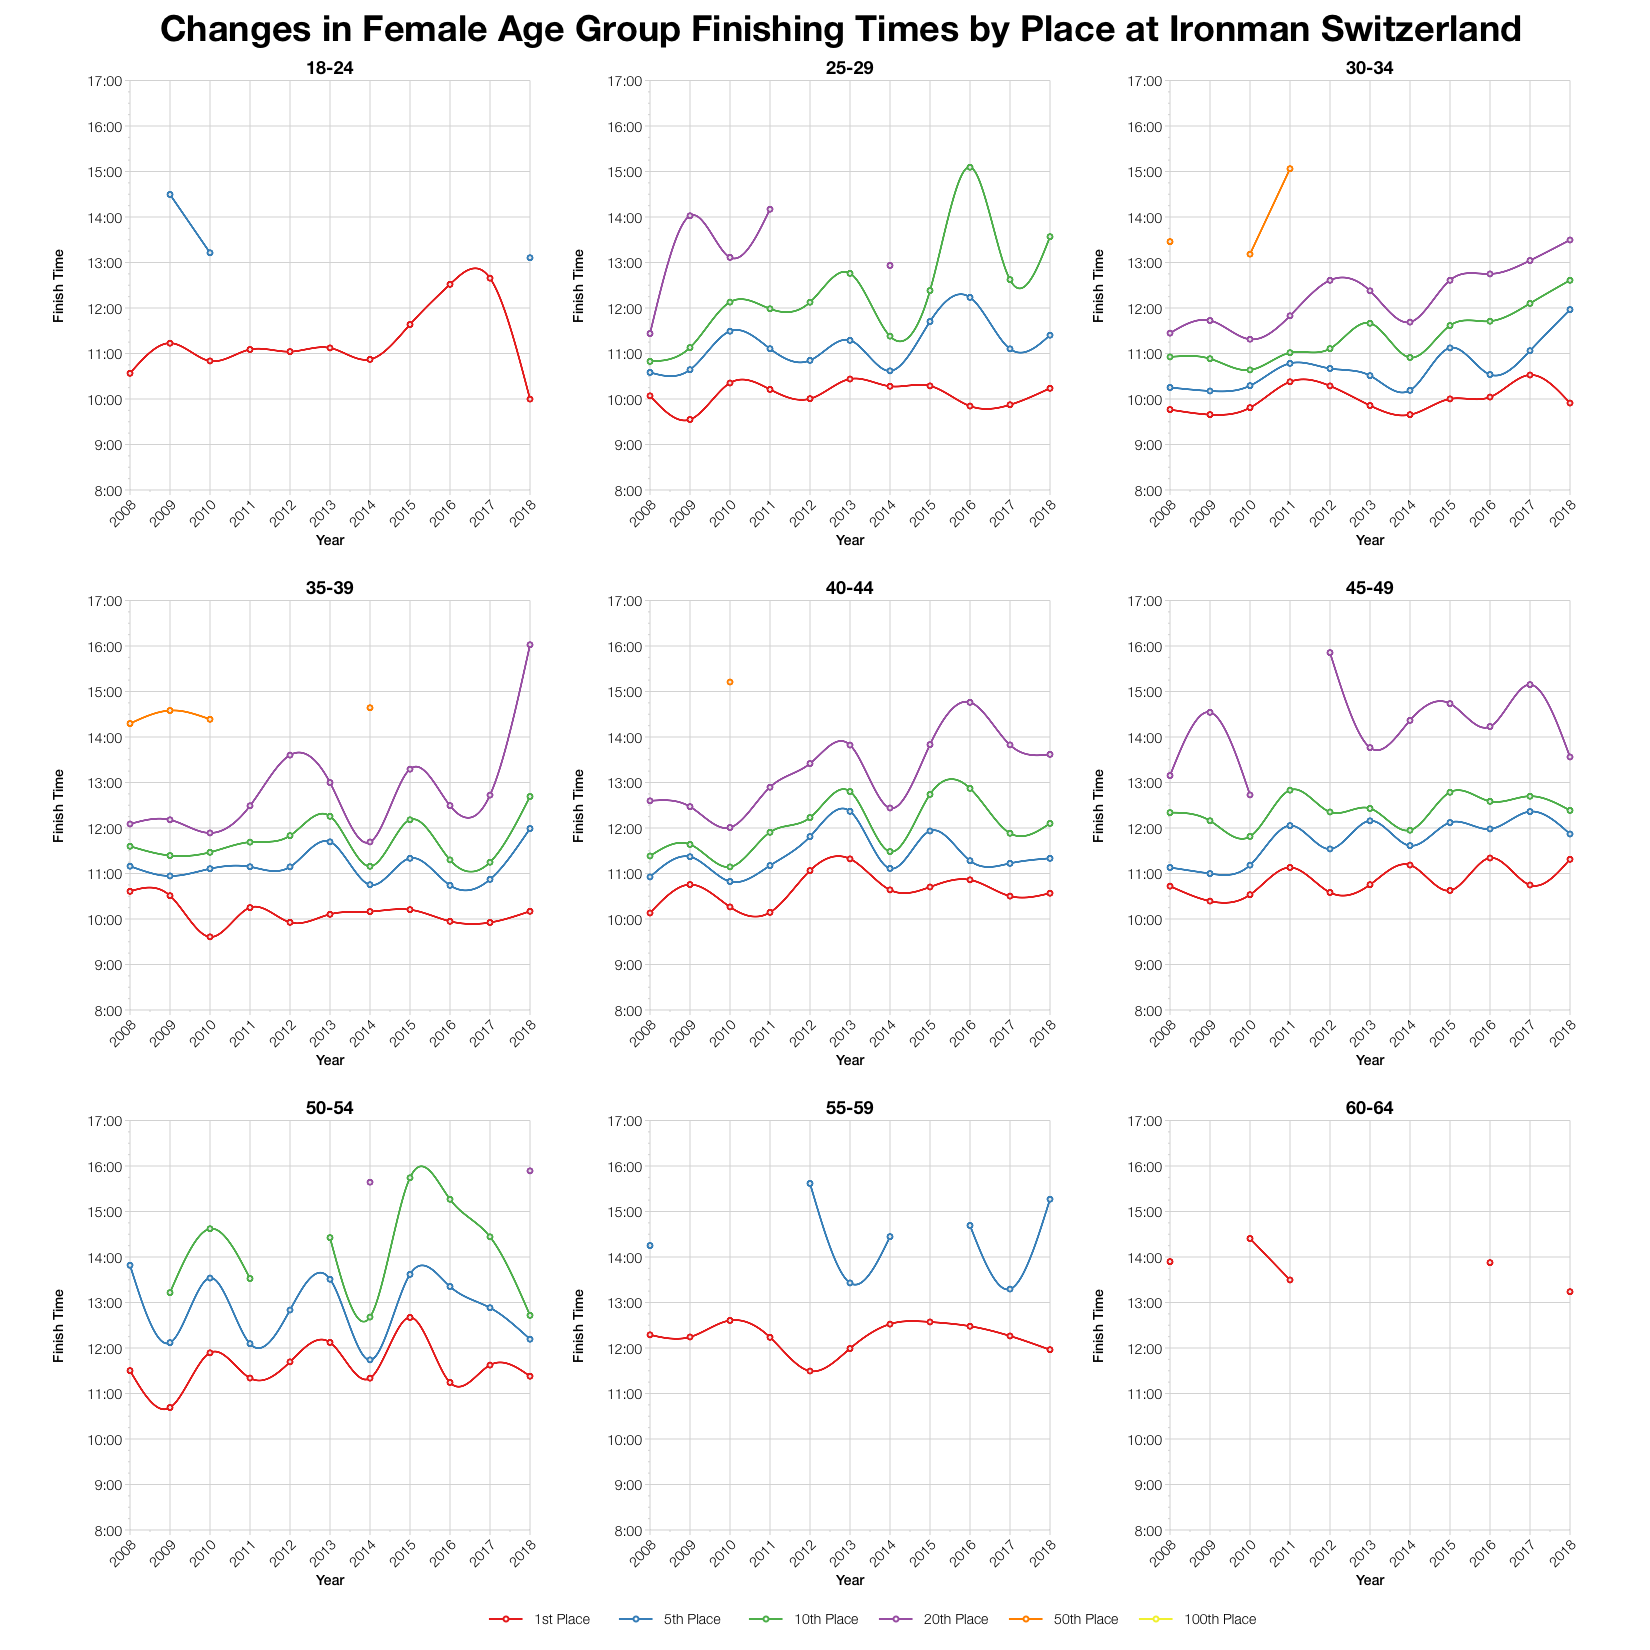
Tracking specific age group placings over the last 10 years shows a lot of variability. Depending on the age group and the position this year’s times can be faster or slower than we’ve typically seen. The biggest male age groups, where the majority of the field is found don’t vary too much from previous results.

Ironman Switzerland 2018 Predicted Kona Qualification Times
Age Group
Slots
Winner
Average Kona Qualifier
Final Qualifier
M18-24
2
09:36:26
09:40:43
09:45:00
M25-29
2
09:15:44
09:20:25
09:25:07
M30-34
4
09:06:34
09:13:57
09:20:32
M35-39
4
08:54:17
09:05:21
09:12:18
M40-44
5
09:25:48
09:33:29
09:42:25
M45-49
4
09:28:58
09:34:44
09:41:06
M50-54
3
09:44:48
09:50:35
09:56:19
M55-59
2
10:32:43
10:42:41
10:52:40
M60-64
1
11:14:18
11:14:18
11:14:18
M65-69
1
11:39:29
11:39:29
11:39:29
F18-24
1
09:59:52
09:59:52
09:59:52
F25-29
1
10:14:10
10:14:10
10:14:10
F30-34
2
09:54:41
10:37:16
11:19:51
F35-39
1
10:10:14
10:10:14
10:10:14
F40-44
2
10:34:03
10:38:49
10:43:36
F45-49
2
11:18:47
11:26:25
11:34:03
F50-54
1
11:22:50
11:22:50
11:22:50
F55-59
1
11:57:42
11:57:42
11:57:42
F60-64
1
13:14:10
13:14:10
13:14:10

Based on the start numbers I’ve estimated the slot allocation in Switzerland and from that the automatic qualification times in each age group. Final numbers may vary and roll down will influence the final qualifying time. You can compare with other races on my Kona qualification page.

Top Twenty Male Performances and Kona Qualification by Age Group at Ironman Switzerland 2018
Top Twenty Female Performances and Kona Qualification by Age Group at Ironman Switzerland 2018

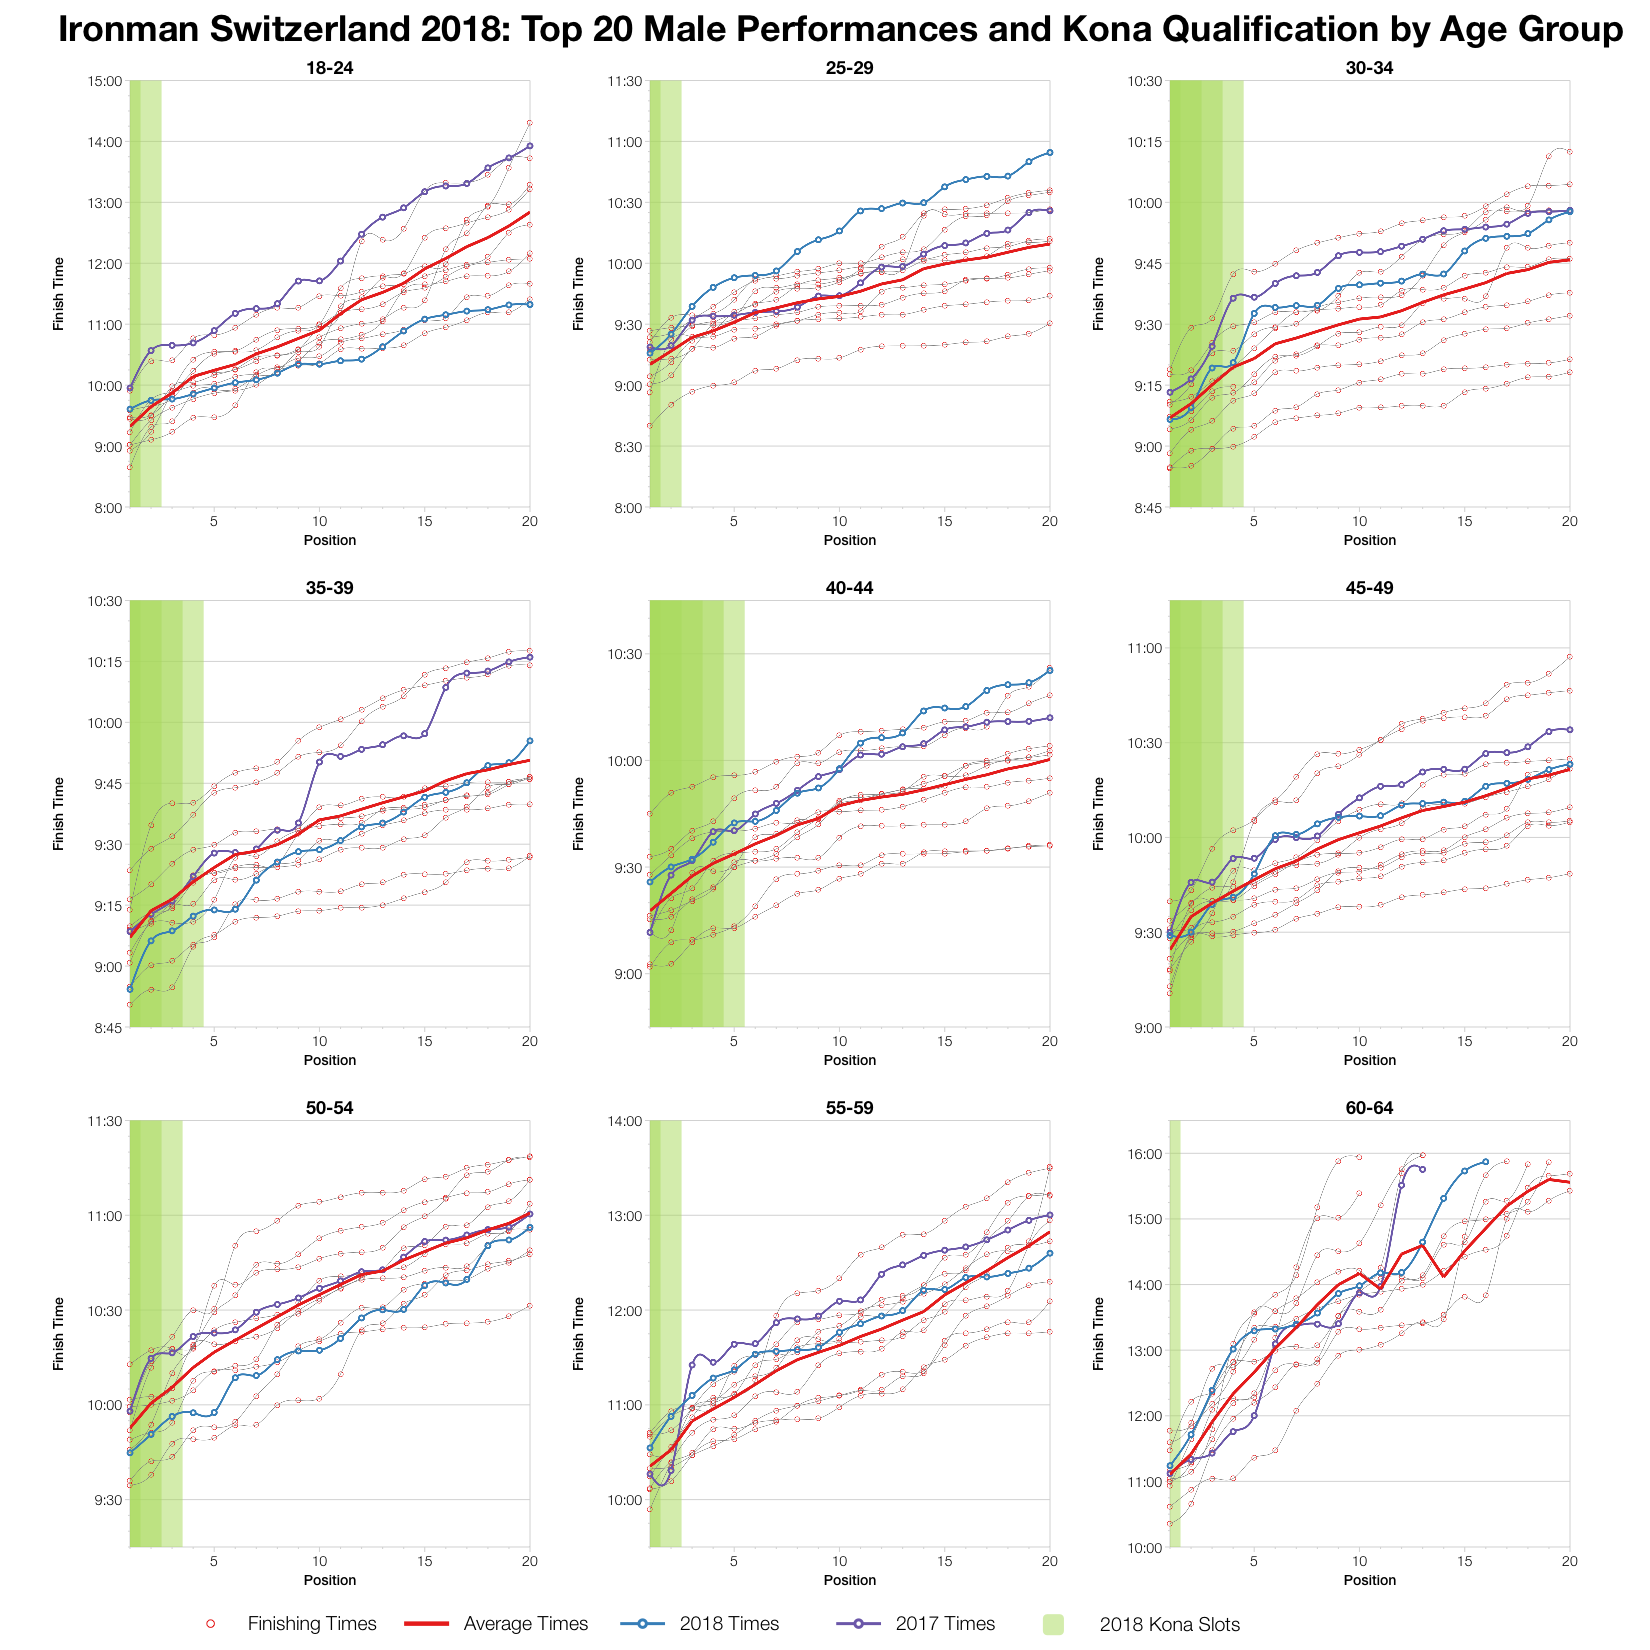
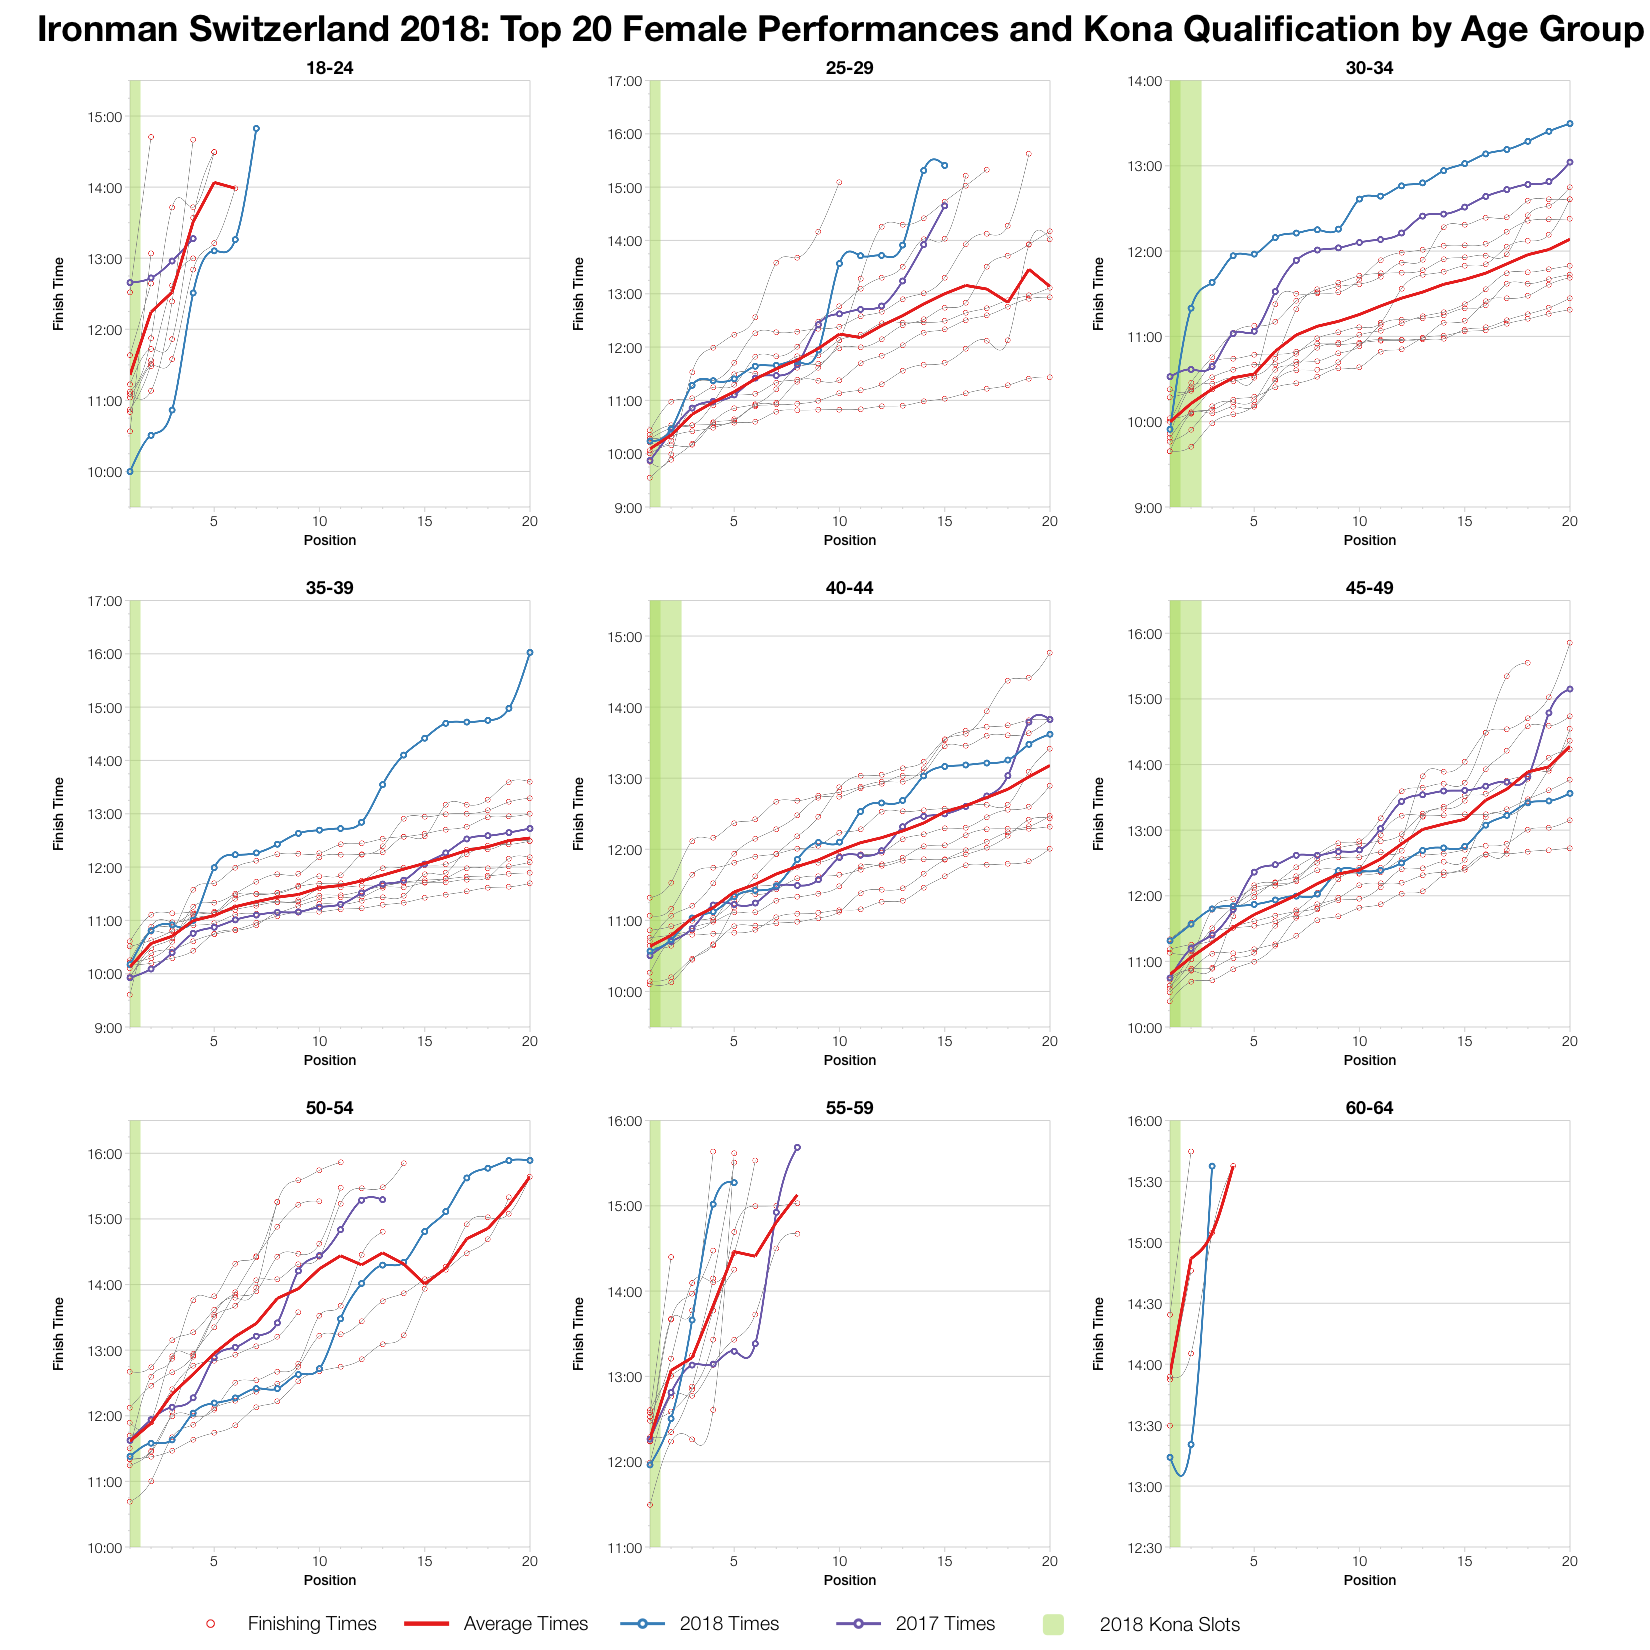
There is age group variability, but for most, this year’s top twenty times trend slower than the average. The M35-39 age group is the clearest exception with times pushing ahead of the average line. Overall though this year’s race looks to have been slightly slower for the course.

You can access a spreadsheet of the full results from Ironman Switzerland 2018 on my Google Drive.

Latest statistics for Ironman Switzerland

Kona Qualification

Compare qualification times across the Ironman Calendar.

Kona Consultancy

Individual race analysis and guidance for Kona qualification.

Support the Stats

Support the continued development of these stats.

Comments