The second Ironman of the year was the African Championship – Ironman South Africa. As a championship race it came with 80 slots for age group athletes, but drew a field of under 2,000 competitors. For that reason I’ve always considered South Africa a potential good choice for qualification. This year’s race looks to have been slightly faster than average for the course, although it should be noted that route changes in recent years have lead to a faster course.
The usual note about the data: results have been retrieved from Ironman.com the day after the race, although they note instances of DNS, DNF and DQ they do not provide any split times for those athletes. Normally I’d have access to the data for some of these charts – it’s absence may make some elements of the race appear slightly faster.
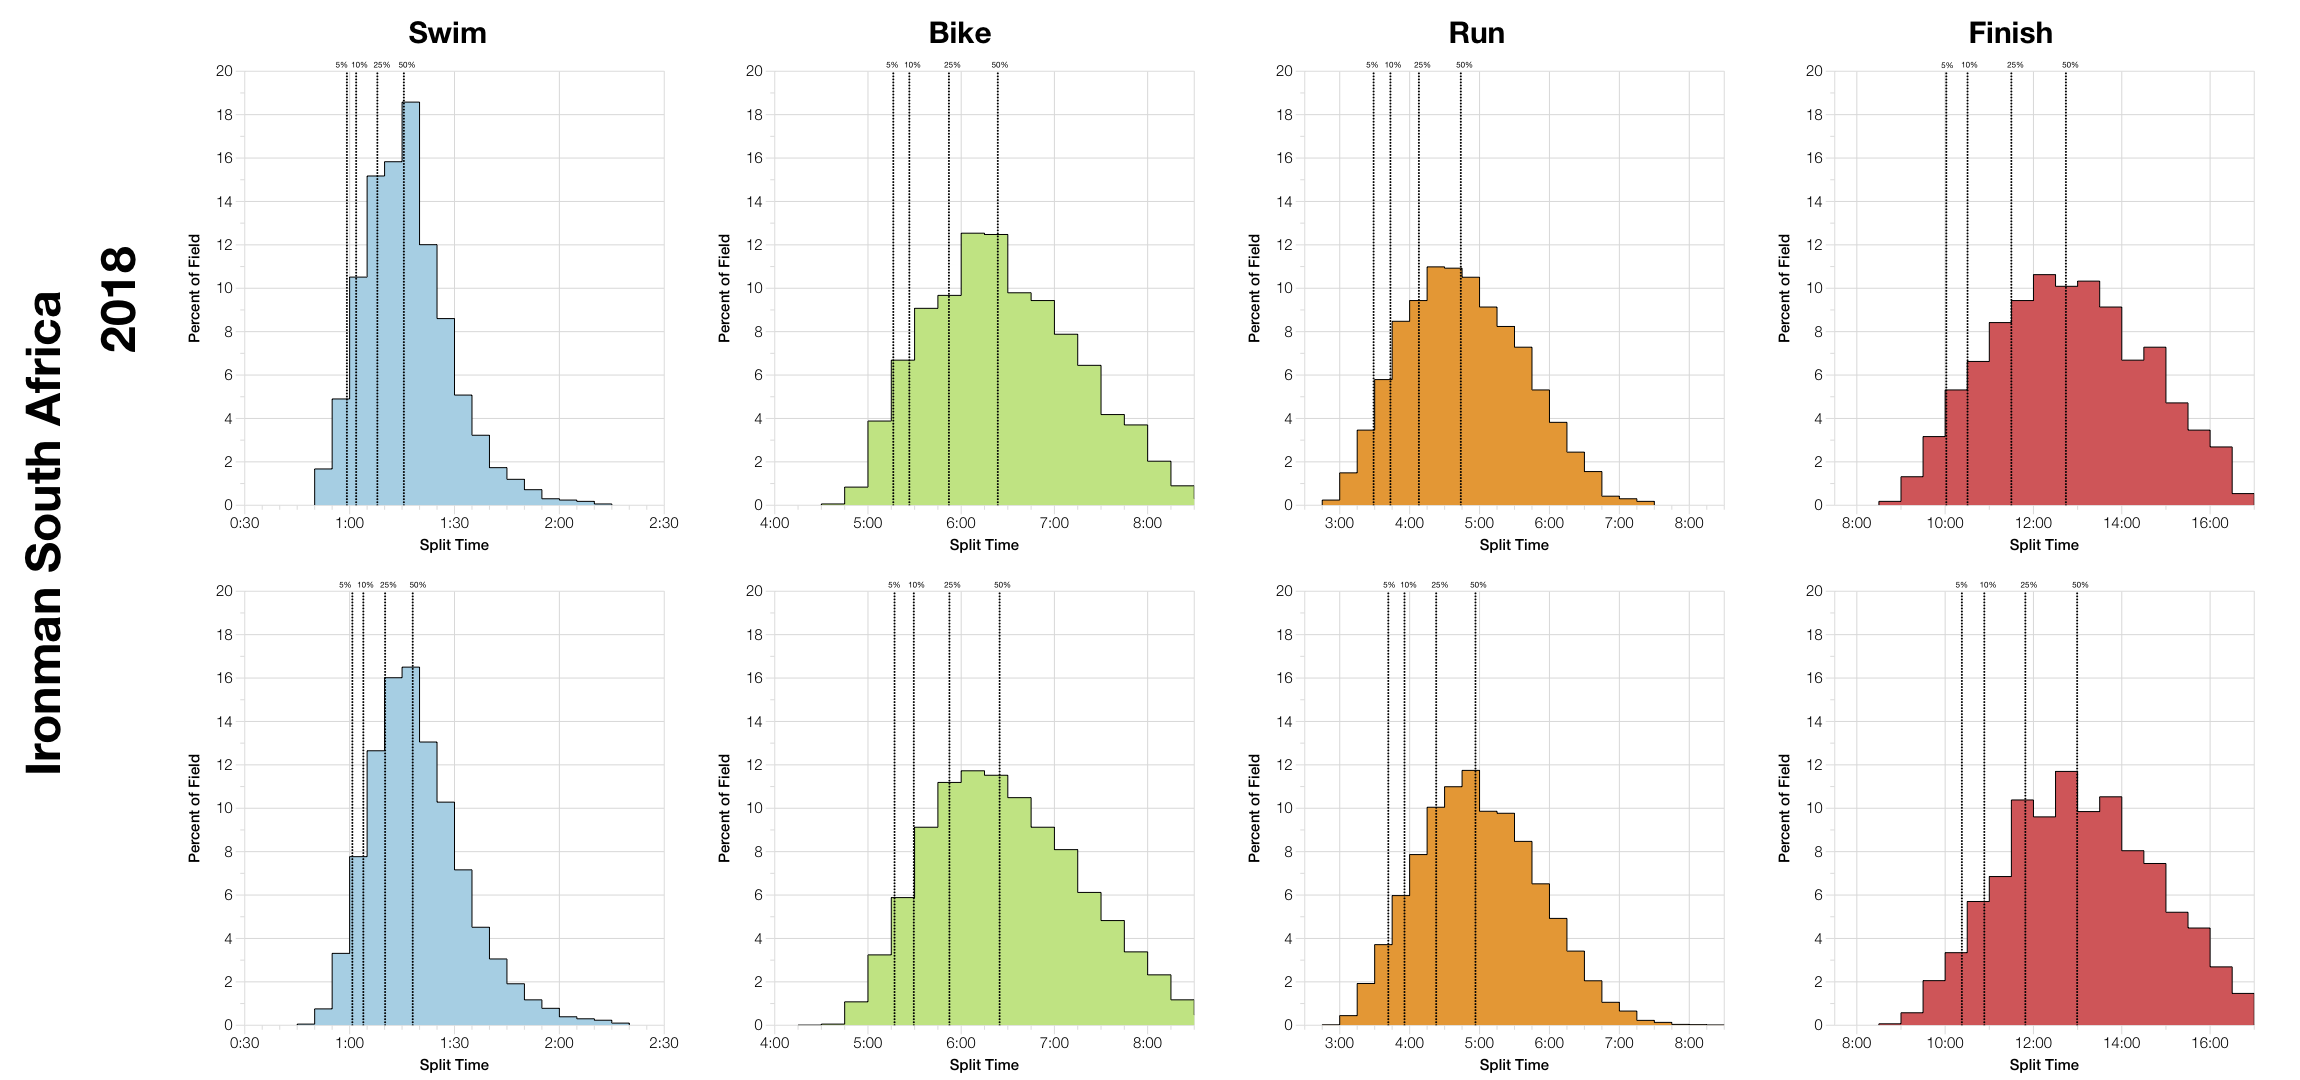
This year’s distribution of finisher splits trends slightly faster than the 10 year aggregated data. As I mention in my introduction, there have been course changes that have seen times drop at the race so older results tend to pull back the aggregate splits. That said, the shift in overall finish times looks to be in the order of 15-20 minutes faster, so not insignificant. These changes appear to come primarily from performances on the run with a little help from the swim. The bike trends slightly faster, but very close to the historical chart.
The lack of split data for those who DNFed in South Africa makes it impossible to give an accurate breakdown of where people dropped out. Of course I’m used to having mixed information on DNF and DNS numbers. At least here we can say the overall figures are correct and slightly lower than the similarly accurate previous year. Previous years mostly merge DNS and DNF numbers, making comparison difficult.
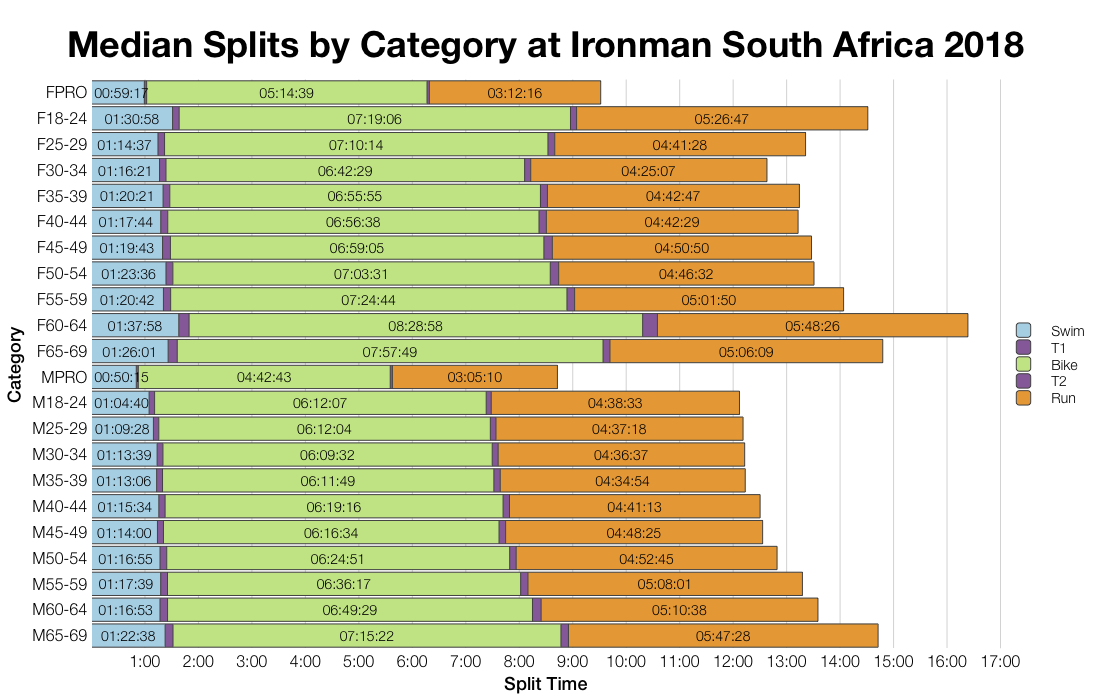
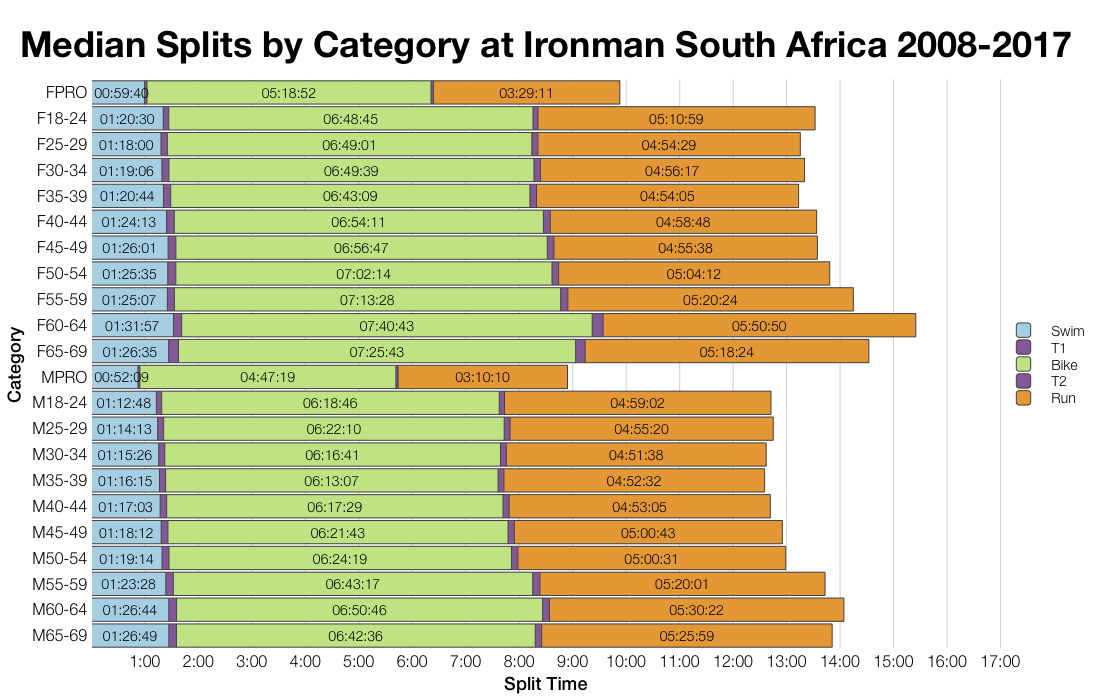
As we’d expect the trends shown in the individual age group medians are similar to those in the distribution. The run is the element that most consistently comes in faster than the aggregate data, but we also see that swim and bike are a little faster too.
Ironman south Africa is a race that attracts a large field from overseas (perhaps partly thanks to the good slot to athlete ratio). Local athletes performed comparably to their numbers and the rest of the slots were distributed over the many other nationalities present.
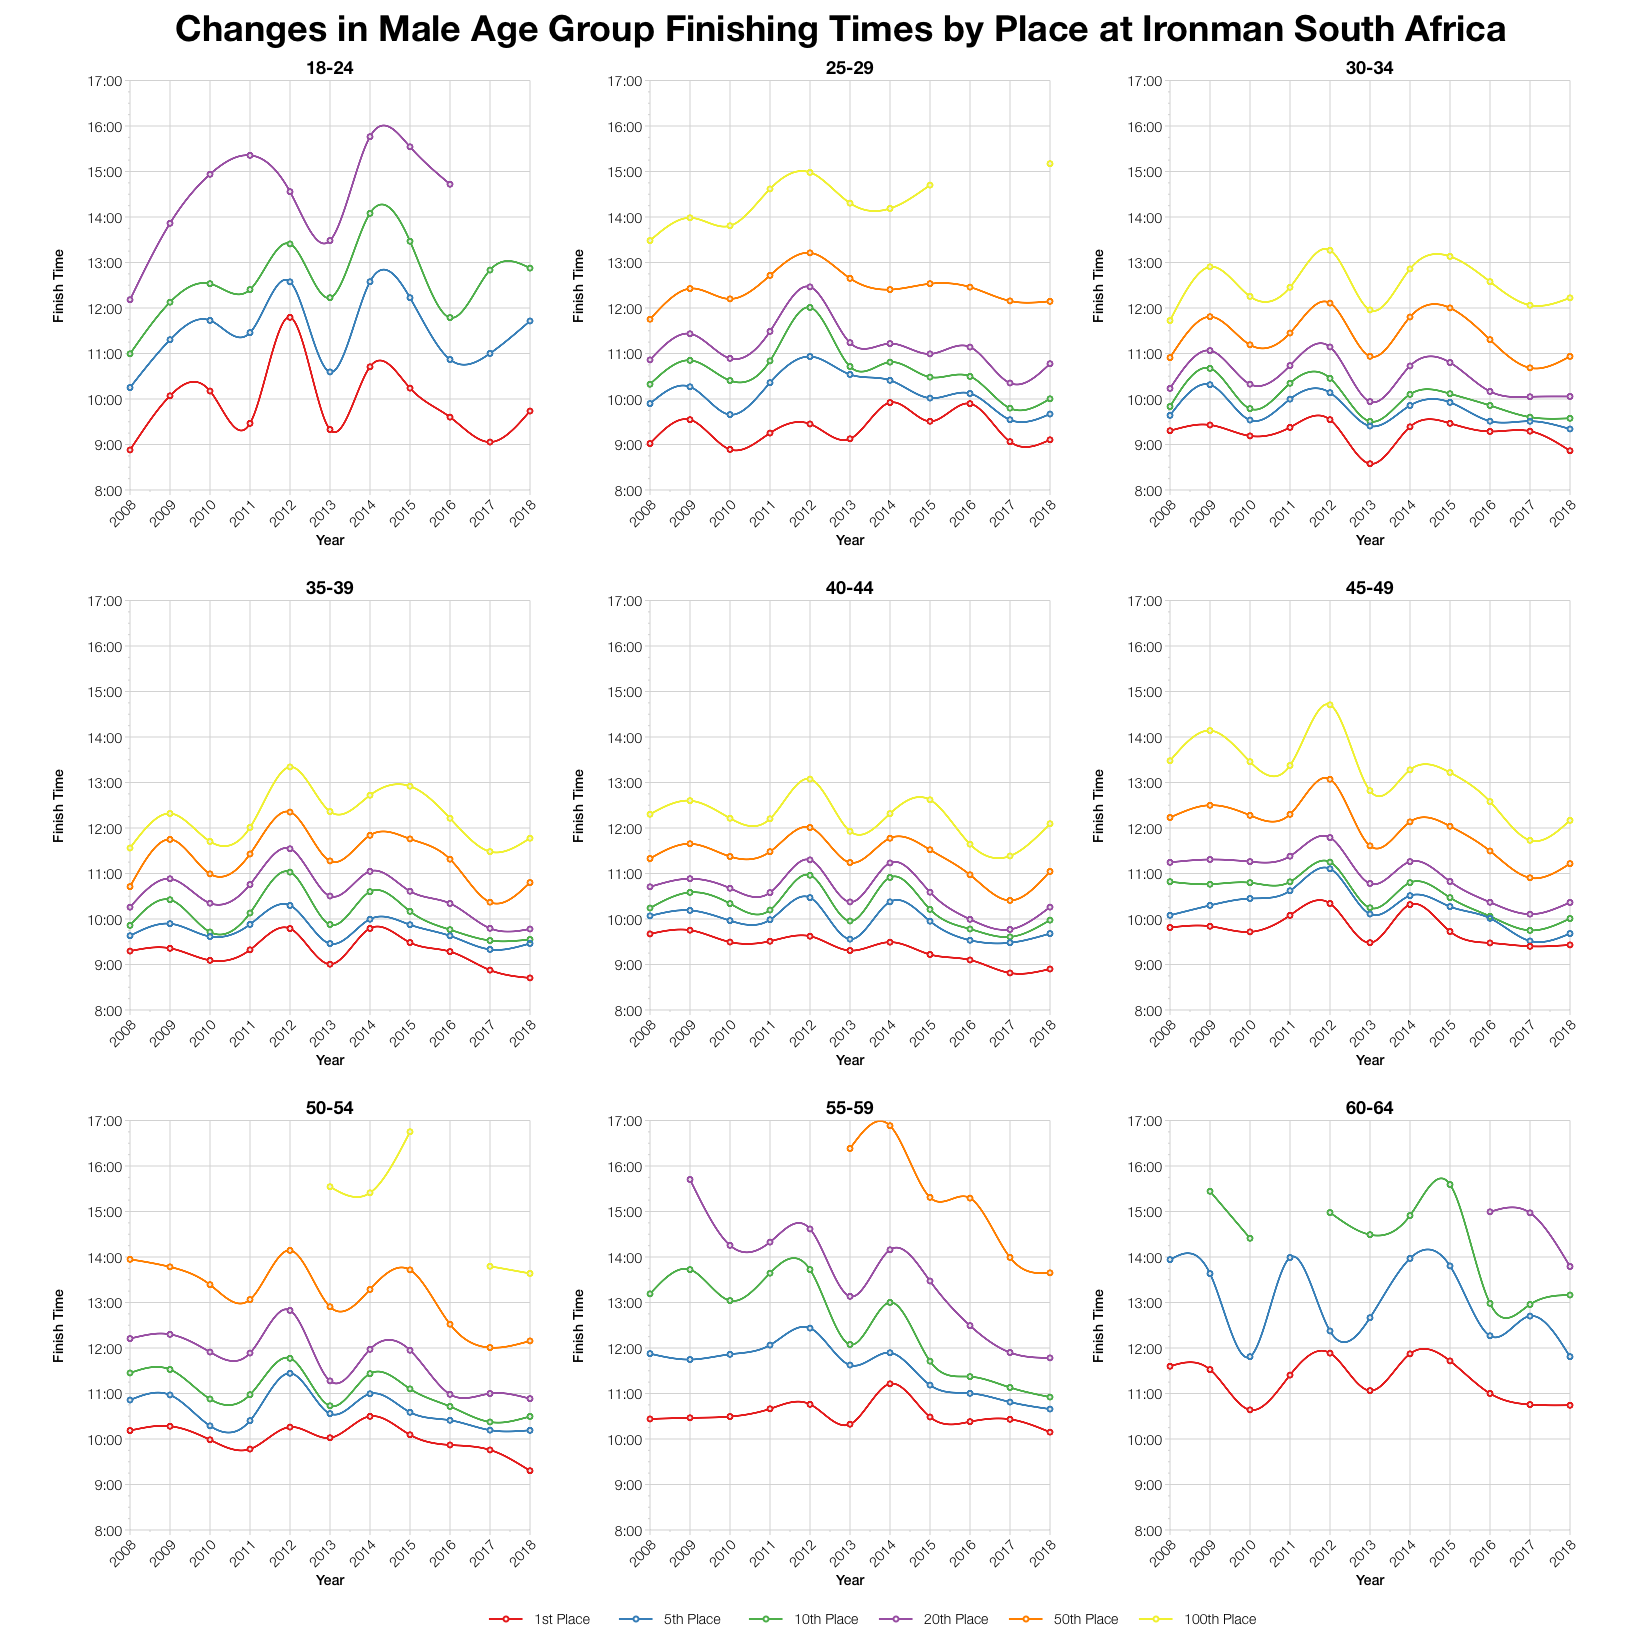
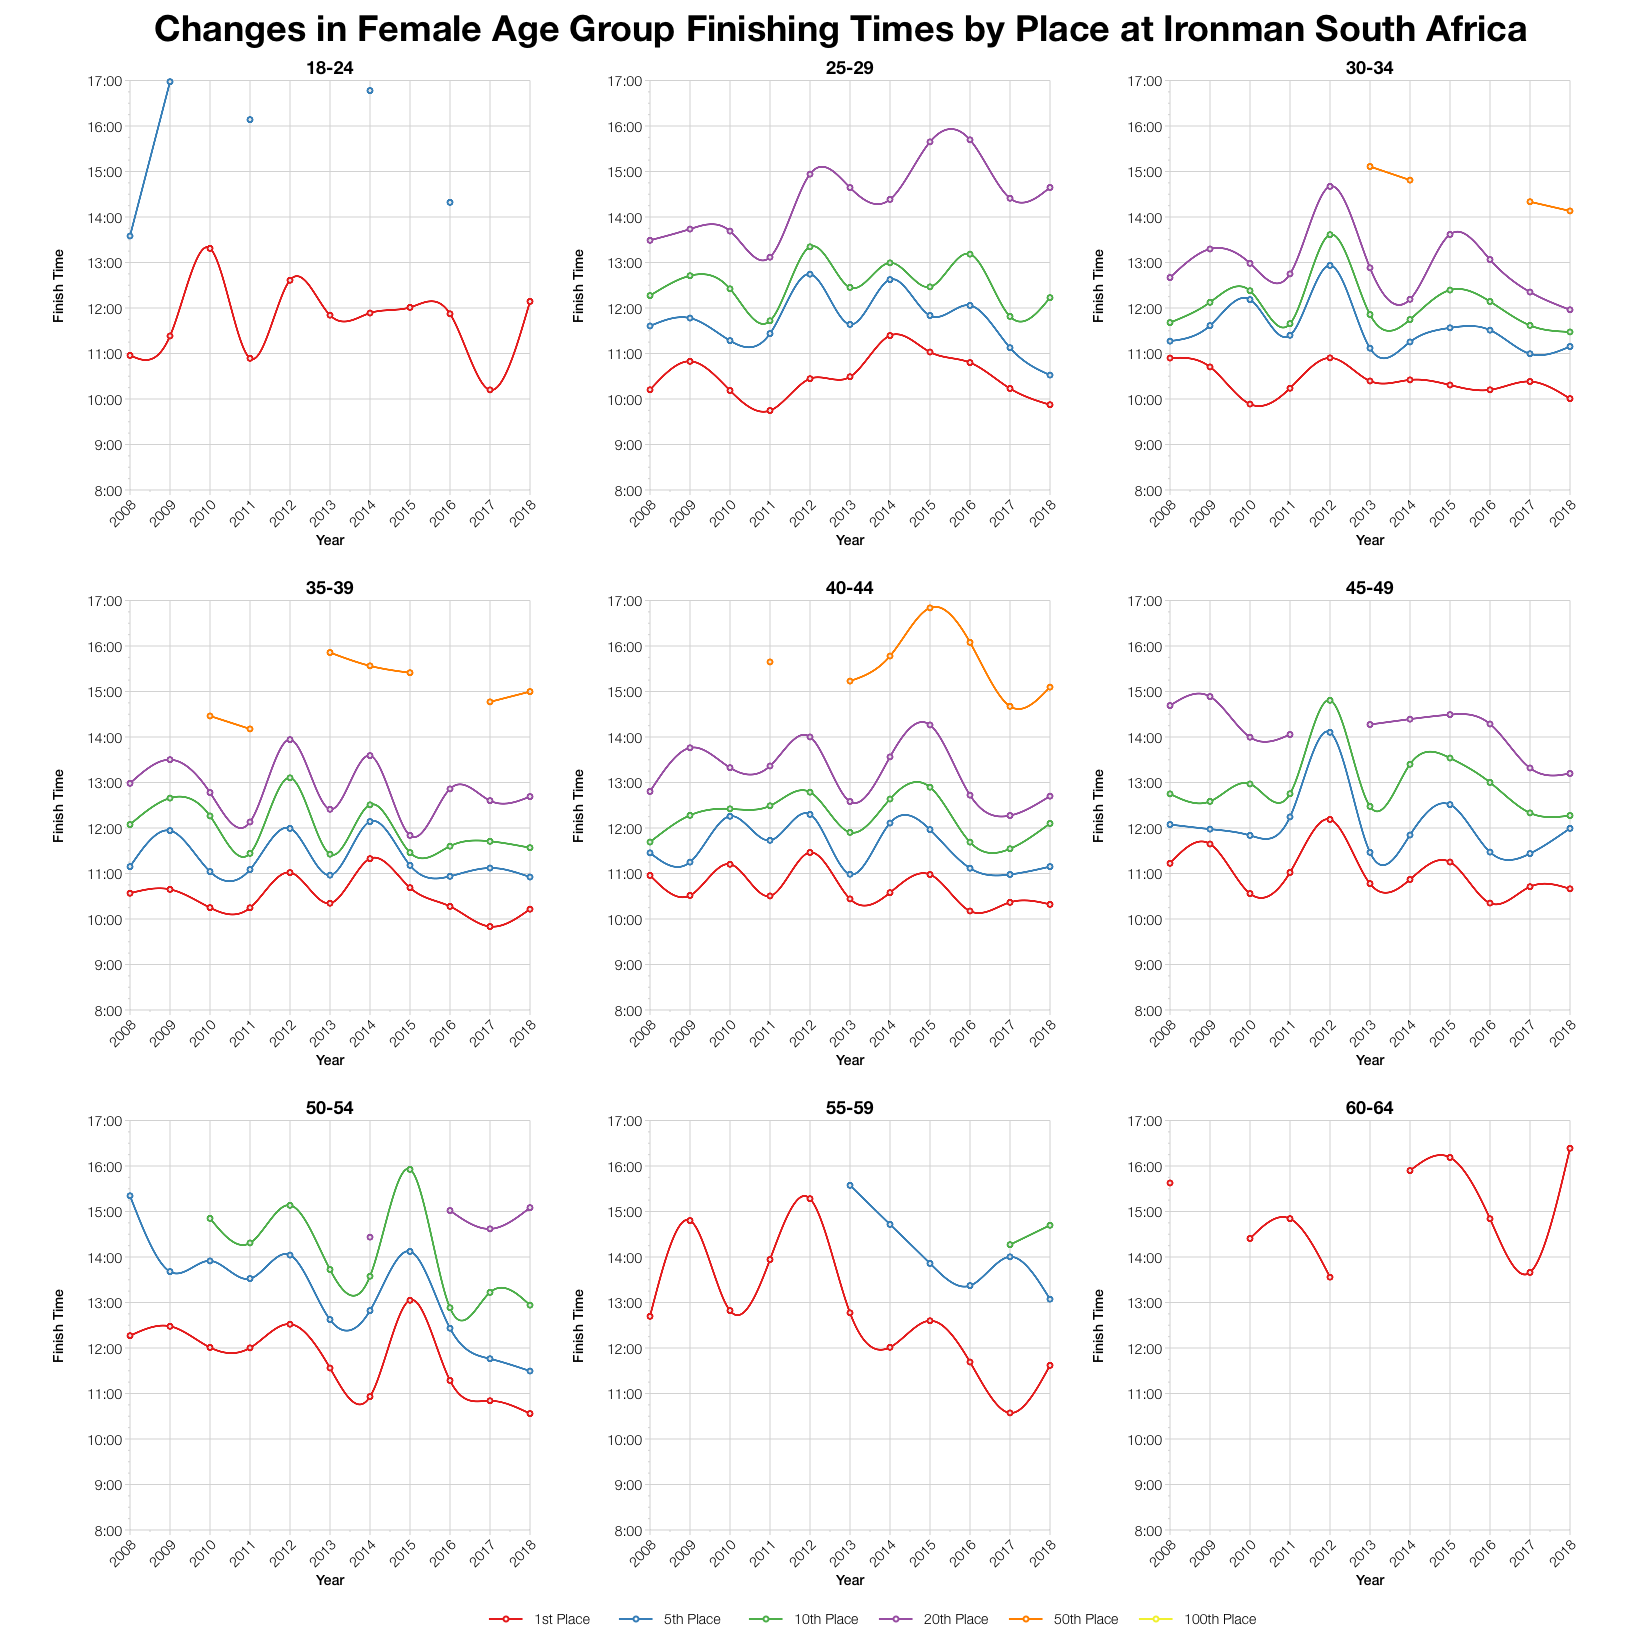
It’s useful to track age group times in a little more detail over the last decade; it helps to highlight changes relating to the course. Knowing that recent years on a new bike course have tended to be faster we can see that this year’s results aren’t dissimilar to the last two. Last year looks to have been faster overall, but that does vary with age group and place.
Based on the results data I’ve calculated the above distribution of slots as likely and from that what would be an automatic qualifying time. As always, although my calculations are based upon the approach used by Ironman, the final allocation may vary and roll down will influence the qualifying times too. You can compare this with other races on my Kona qualification page.
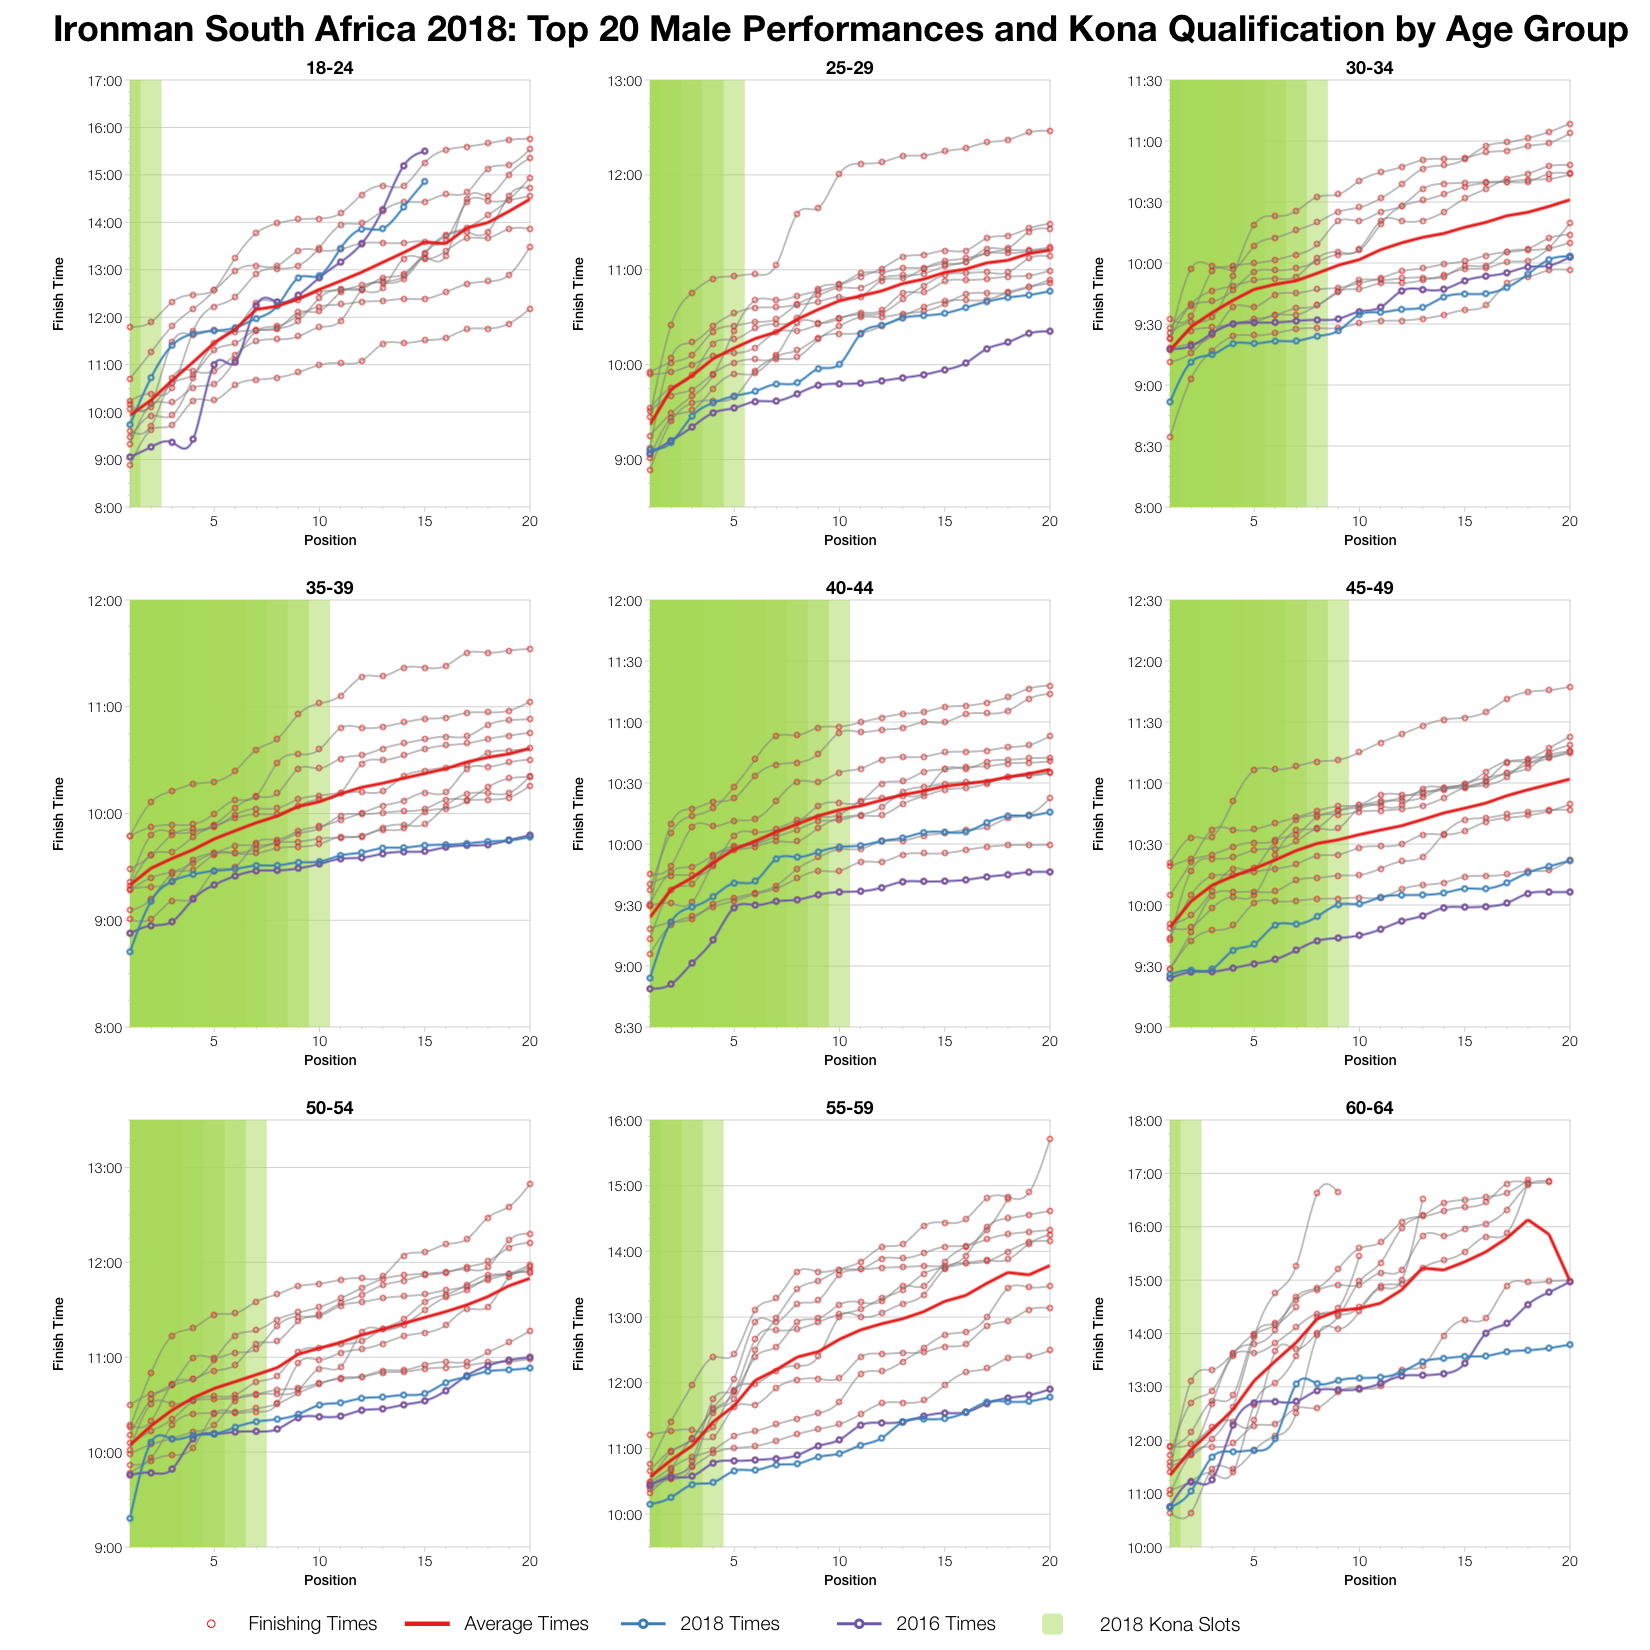
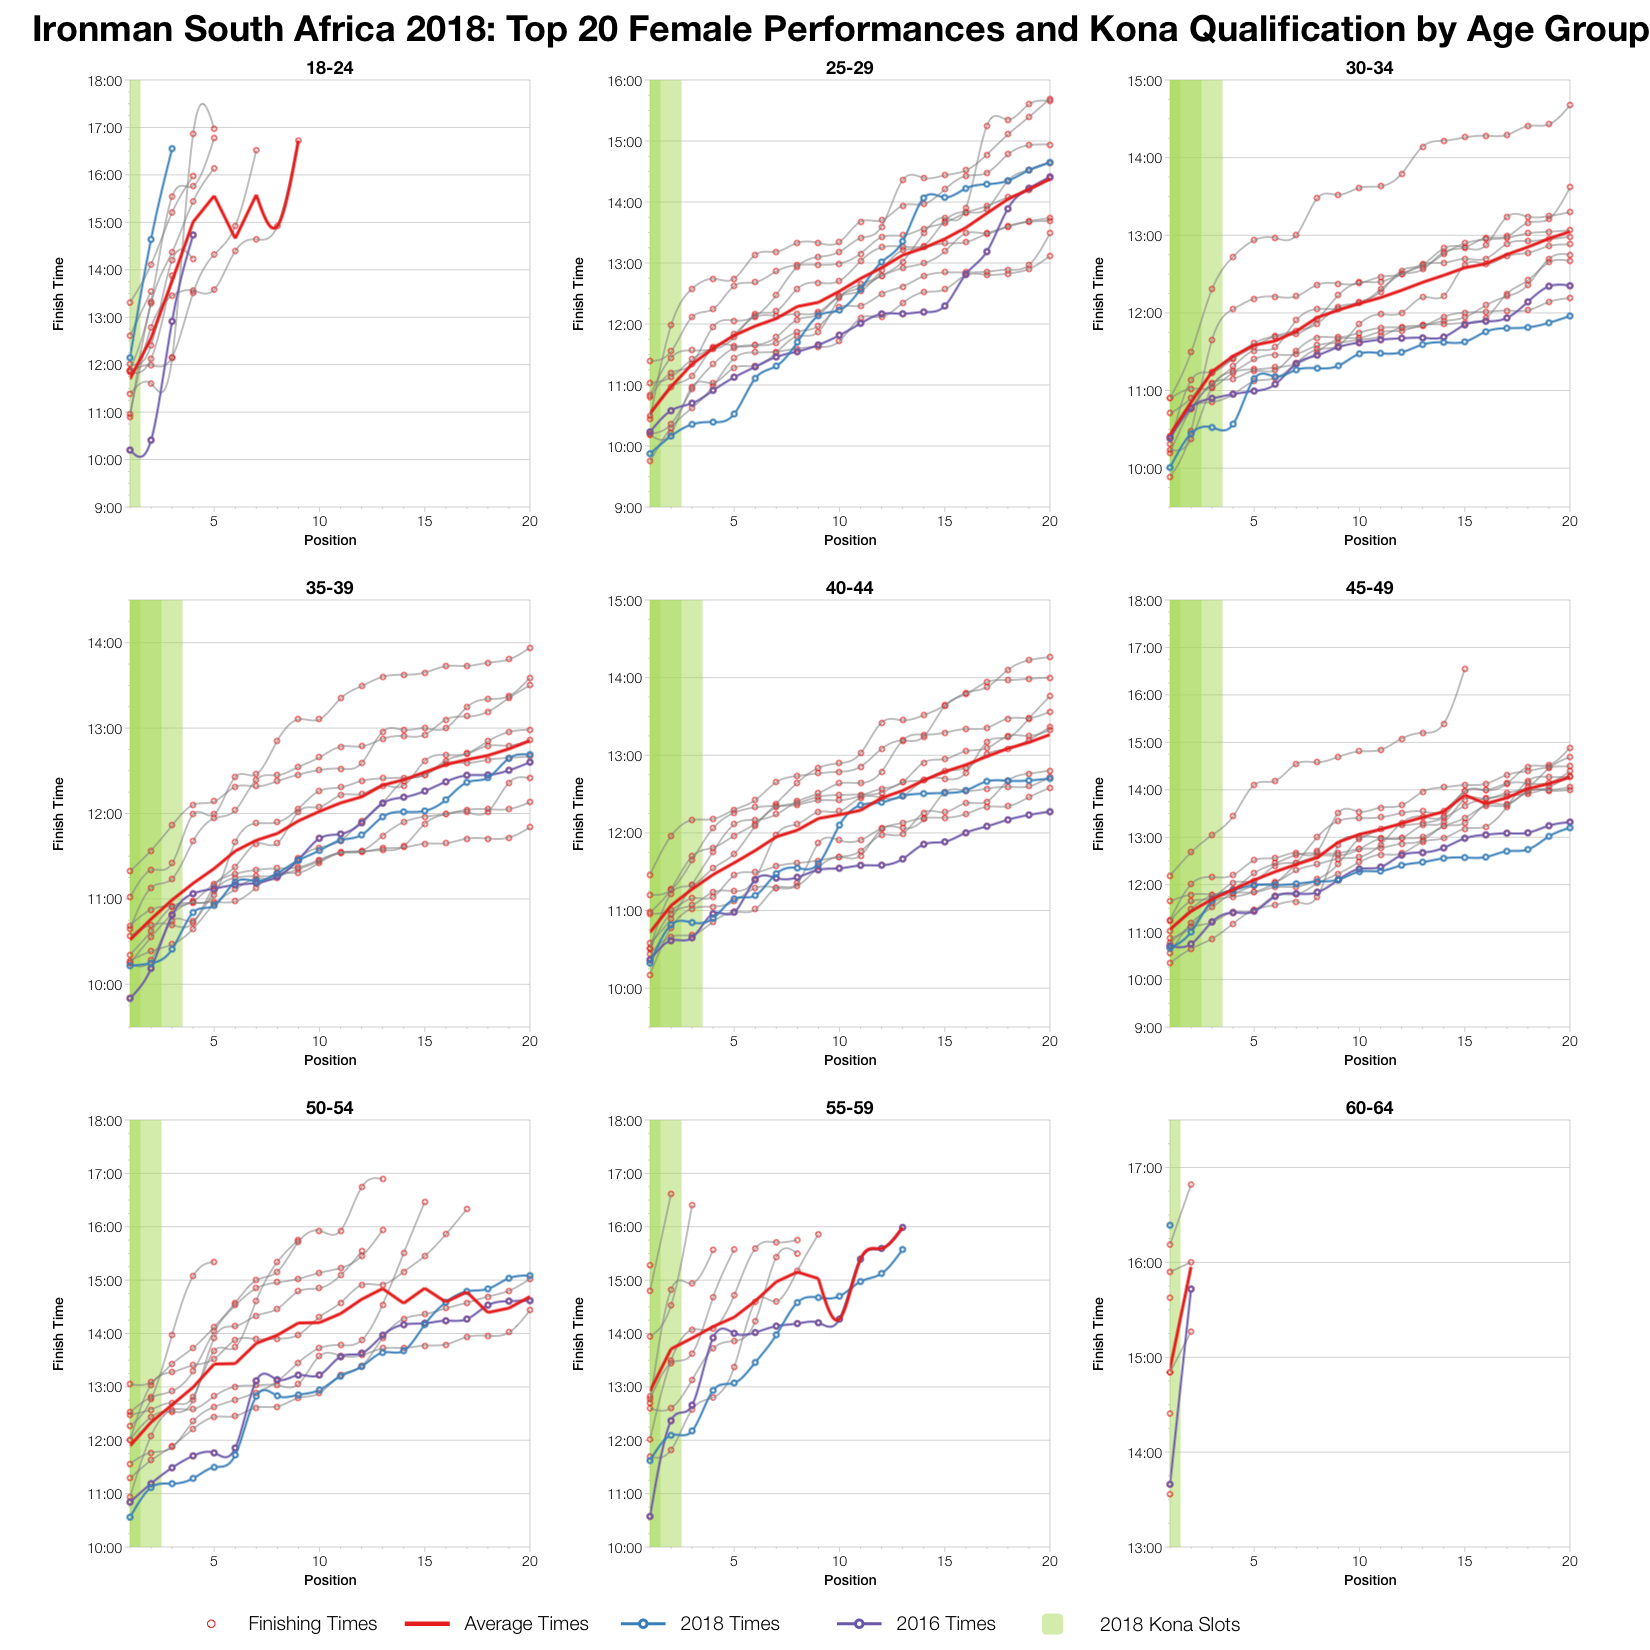
The final part of this analysis is a look at how athletes at the front of their age groups performed. The times of the top twenty in each with particular emphasis on those that might qualify. Firstly the trend this year was faster than the average and very similar to last year’s results. I think this highlights that for the front of pack the course is clearly faster and the average is brought down by the older races. Although the ratio of slots is good, qualifying is a challenge as outside of outlying age group winners times tend to be very tight among qualifiers.
You can access a spreadsheet of the results and splits from Ironman South Africa 2018 on my Google Drive.


