Ironman World Championship 2018: Age Group Results

Latest statistics for the Ironman World Championship

Results are in from the 2018 Ironman World Championship in Kona so here’s my analysis of age group performances at this year’s race. From the available results it appears that, once again, the field grew in Kona with almost 2,400 competitors making the start line. The Kona course isn’t the easiest, but times always trend fast thanks to the highly selective field.

Distribution of Finisher Splits at the 2018 Ironman World Championship Compared with 2008-2017

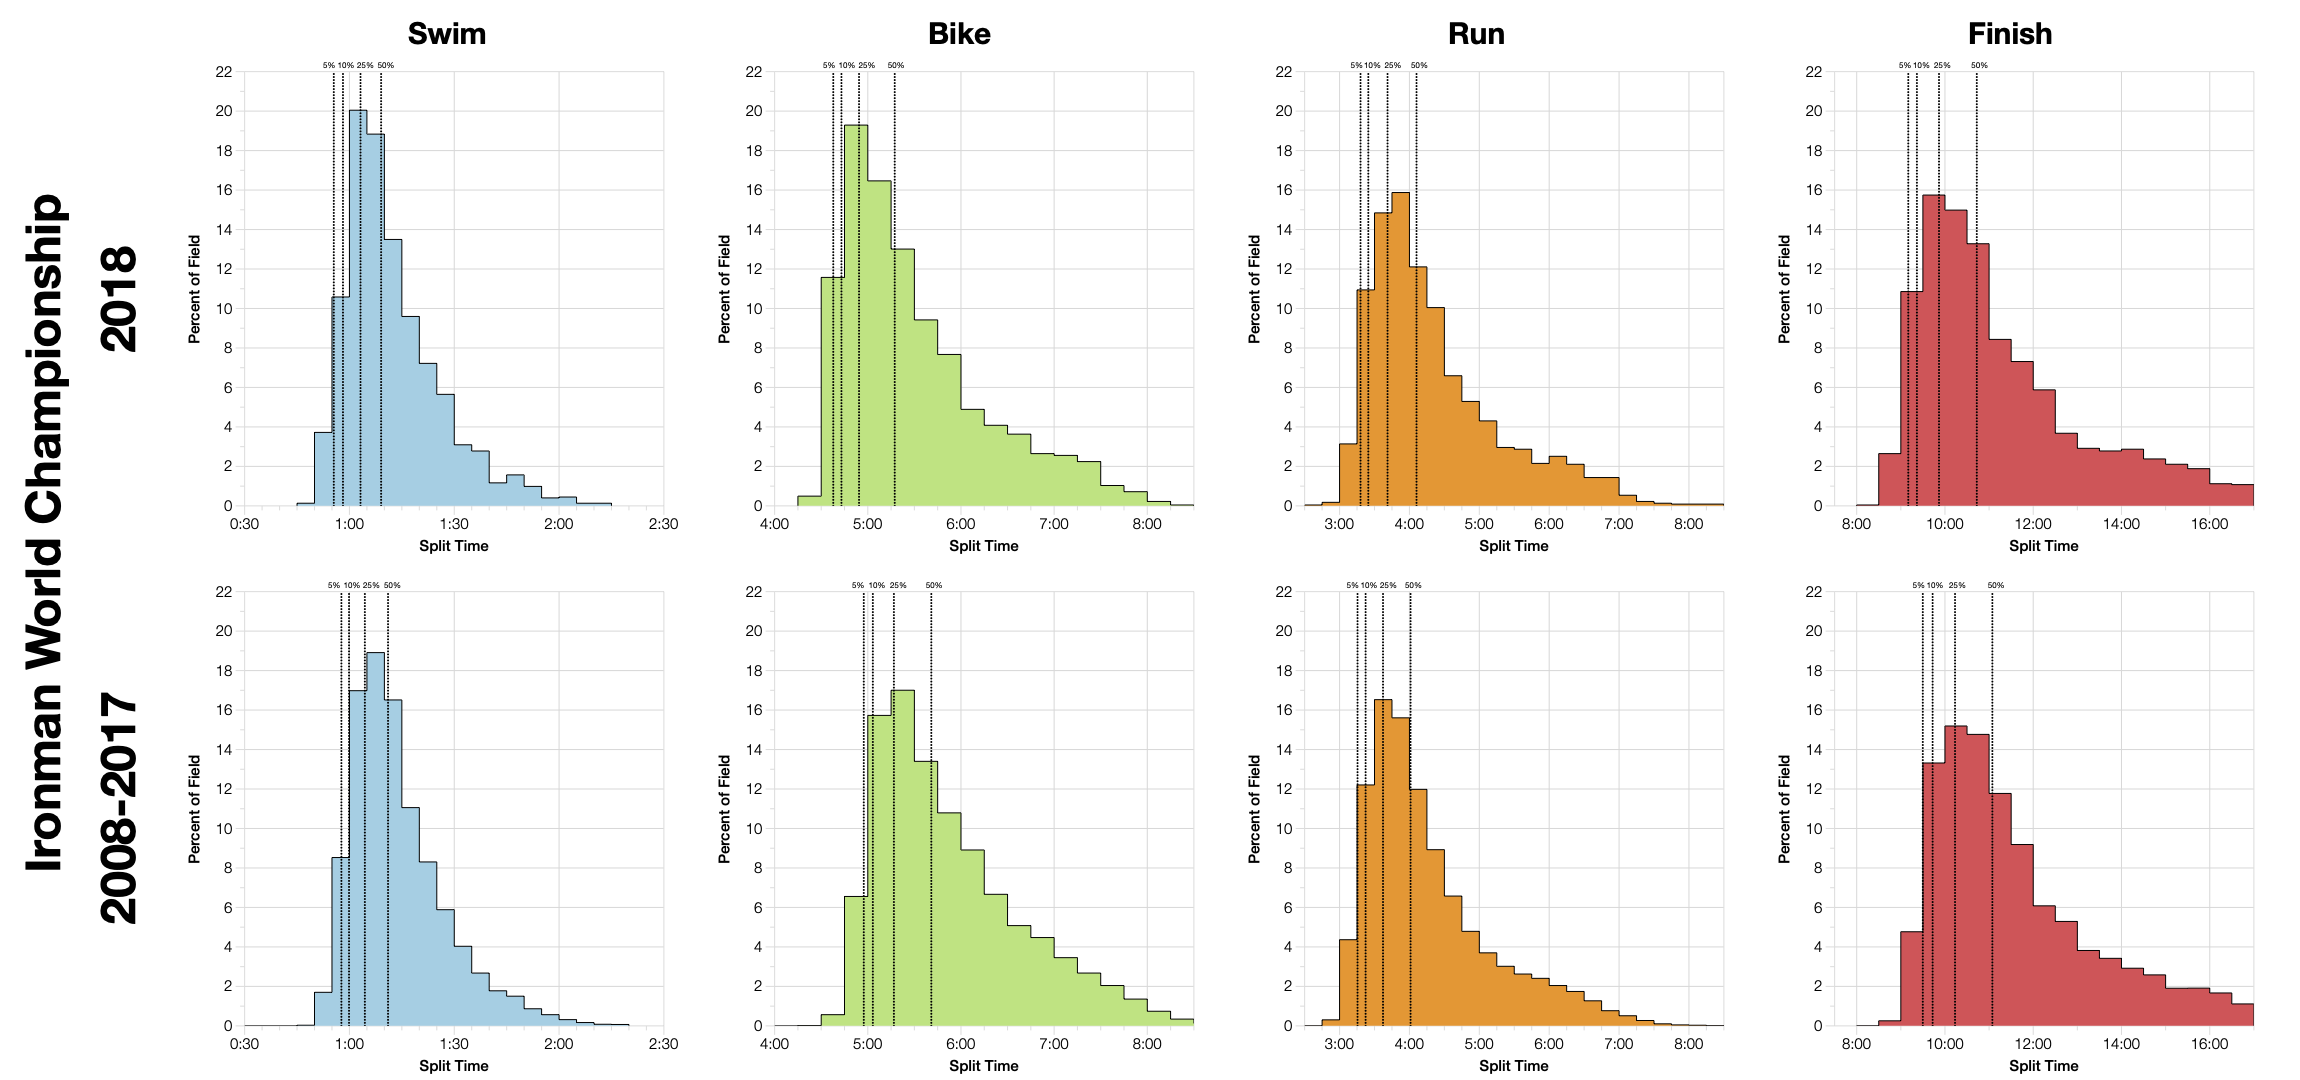
That selection process is obvious from the results distributions – the heavy skew towards fast times at each split of the race and in the overall times. Of note this year is the faster swim and bike splits. Remembering we’re comparing with amalgamated data that incorporates a range of conditions on the course, both swim and bike was clearly faster. Run trends a little slower though, but not enough to stop the overall times coming in faster.

DNS and DNF Rates at Ironman World Championship
Year
Listed Athletes
Swim Finish
Swim DNS/DNF
Bike Finish
Bike DNF
Run Finish
Run DNF
Overall DNS/DNF
2003
1713
1625
5.1%
1610
0.9%
1568
2.6%
8.4%
2004
1797
1705
5.1%
1660
2.6%
1575
5.1%
12.2%
2005
1797
1724
4.1%
1724
1686
2.2%
6.1%
2006
1786
1687
5.5%
1669
1.1%
1620
2.9%
9.1%
2007
1835
1777
3.2%
1738
2.2%
1682
3.2%
8.2%
2008
1808
1733
4.1%
1697
2.1%
1633
3.8%
9.5%
2009
1853
1804
2.6%
1732
4%
1649
4.8%
10.8%
2010
1927
1841
4.5%
1814
1.5%
1768
2.5%
8.1%
2011
1918
1851
3.5%
1832
1%
1770
3.4%
7.5%
2012
1983
1983
1952
1.6%
1886
3.4%
4.8%
2013
2067
2064
0.1%
2040
1.2%
1970
3.4%
4.4%
2014
2187
2108
3.6%
2057
2.4%
1984
3.5%
9.2%
2015
2308
2295
0.6%
2240
2.4%
2137
4.6%
7.3%
2016
2315
2208
4.6%
2185
1%
2114
3.2%
8.6%
2017
2347
2339
0.3%
2291
2.1%
2214
3.4%
5.8%
2018
2385
2379
0.3%
2349
1.3%
2306
1.8%
3.3%

Conditions do appear to have been quite favourable this year. Although DNF figures are generally low in Kona, this years are particularly low. It’s worth noting that some of the previous years will likely mix DNS and DNF numbers together boosting the figures a little for sims and overall. We can also clearly see the growth in the number of athletes over the last decade in the figures.

Median Splits by Age Group at the 2018 Ironman World Championship
Median Splits by Age Group at the Ironman World Championship 2008-2017

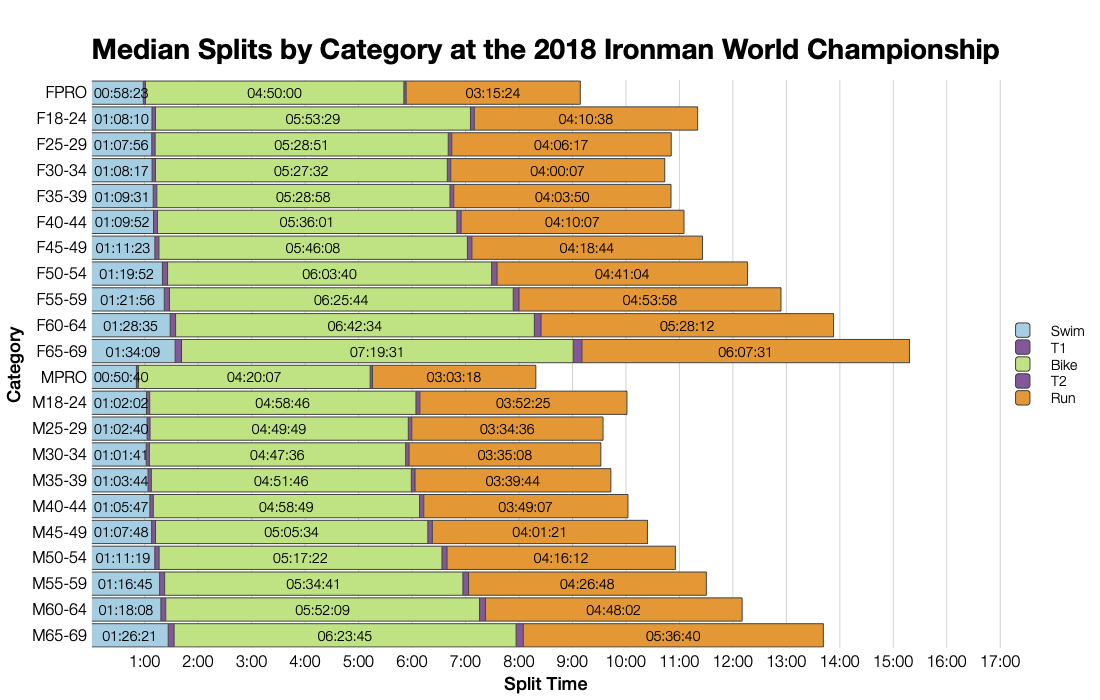
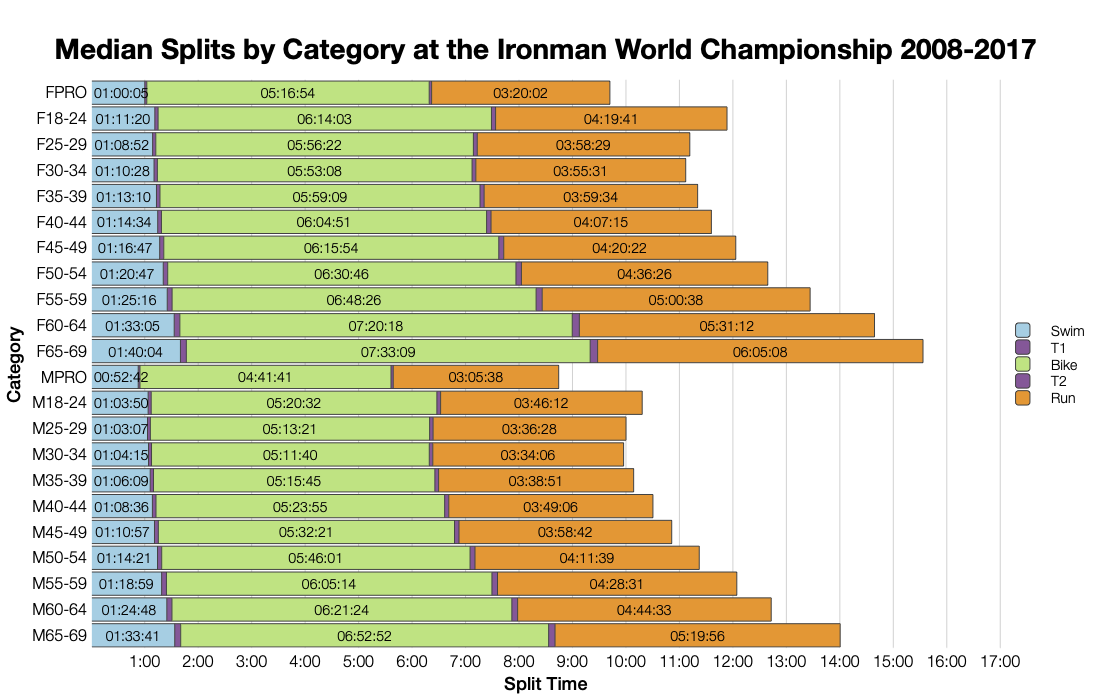
Median trends reflect those shown in the distributions – clearly faster bike medians and slower run medians for most. This years race appears to have had good conditions for biking as medinas are about 20-25 minutes faster for many age groups.

Top 10 Nationalities at Ironman World Championship
Country
Count
Percentage
United States
639
25.8
Germany
216
8.7
Australia
206
8.3
United Kingdom
132
5.3
Canada
127
5.1
France
118
4.8
Japan
91
3.7
Belgium
71
2.9
Switzerland
69
2.8
Brazil
65
2.6
Ironman World Championship 2018 Age Group Winners by Country
Country
Percentage of Winners
Percentage of Field
United States
19.2
25.8
Denmark
11.5
2.1
Germany
7.7
8.7
Netherlands
7.7
1.2
Belgium
7.7
2.9
Sweden
7.7
2.5
South Africa
3.8
0.7
Finland
3.8
0.8
United Kingdom
3.8
5.3
Austria
3.8
1.5
New Zealand
3.8
2.5
Canada
3.8
5.1
Switzerland
3.8
2.8

About a quarter of the field come from the US with the rest spread around the world. Age group winners also tend to come from the US too, although not proportionally.

Changes in Male Finishing Times by Position at the Ironman World Championship
Changes in Female Finishing Times by Position at the Ironman World Championship

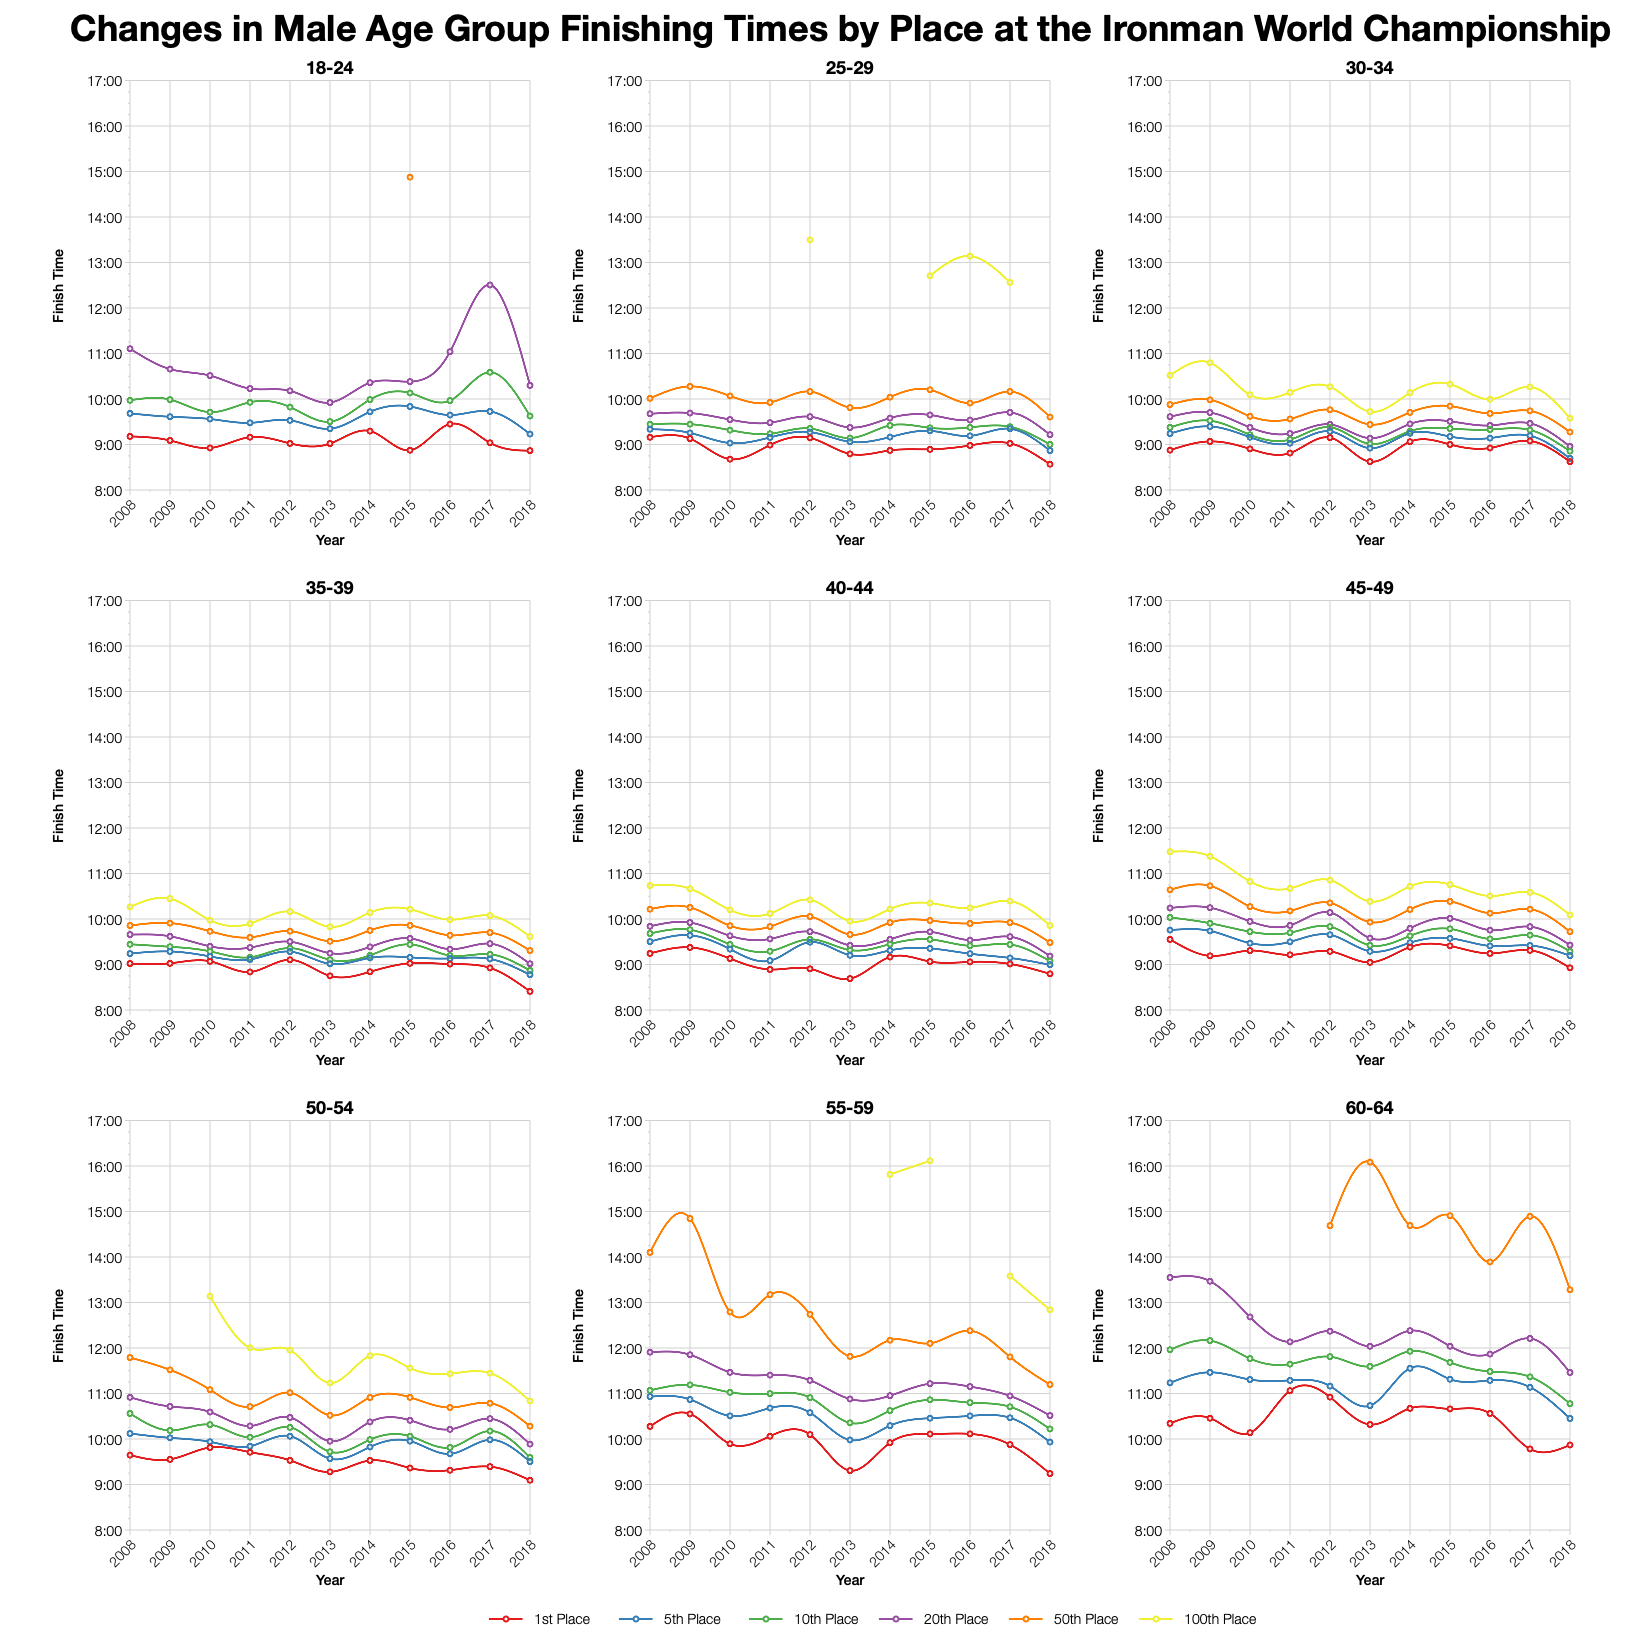
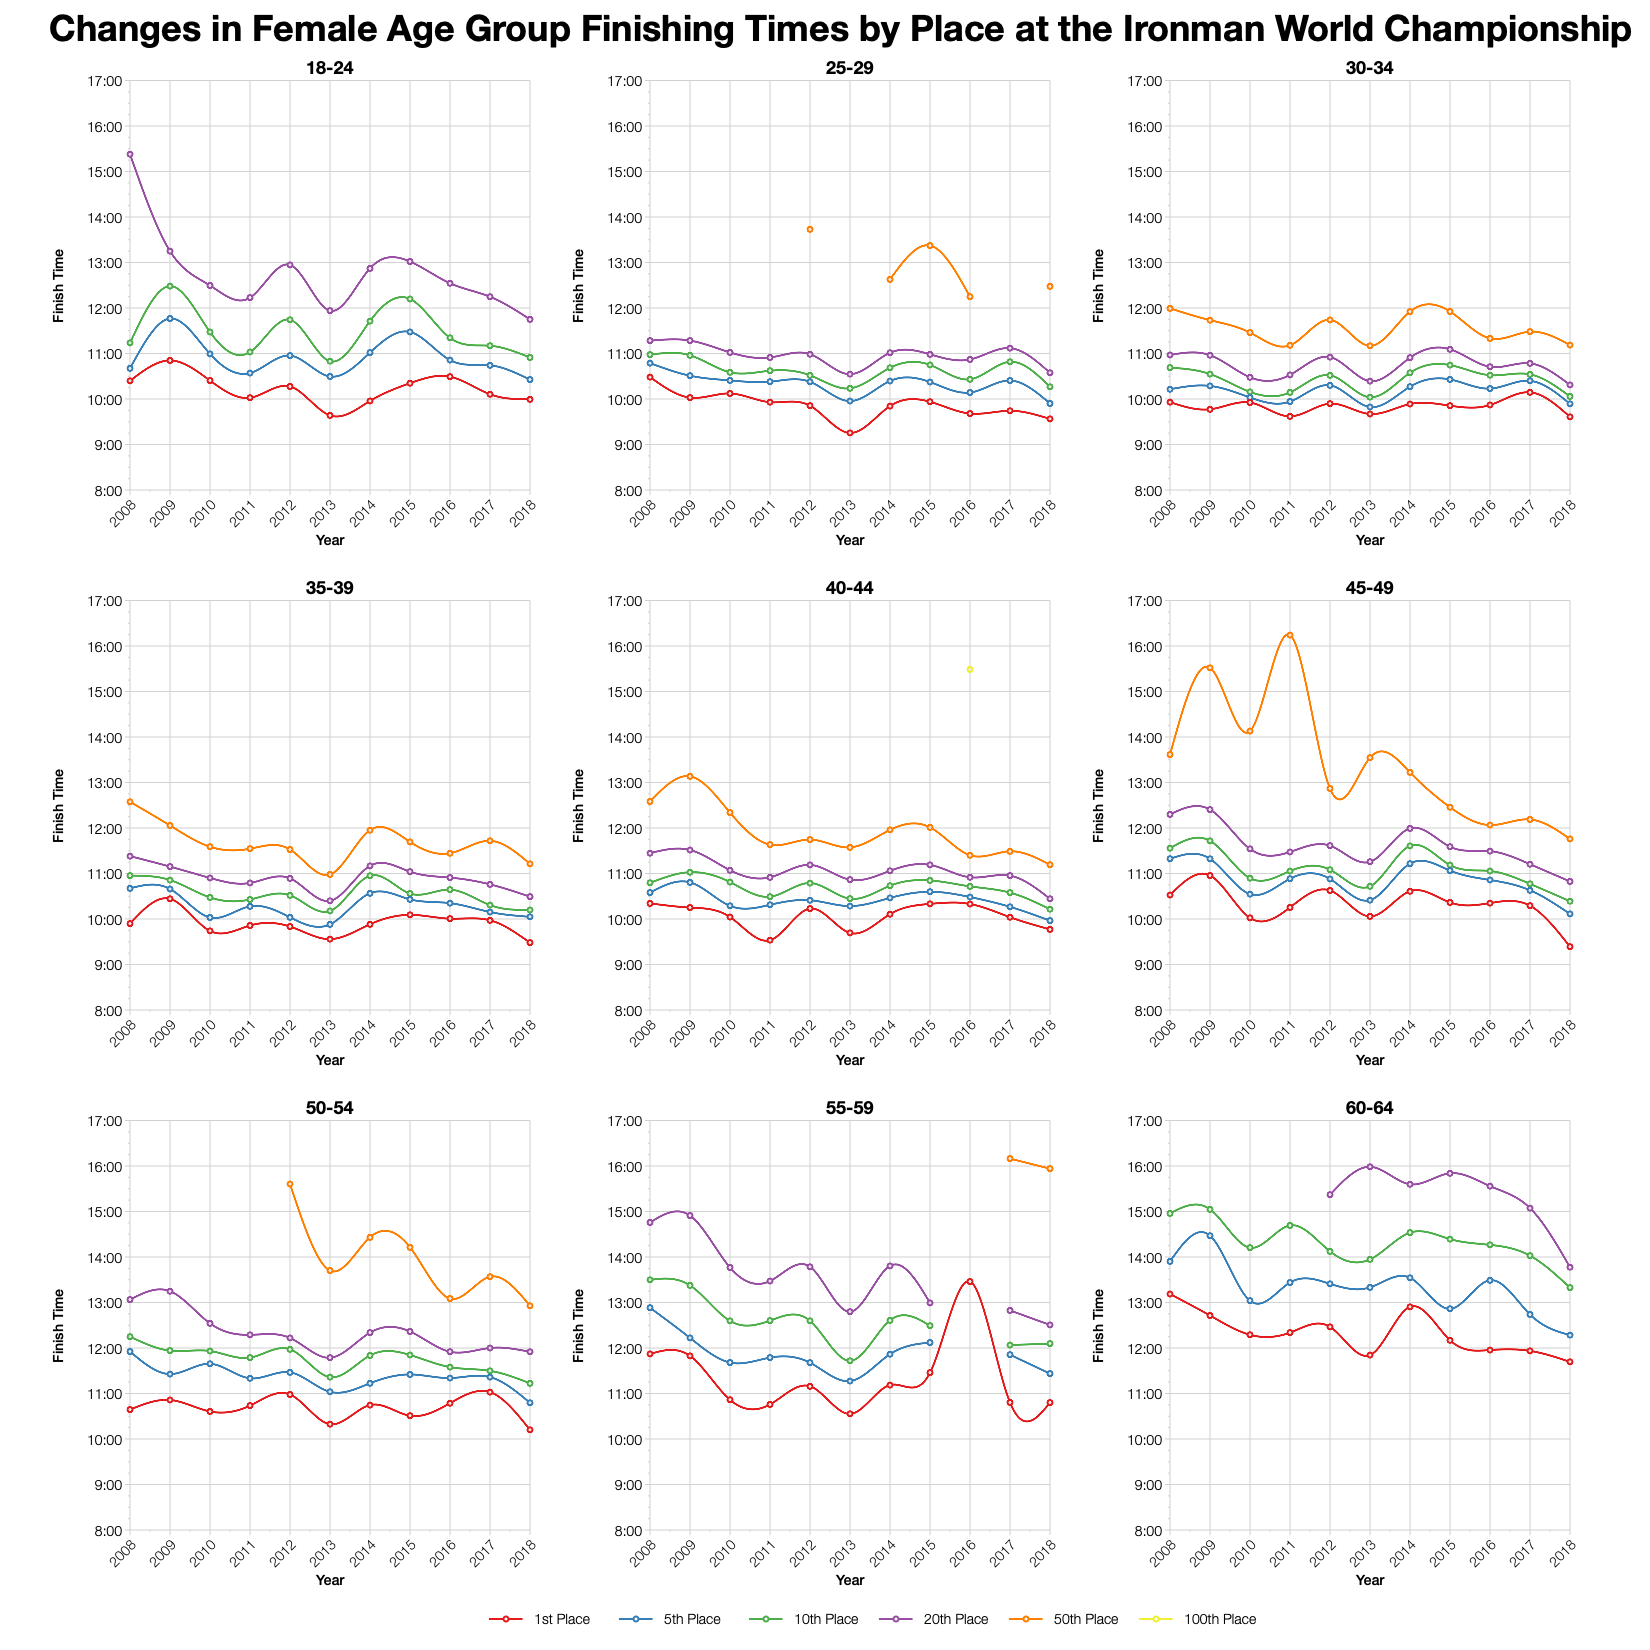
There’s fluctuation in age group finish times by position over the years, generally within a small range, but definite ups and downs. This year shows the marked improvement in times for specific places that the other charts have shown so far.

Ironman World Championship 2018 Age Group Winning Times
Age Group
Winner
M18-24
08:51:50
M25-29
08:34:01
M30-34
08:37:15
M35-39
08:24:36
M40-44
08:47:40
M45-49
08:55:33
M50-54
09:05:37
M55-59
09:14:23
M60-64
09:52:08
M65-69
11:00:54
M70-74
11:55:03
M75-79
13:06:03
F18-24
09:59:35
F25-29
09:33:46
F30-34
09:36:26
F35-39
09:28:48
F40-44
09:46:18
F45-49
09:23:25
F50-54
10:12:02
F55-59
10:47:57
F60-64
11:41:44
F65-69
12:28:43
F70-74
14:28:50

These are the age group winning times for major age groups finishing at Kona. Although it’s not clear from the Ironman website, age group winners have also received Kona slots for the following year in the past. You can compare this with the Kona averages and other race on my Kona qualification page. Not many races will have so many significant sub-9 hour age group winners.

Top Twenty Male Performances by Age Group at the 2018 Ironman World Championship
Top Twenty Female Performances by Age Group at the 2018 Ironman World Championship

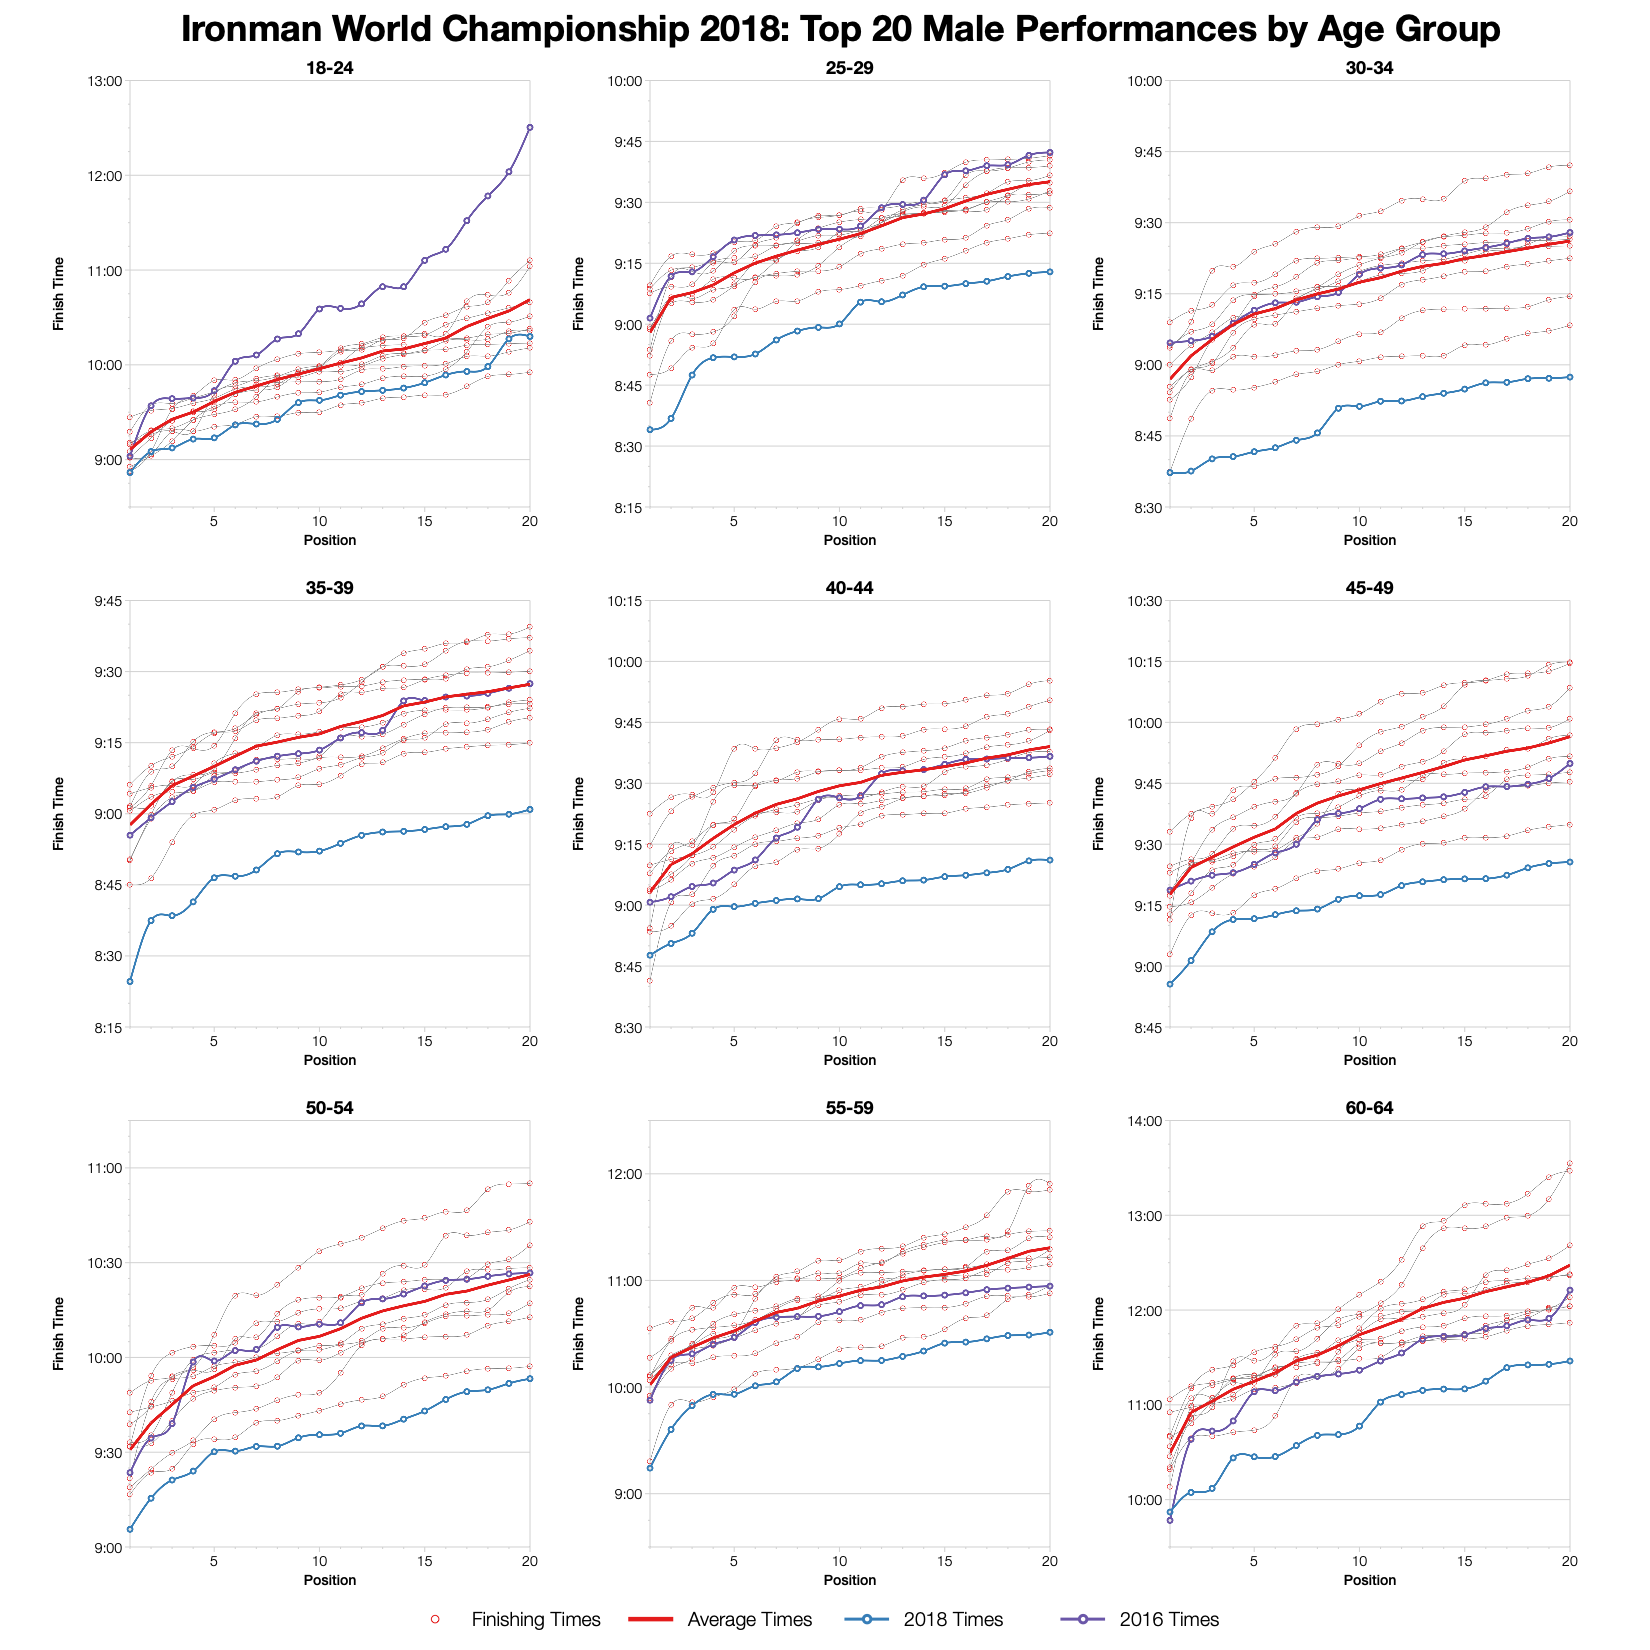
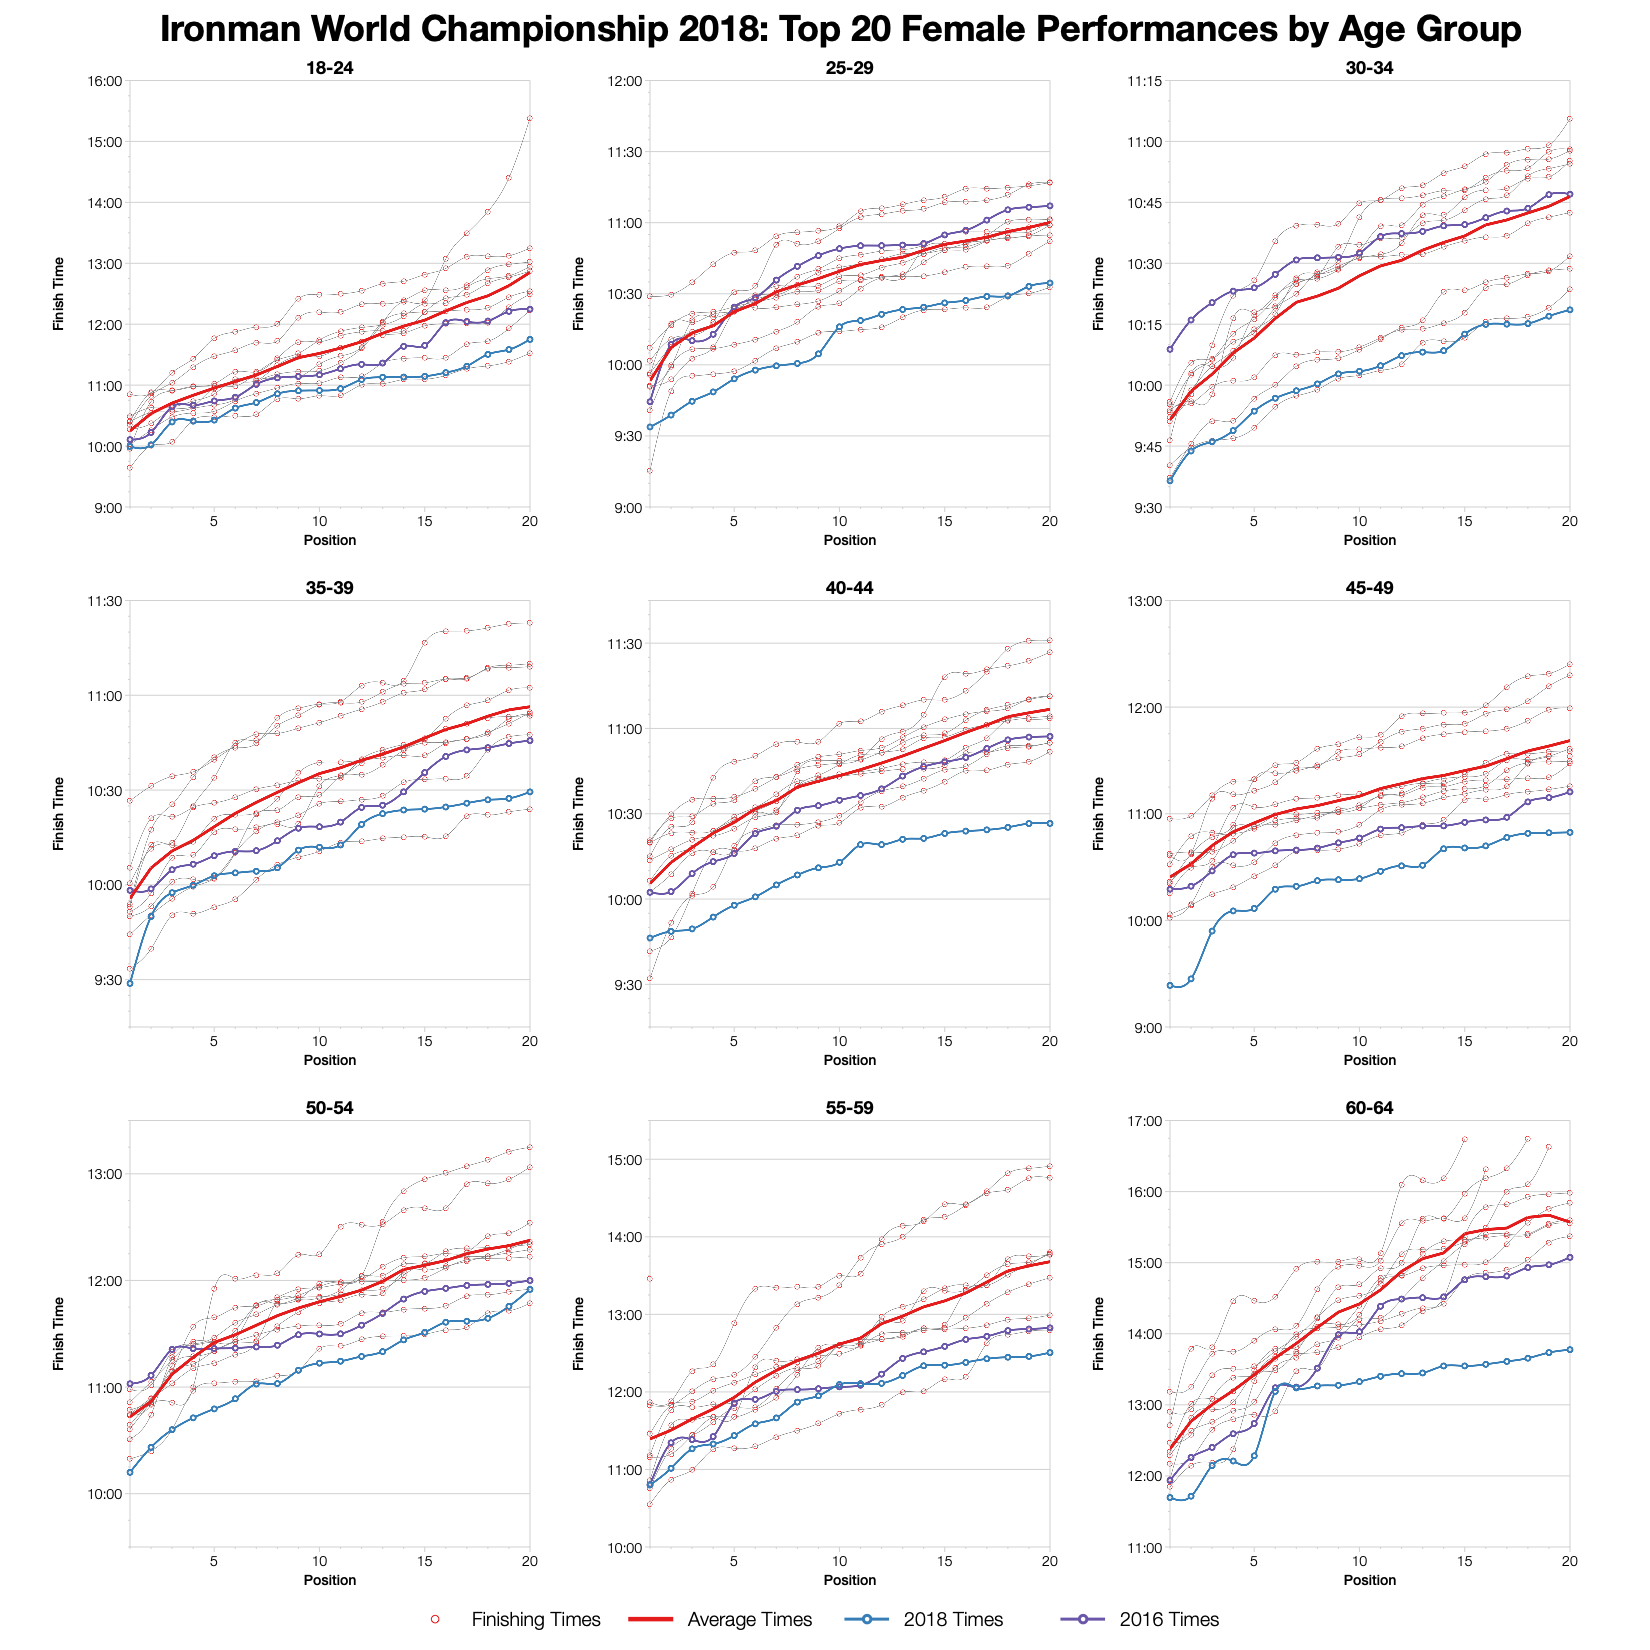
The age group top twenty times universally trend faster than the average and most of the previous years. There have been some faster times in previous years, but not many. Again, it’s very clear that this years race results trend at the fast end of Kona times.

You can access a spreadsheet of the full results from the 2018 Ironman World Championship on my Google Drive.

Latest statistics for the Ironman World Championship

Kona Qualification

Compare qualification times across the Ironman Calendar.

Kona Consultancy

Individual race analysis and guidance for Kona qualification.

Support the Stats

Support the continued development of these stats.

Comments